


0
US Dollar Index
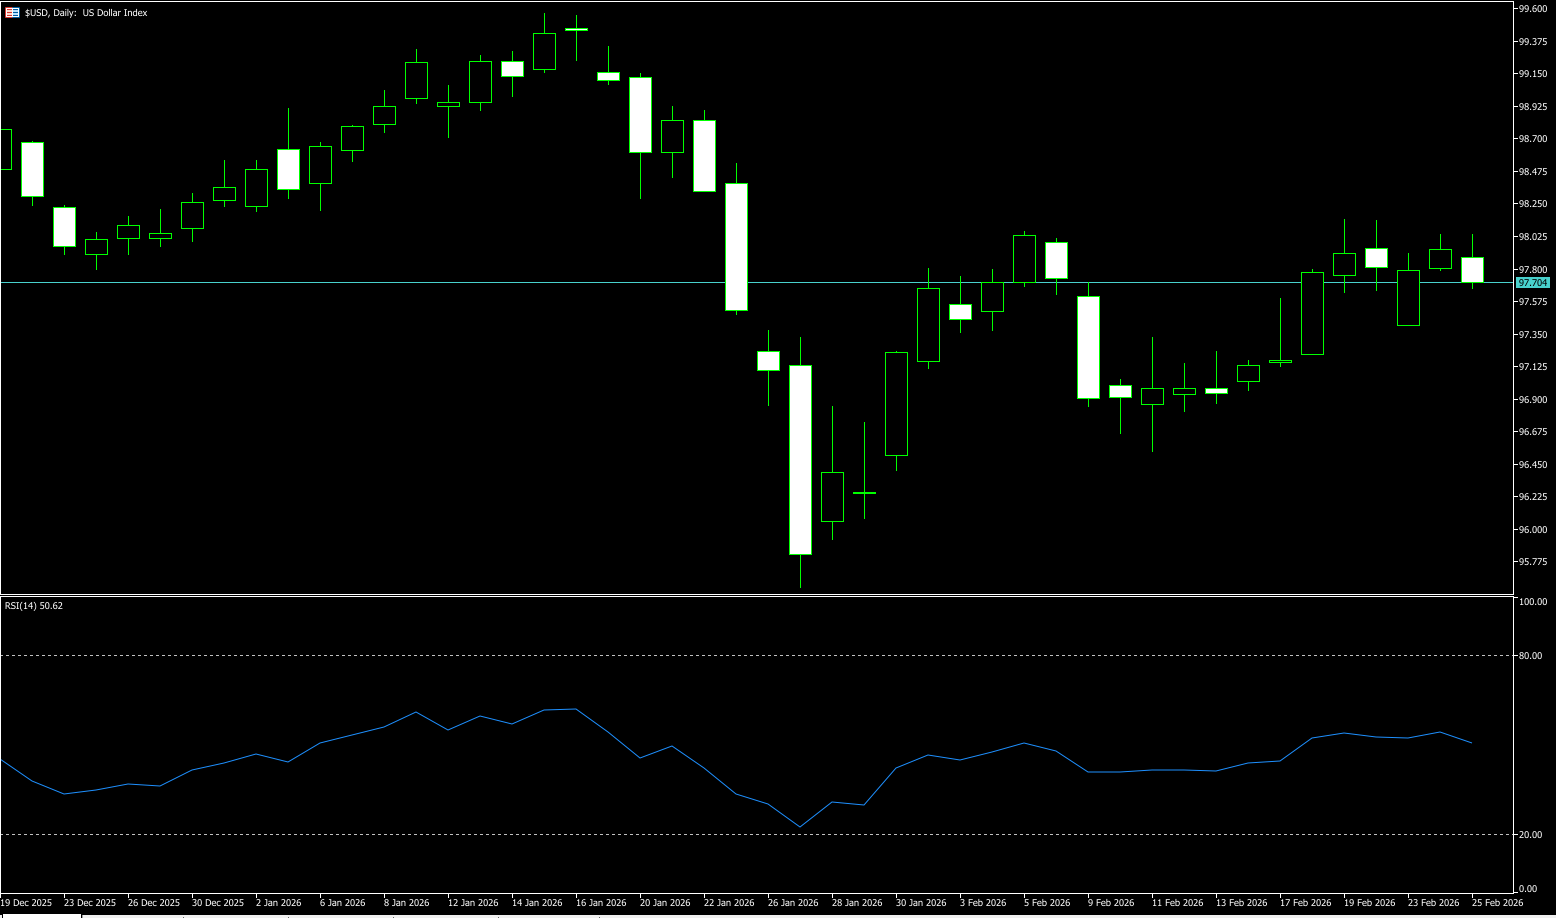
The US dollar fluctuated around 97.65 on Wednesday. Recent hawkish comments from several Federal Reserve officials, warning that inflation remains too high, significantly cooled market expectations for interest rate cuts, providing support for the dollar's strength. Chicago Fed President Goolsby pointed out that the current 3% inflation rate is still far from the Fed's statutory target of 2%, therefore he opposes a concentrated series of rate cuts. As a result, the market's probability of a March rate cut has fallen to 4.1%, and the probability of a June rate cut has also fallen from 50.2% last week to 43.9%. Previously, Fed Governor Waller also expressed a similar hawkish stance, believing that if the job market continues to improve, the case for further rate cuts will weaken. The flurry of statements from these two officials has built a solid bottom for the dollar, allowing it to maintain its strength during this data vacuum period.
The US dollar index is currently testing resistance around the 65-day moving average (98.15) and the February 19 high of 98.07, with the upward momentum shifting from a sharp rise to a sideways trend. Despite a strong performance in the early morning, the dollar index has shown signs of weakening momentum after hitting technical resistance levels in the past few hours, exhibiting a clear sideways consolidation pattern. The market is currently repeatedly testing 98.07 and 98.15. This movement indicates that bulls are cautious before key levels, and the market is digesting earlier positive comments and looking for a catalyst for further breakthroughs. If it can effectively hold this level, the dollar is expected to initiate a medium-term trend reversal, targeting the 200-day moving average at 98.37. Technically, attention is focused on the potential for a rapid upward move after the breakout, while the support zone below remains solid. From the current technical pattern, the short-term support level is at 97.35 (20-day moving average), and the main support zone remains at the 97.00 (psychological level).
Today, consider shorting the US Dollar Index around 97.77; Stop loss: 97.88; Target: 97.30; 97.20
WTI Crude Oil
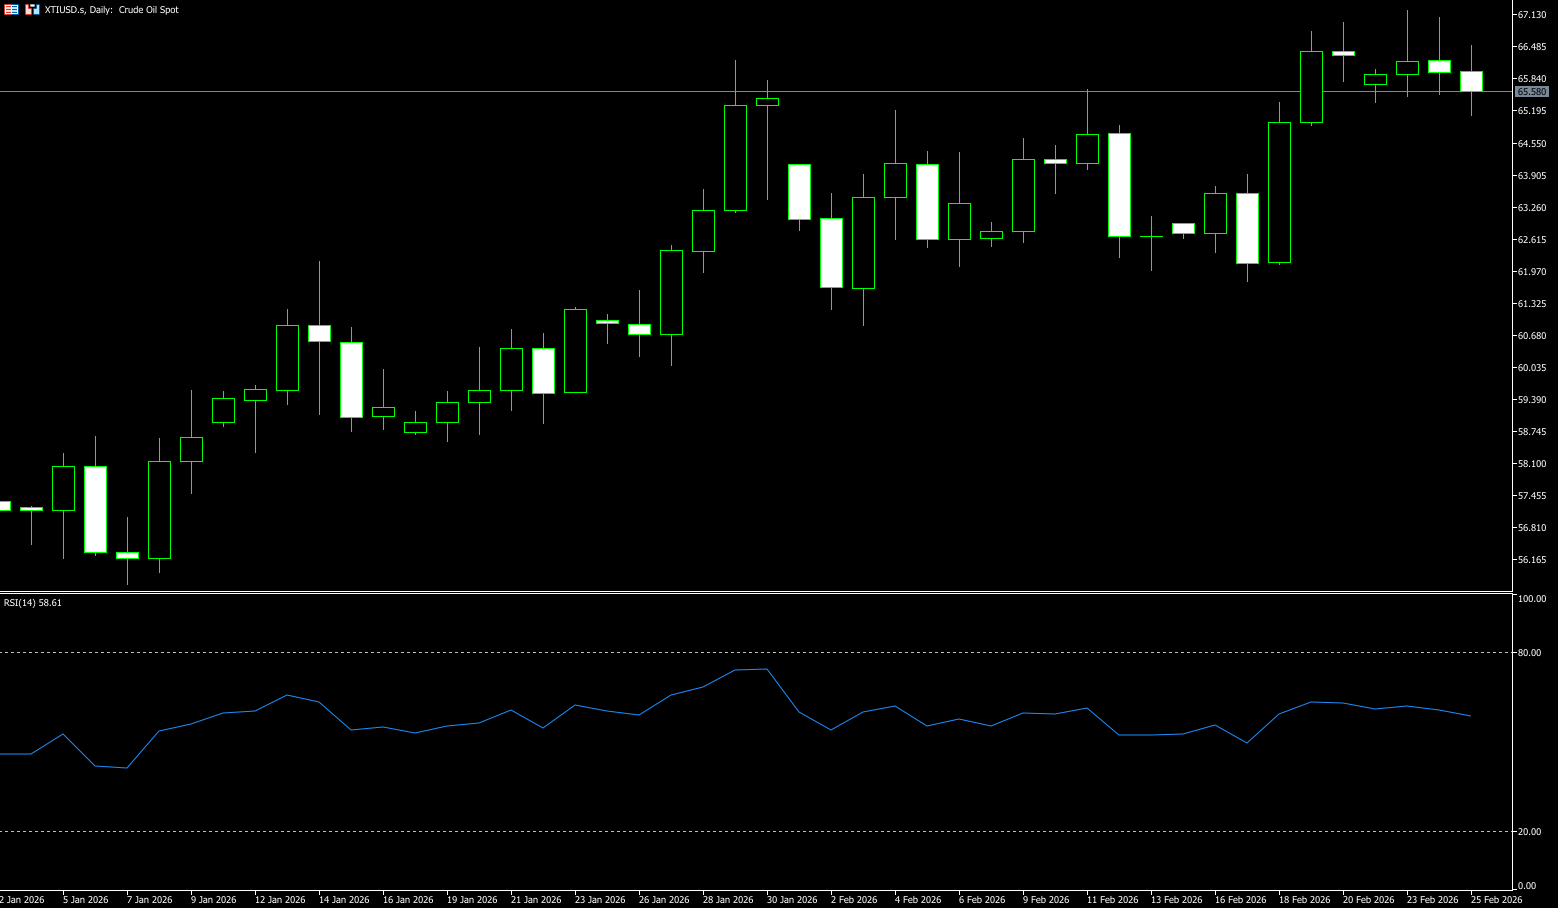
WTI crude oil traded around $65.60 per barrel on Wednesday, with geopolitical tensions dominating the market. Iranian Deputy Foreign Minister Ravanchi stated that Iran is prepared to reach an agreement with the US as soon as possible, limiting oil price gains. The core logic supporting the strength of oil prices remains inseparable from the uncertainty of the Middle East. Market attention is focused on the disagreement over Iran's nuclear program and its potential spillover risks. The US has warned of serious consequences if no agreement is reached, significantly increasing the market's pricing weight for "tail risks," forcing funds to pay a premium to hold protective long positions. The real deciding factor lies in the second round of US-Iran talks scheduled for Thursday. If the talks signal an escalation of tensions, especially regarding risks to transportation routes, the upward potential of oil prices could be ignited instantly. Conversely, if signs of easing emerge, the accumulated risk premium will be quickly reversed, and oil prices may fall from their highs, returning to fundamentals.
In summary, oil prices are currently caught in a fierce struggle between macroeconomic pricing pressures and a strong geopolitical risk premium. The area around $67.24 (this week's high) is a pressure test zone for sentiment and risk premiums; a break above this level with significant volume would redefine the high-level range. Meanwhile, $64.42 (the 20-day moving average) is a key support level for easing risks; a breach of this level could lead to a retest of the $62.29 (200-day moving average) level. The areas around $68.37 (the high of July 14th last year) and $70.00 (a psychological level) constitute strong resistance. The outcome of Thursday's talks will be crucial in determining the future: will the risk premium continue to expand, pushing prices to new heights, or will the bubble burst and prices return to calm?
Today, consider going long on crude oil around 65.40; stop loss: 65.25, target: 67.00; 67.20
Spot Gold
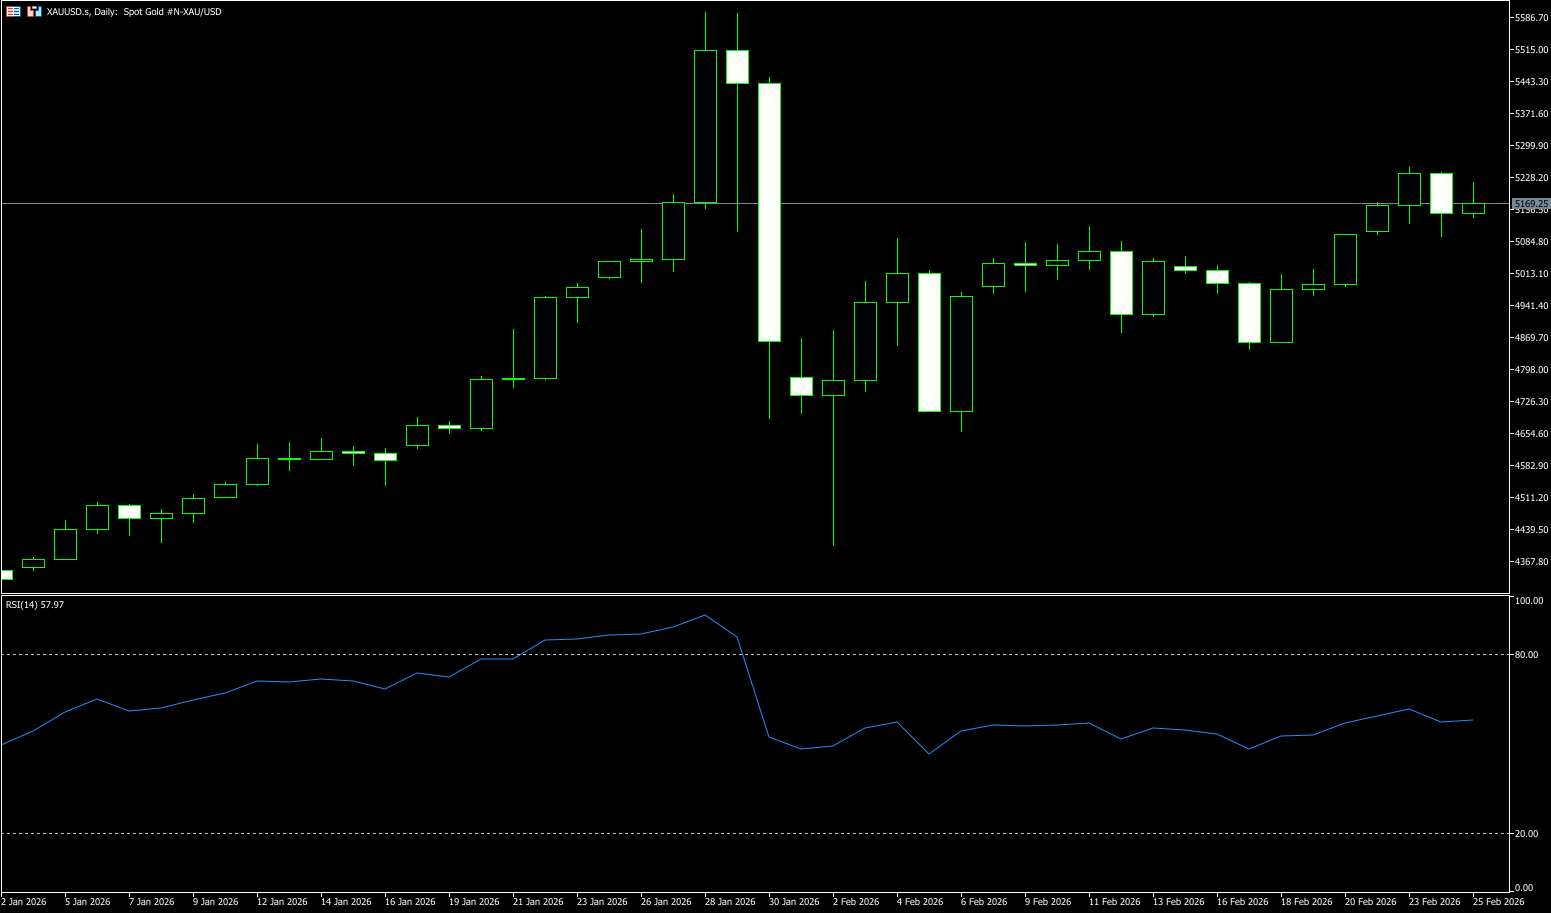
On Wednesday morning in Asian trading, spot gold was trading around $5,170 per ounce. Warnings from several Federal Reserve officials that inflation remained too high significantly cooled expectations for interest rate cuts, dragging down gold prices that had been driven by increased safe-haven demand. The recent strong upward rebound in gold prices began with a sharp intraday sell-off at 11 PM last Friday. At 11 PM last Friday, the US Supreme Court ruled that the tariffs announced by Trump under IEEPA were illegal, forcing the president to sign an executive order canceling the tariffs imposed under IEEPA and ordering refunds. The market initially thought that global tariffs might ease, leading to a rapid pullback in gold prices at that time. However, this pullback became the final drop before the rebound in gold prices. On the one hand, as the anchor for market interest rates, the downward trend in US Treasury yields significantly reduces the cost of holding gold. Simultaneously, the decline in long-term interest rates over the past six months has been significantly slower than that of short-term rates, and the widening futures-spot premium is further beneficial to gold.
Gold prices experienced increased volatility at the beginning of the week, approaching $5,250/oz before falling back below $5,100/oz. Trump's increase in global tariffs to 15% increased market uncertainty. Meanwhile, warnings from several Federal Reserve officials that inflation remains too high significantly cooled expectations for interest rate cuts, dragging down gold prices. Technically, spot gold broke through the $5,100-$5,125 bull-bear dividing line, then encountered resistance at the upper trendline of the ascending channel before pulling back. This can currently be considered a pullback after the breakout, with support around the $5,100-$5,125 (bull-bear dividing line). A break below this level would target $5.064 (9-day moving average) and the $5,000 (psychological level). The $5,238-$5,250 level, the high point at the beginning of this week, forms a short-term direct resistance zone. A break above this level could lead to further gains towards the $5,300 psychological level and the previous historical high of $5,598.
Consider going long on gold around $5,158 today; Stop loss: $5.152; Target: $5,210; $5,220
AUD/USD
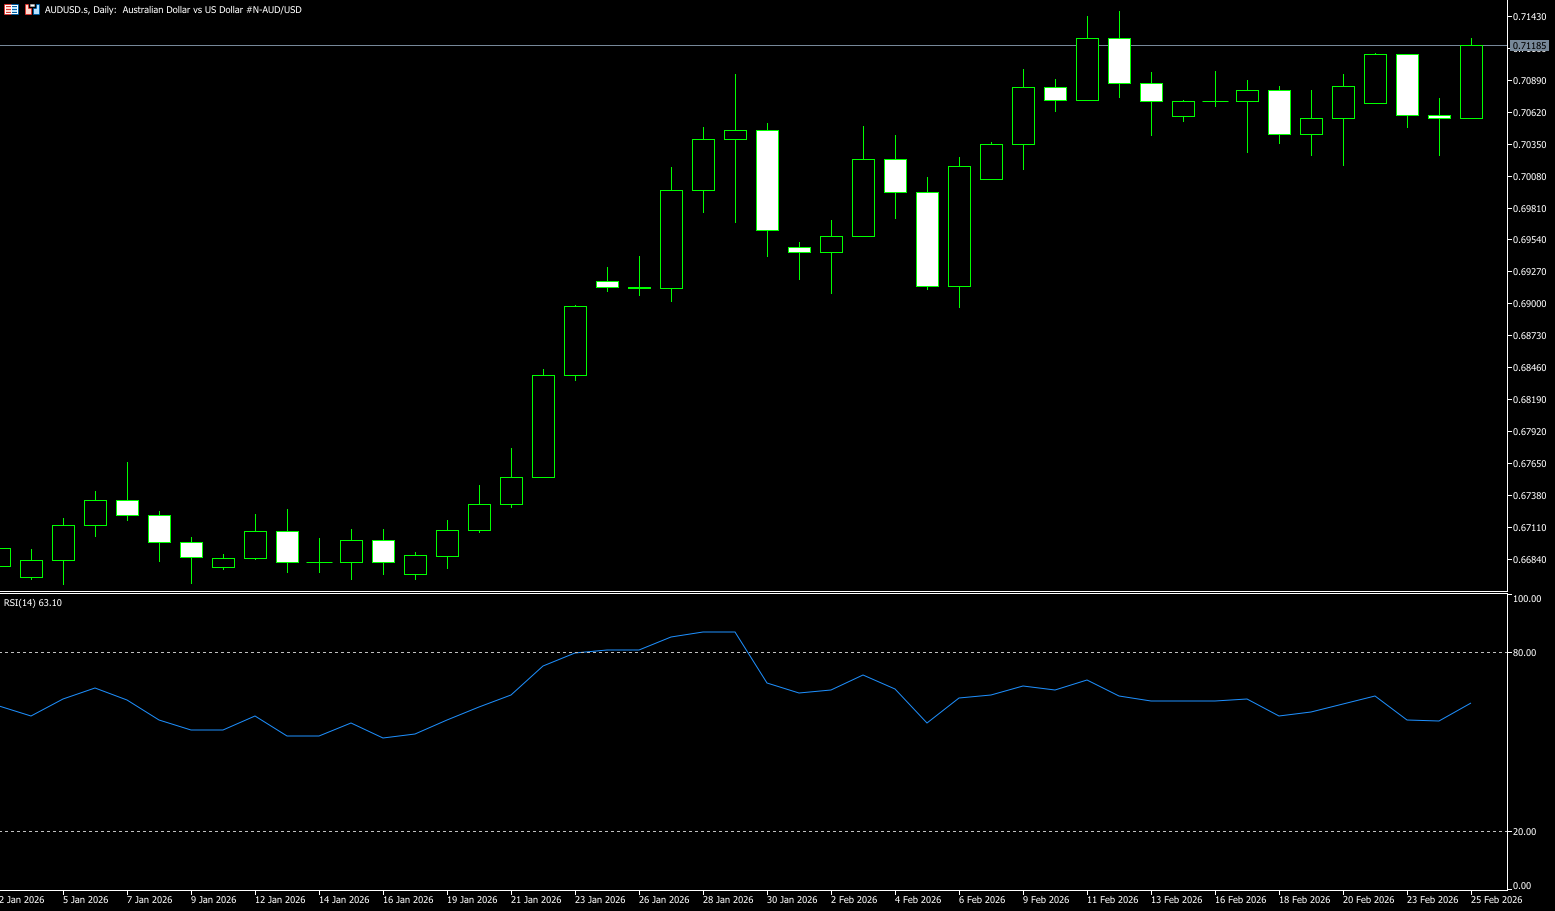
The Australian dollar rose to around $0.7120 on Wednesday, extending gains from the previous trading day, as higher-than-expected inflation data fueled market expectations for additional interest rate hikes this year. Annual inflation for January 2026 was 3.8%, exceeding market expectations of 3.7%. Meanwhile, the Reserve Bank of Australia's revised average consumer price index, a key indicator of underlying inflation, rose slightly to 3.4%, higher than market forecasts and December's 3.3%. The latest data followed a recent report showing that the unemployment rate remained at historically low levels in January, while wage growth remained high. The market now expects the central bank to raise the cash rate again in May, possibly to 4.1%, with a roughly 60% chance of another rate hike in November. Despite this, the Reserve Bank of Australia, which became the first major developed-market central bank to resume rate hikes earlier this year, remains committed to a data-dependent stance.
On the daily chart, AUD/USD is trading around 0.7120. The short-term bias is slightly bullish, as the spot price is firmly above the rising 20-day simple moving average near 0.7046, supporting a broader uptrend. The price has retraced to the 38.2% Fibonacci retracement level of 0.6870, suggesting that buyers are maintaining control within the current range from the 0.6421 low to the 0.7147 high. The 14-day Relative Strength Index (RSI) is hovering around 62, consistent with positive but not overextended momentum, indicating that the still-present trend is losing some strength rather than reversing. Initial support is at 0.7046 (20-day simple moving average), followed by the psychological level of 0.7000. A deeper pullback would expose the 30-day simple moving average at 0.6973, a test of which is expected to attract buying interest. On the upside, immediate resistance is at the recent high of February 12th at 0.7147; a sustained break above this level would open the door to the 0.7200 resistance level.
Consider going long on the Australian dollar today around 0.7110; Stop loss: 0.7100; Target: 0.7150; 0.7160
GBP/USD
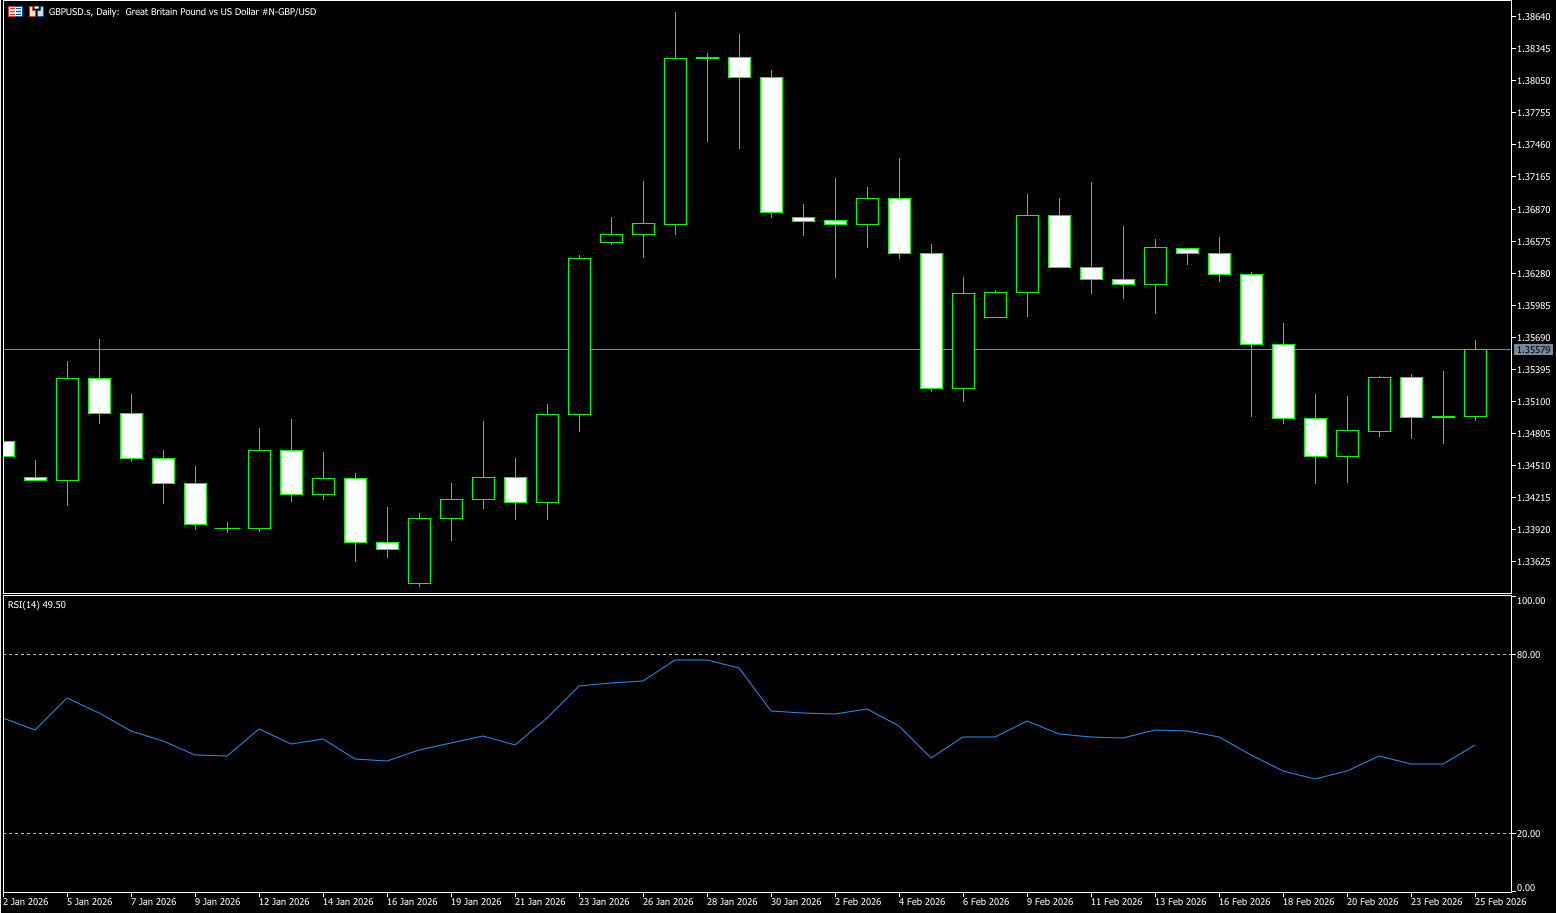
GBP/USD consolidated around the 1.3550 level mid-week. The pair had risen for two consecutive days, but a rebound in the US dollar from its lows weakened the pound's upward momentum. Regarding the US dollar, the market is focused on speeches by Federal Reserve officials. The Fed is currently maintaining a cautious stance. Federal Reserve Governor Christopher Waller stated that whether to support a March rate cut will depend on the performance of February's jobs market data. Currently, the market only prices in a very low probability of a March rate cut, but it is still pricing in gradual easing over the next year. Meanwhile, the Trump administration is considering imposing national security tariffs on certain industries under Section 232 of the Trade Expansion Act of 1962. This move is independent of the previously announced 15% global tariff policy. Trade uncertainty could weaken foreign investors' confidence in dollar assets, thus limiting the dollar's continued upside potential. Regarding the pound, expectations of a Bank of England rate cut continue to rise. Such dovish statements continue to suppress the pound's performance. Overall, the current volatility in the pound against the dollar reflects a complex interplay of differing policy paths between the UK and the US, coupled with trade uncertainty.
After falling for the second consecutive day at the start of the week and reaching a more than one-week low, the pound/dollar pair has rebounded above the 55-day simple moving average between 1.3500 and near 1.3522, a level that held as support during the January rebound and is now acting as a fulcrum. The 200-day simple moving average continues to rise around 1.3446, well below the current price action, maintaining the broad uptrend since the 2025 lows. The stochastic oscillator has crossed downwards and is drifting in oversold territory, suggesting the pullback from the 1.3870 high is extending downwards. A decisive break below 1.3500 (the psychological level) for GBP/USD would open a path to the 200-day simple moving average at 1.3446; conversely, a recapture of 1.3585 (the 34-day simple moving average) would allow buyers to revisit the psychological level of 1.3600.
Consider going long on GBP/USD around 1.3545 today; Stop loss: 1.3535, Target: 1.3580; 1.3590
USD/JPY
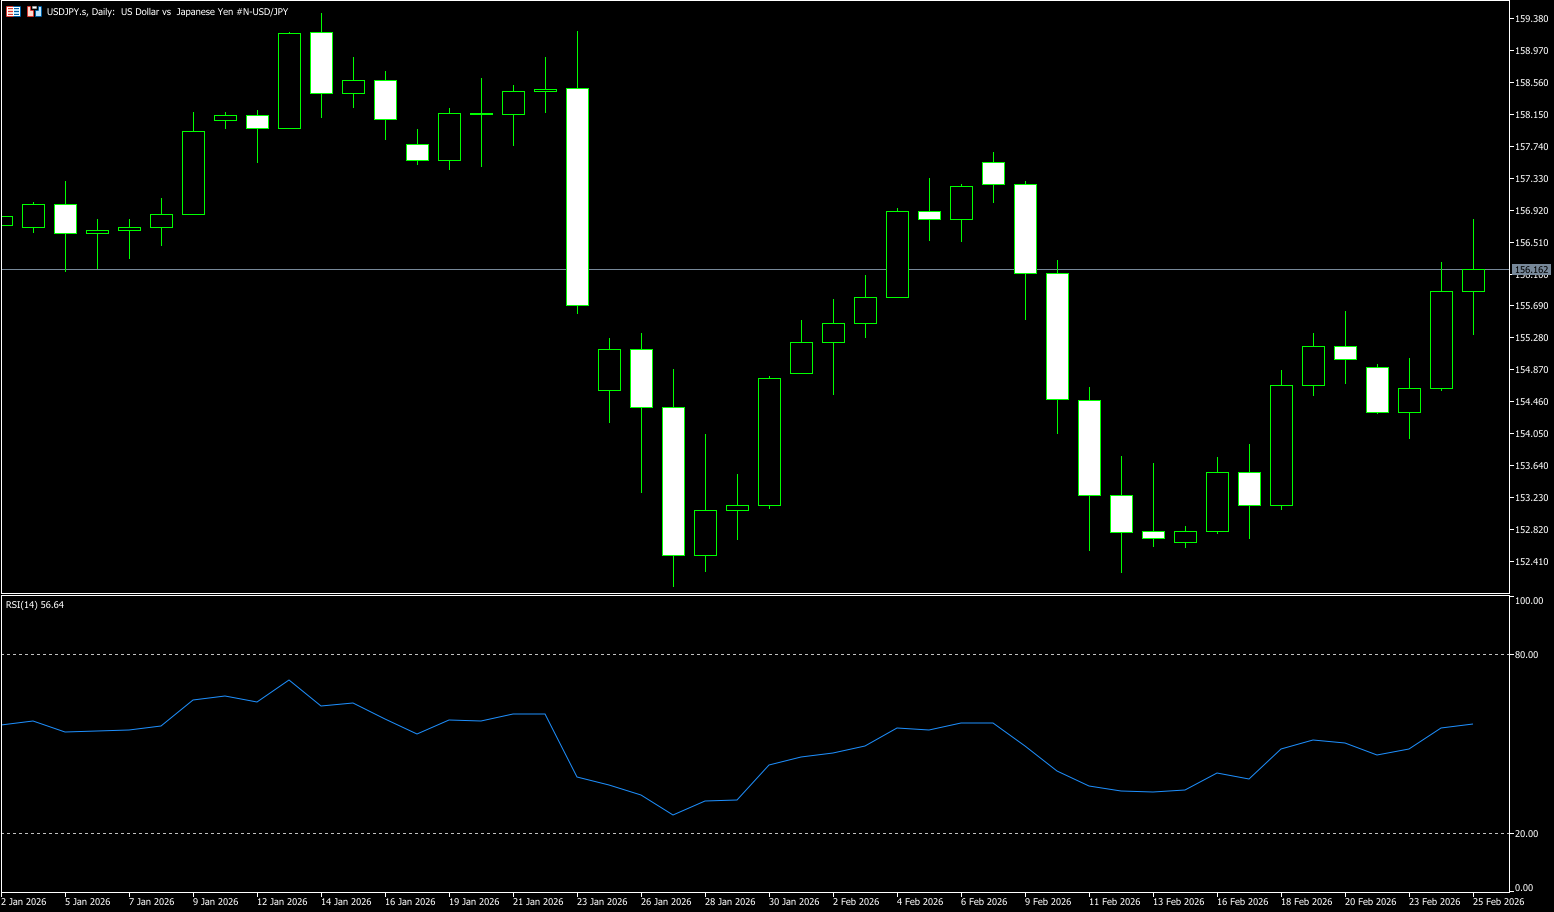
The yen traded near 156.30 per dollar on Wednesday, following a sharp drop in the previous session after reports that Prime Minister Sanae Takaichi expressed concerns about further interest rate hikes during her meeting with Bank of Japan Governor Kazuo Ueda last week. The Bank of Japan governor stated after last week's meeting that Takaichi did not make any specific demands when discussing the economy. Takaichi is known for his support of stimulus policies, including expansionary fiscal policy and loose monetary policy. This has clouded the prospects for a Bank of Japan rate hike, as markets speculate that the central bank may normalize monetary policy later this year. On the other hand, earlier reports indicated that US authorities proactively conducted interest rate checks last month to support the yen and are prepared to coordinate intervention at Japan's request. This effort, led by Scott Bessant, reflects concerns that political uncertainty ahead of Japan's general election could trigger financial market volatility.
From a technical perspective, the recent rebound from the 120-day simple moving average (154.02) is favorable for USD/JPY bulls. Meanwhile, the MACD indicator is nearing the zero line and has entered positive territory. The MACD line is slightly above the signal line, and the histogram is slightly positive, indicating improving momentum. The 14-day Relative Strength Index (RSI) above 50 (neutral) reflects balanced pressure, suggesting that the upside may encounter resistance near this week's high at the 61.8% Fibonacci retracement level of 156.64. If USD/JPY can break above this retracement level, further upward momentum will strengthen, paving the way for the psychological level of 157.00. If buyers fail to overcome resistance, the spot price may fall back to the 154.90-155.00 area, a consolidation zone after the previous decline and a key battleground for bulls and bears. A break below this level would target the 154.32 (115-day simple moving average) level.
Today, consider shorting the US dollar near 156.55; Stop loss: 156.70; Target: 155.50; 155.30
EUR/USD
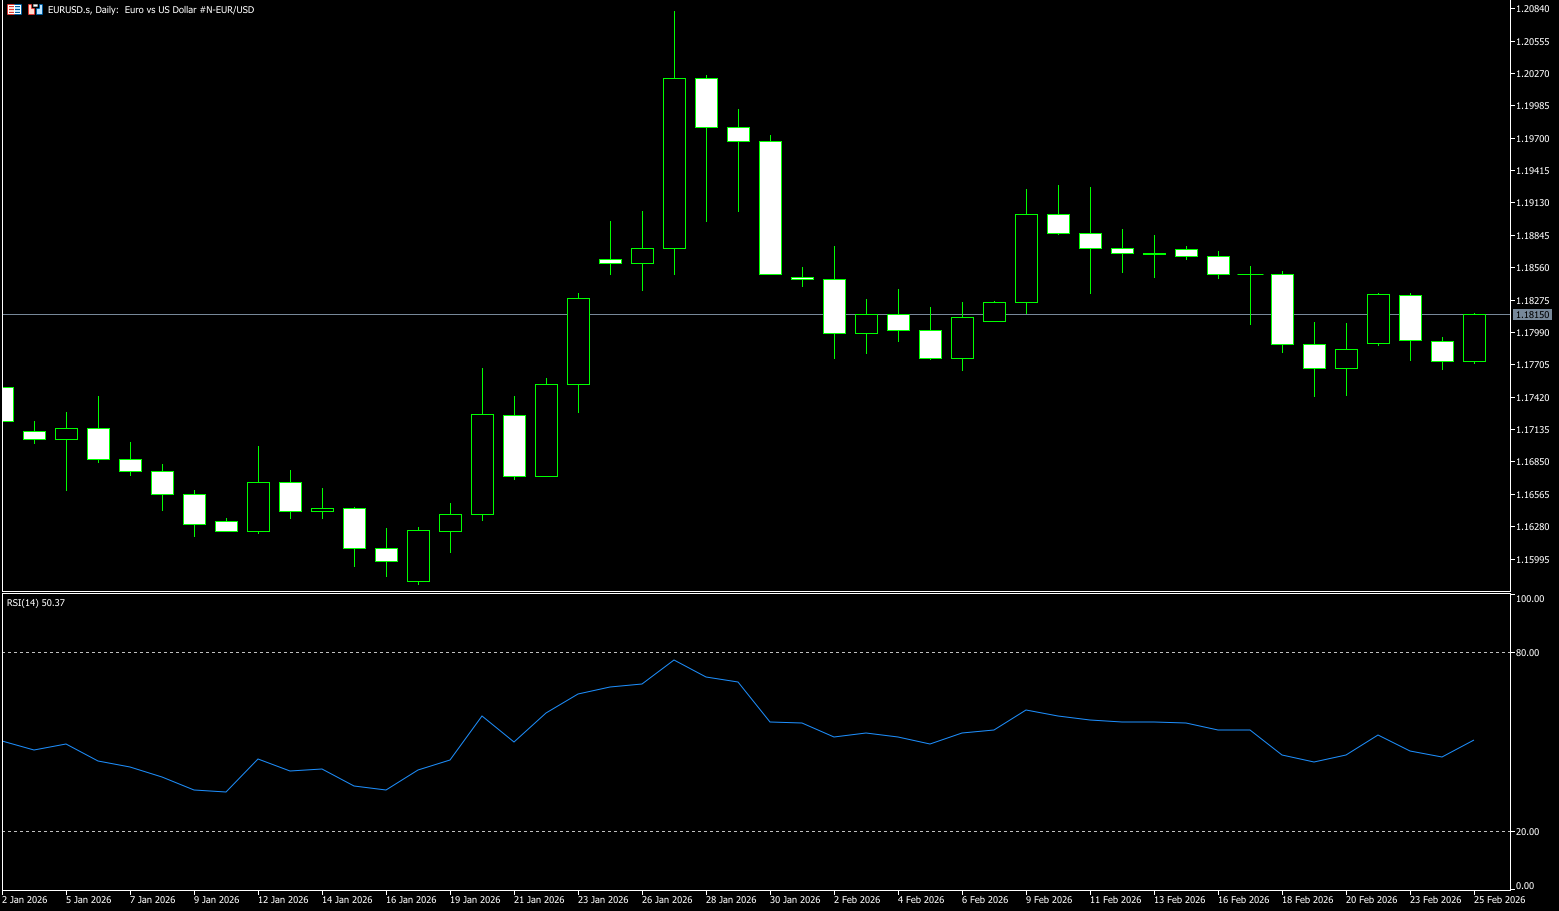
The euro/dollar pair traded near 1.1800 this week, pressured by a rebound in dollar demand. Traders await President Trump's State of the Union address later Wednesday for clear guidance on fiscal policy. Hawkish comments from Federal Reserve officials provided some support for the dollar, with Boston Fed President Susan Collins stating on Tuesday that maintaining the current range for some time was appropriate. This created resistance for the major currency pair. US trade policy remains uncertain after the Supreme Court's ruling to overturn President Trump's "Liberation Day" tariffs. In response, Trump invoked Section 122 of the Trade Act of 1974 to impose a new 10% global tariff and quickly threatened to raise it to 15%. This could put pressure on the dollar relative to the euro. The European Parliament decided on Monday to postpone a vote on the EU-US trade agreement due to the new import tariffs.
On the daily chart, EUR/USD is trading slightly above 1.1800. The short-term bias is slightly bullish, as the spot price is just above the 55-day and 100-day simple moving averages, which are converging around 1.1700 and rising slightly, supporting a broader uptrend. The pair has stabilized after a pullback from its highs earlier in the month, remaining above key medium-term moving averages forming a higher low sequence. The 14-day Relative Strength Index (RSI) is hovering below 50, reflecting balanced momentum but not yet showing downward pressure. Initial resistance is located at 1.1841 (25-day simple moving average) and the 1.1877 area (last week's high). The next resistance level is 1.1900 (psychological level). On the downside, immediate support appears at 1.1750 (65-day simple moving average), protecting the path to the psychological level of 1.1700, as well as the horizontal path of the 200-day simple moving average area (1.1661).
Consider going long on the Euro around 1.1800 today; Stop loss: 1.1790; Target: 1.1850, 1.1840
Disclaimer: The information contained herein (1) is proprietary to BCR and/or its content providers; (2) may not be copied or distributed; (3) is not warranted to be accurate, complete or timely; and, (4) does not constitute advice or a recommendation by BCR or its content providers in respect of the investment in financial instruments. Neither BCR or its content providers are responsible for any damages or losses arising from any use of this information. Past performance is no guarantee of future results.
More Coverage


Risk Disclosure:Derivatives are traded over-the-counter on margin, which means they carry a high level of risk and there is a possibility you could lose all of your investment. These products are not suitable for all investors. Please ensure you fully understand the risks and carefully consider your financial situation and trading experience before trading. Seek independent financial advice if necessary before opening an account with BCR.
BCR Co Pty Ltd (Company No. 1975046) is a company incorporated under the laws of the British Virgin Islands, with its registered office at Trident Chambers, Wickham’s Cay 1, Road Town, Tortola, British Virgin Islands, and is licensed and regulated by the British Virgin Islands Financial Services Commission under License No. SIBA/L/19/1122.
Open Bridge Limited (Company No. 16701394) is a company incorporated under the Companies Act 2006 and registered in England and Wales, with its registered address at Kemp House, 160 City Road, London, City Road, London, England, EC1V 2NX. This entity acts solely as a payment processor and does not provide any trading or investment services.

 English
 简体中文
简体中文
 繁體中文
繁體中文
 Bahasa
Melayu
Bahasa
Melayu
 Tiếng
Việt
Tiếng
Việt
 ไทย
ไทย
 日本語
日本語
 한국어
한국어
 ភាសាខ្មែរ
 español