


0
The US Dollar Index
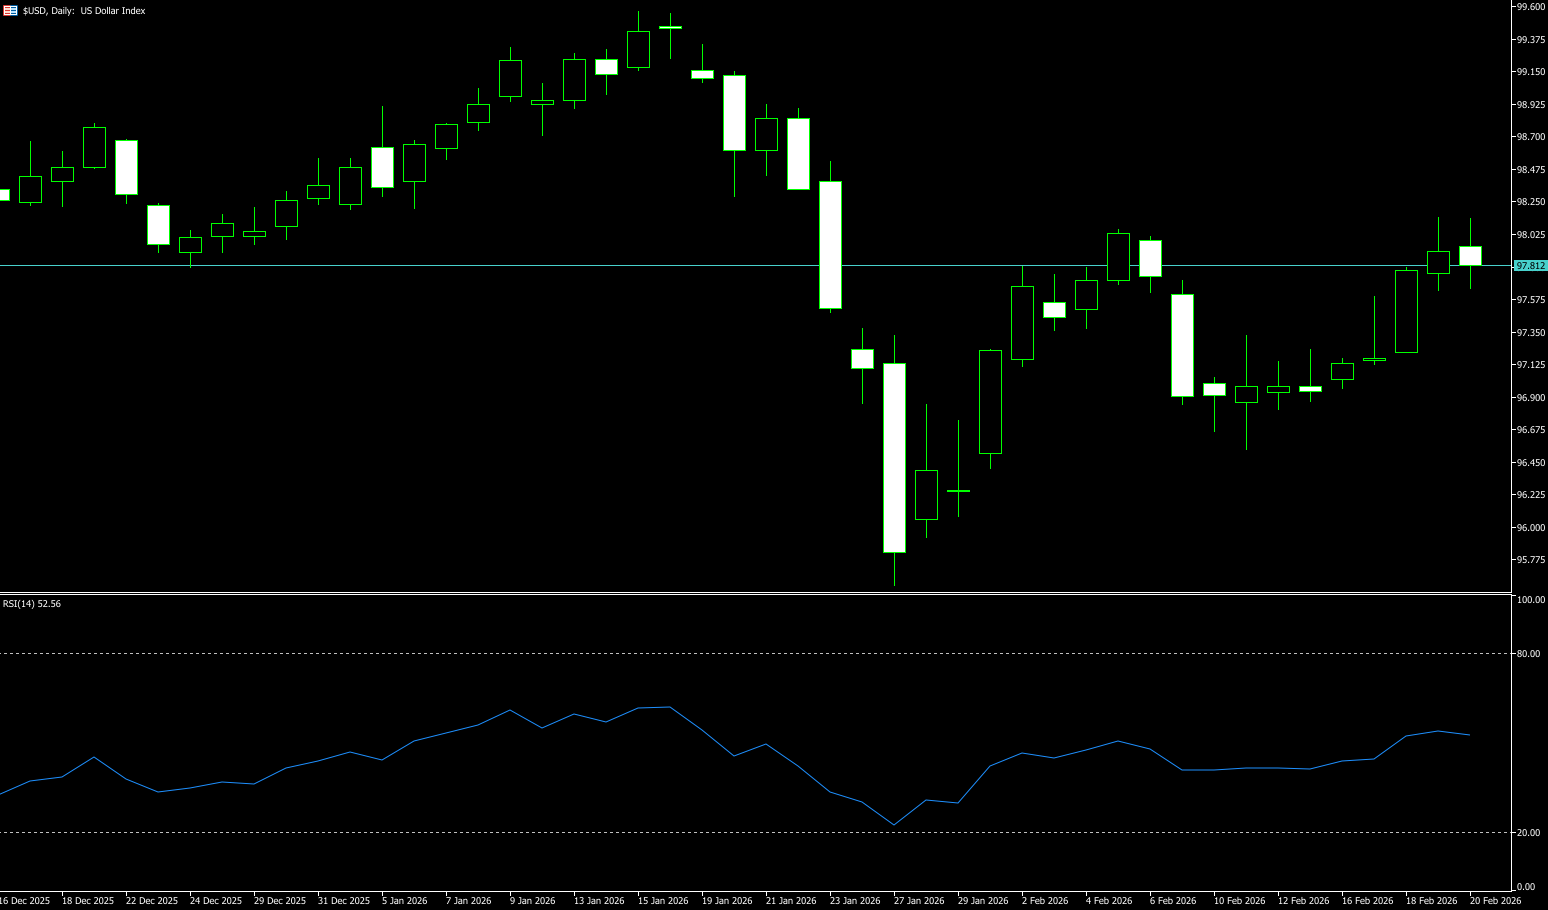
The US dollar index tested the 98 level multiple times before the end of last week, reaching a three-week high near 98.07. It is expected to rise by about 1% this week, supported by strong US economic data and hawkish signals from the Federal Reserve. Midweek, jobless claims fell to a five-week low, while the Philadelphia Fed's business outlook survey unexpectedly jumped to a five-month high. However, the US trade deficit widened in December, and pending home sales declined in January. Better-than-expected US economic data and hawkish Fed minutes may boost the DXY in the short term. According to the minutes of the January Fed meeting released Wednesday, officials were divided on the direction of interest rates. Several policymakers indicated that a rate hike was likely under discussion and hoped the post-meeting statement would more accurately reflect the "two-sided description of the Committee's future interest rate decisions." Fed Governor Stephen Milan noted that he now expects a "less accommodative" interest rate path, citing strong employment and persistent commodity inflation. Meanwhile, one of the core factors contributing to the dollar's weakening over the past year has been the unpredictability of US policy, particularly in the trade arena, where there has been a significant discrepancy between policy announcements and their actual implementation. The prolonged government shutdown has further exacerbated investor concerns about dollar assets. From a macroeconomic perspective, the global trend of "de-dollarization" is intensifying, with investors and central banks continuously reducing their holdings of fiat currencies and shifting towards safe-haven assets such as gold, fueling growing market anxieties about the sustainability of US fiscal policy.
The recent trend of the dollar index has been a decline followed by stabilization at lower levels. Looking back at the daily chart, the dollar index reached a high of 99.49 this year before encountering resistance and falling back to around 95.56, where it formed a bottom and began to rebound. In late last week, the index briefly rose to around 98, becoming a new battleground between bulls and bears. Technical indicators are also silently reflecting market hesitation. The MACD histogram has clearly converged and turned upwards, indicating that the downward momentum is weakening. Meanwhile, the RSI indicator is hovering around 50-55, suggesting that market sentiment is in a delicate neutral state. There is neither strong bullish enthusiasm nor panic selling pressure. This means that a one-sided trend is becoming more difficult, and buying low and selling high between support and resistance levels may be the main strategy at present. Looking at key levels, the 96.80 area (the low of the past two weeks) and the 97.00 area (a psychological level) form a short-term watershed. As long as this level can be held, the current rebound structure is expected to continue to the 98.07 area (last week's high) and the 98.15 area (the 120-day simple moving average); a break below this level would target the 200-day simple moving average at 98.61. Conversely, a decisive break below this level could open up new downside potential to the 97.20 area (the 20-day simple moving average) and the 97.00 area (a psychological level). The index will further test the 96.80 level. If it repeatedly finds support here and fails to break down, the market will likely revert to a range-bound pattern between 96.80 and 98.61.
Today, consider shorting the US dollar index near 97.87; stop loss: 97.98; target: 97.40; 97.35
WTI Crude Oil
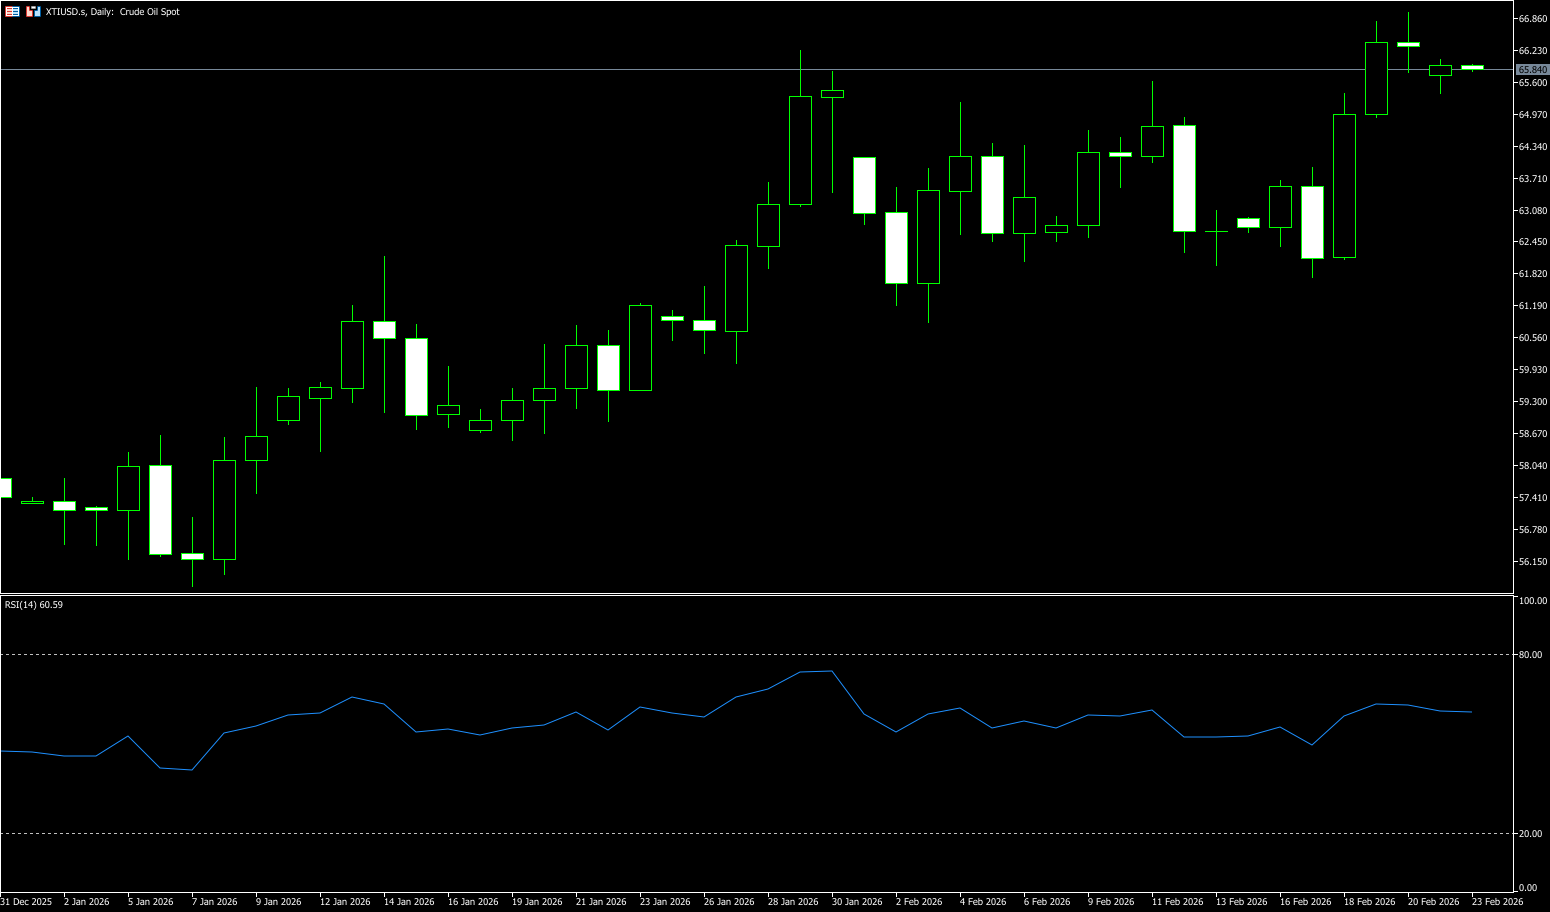
Last week, international oil prices continued to rise due to escalating tensions between the US and Iran, with both Brent and WTI crude oil hitting six-month highs. WTI approached $67.00, reaching its highest level since late July to early August last year. The cumulative weekly gain was nearly 6%. Meanwhile, two days of peace talks between Ukraine and Russia in Geneva ended on Wednesday without any breakthrough. Ukrainian President Zelensky accused Moscow of obstructing US mediation efforts, bringing the four-year war to a standstill. This geopolitical event also indirectly supported risk aversion in the energy market. Additionally, Cushing crude oil inventories decreased by 1.095 million barrels, gasoline inventories decreased by 3.213 million barrels, and distillate fuel inventories decreased by 4.566 million barrels during the week, with all refined product inventories declining. Despite warnings from the International Energy Agency about slow demand growth and potential oversupply, this unexpected inventory reduction, coupled with escalating geopolitical risks, significantly strengthened the upward momentum of oil prices. The high-level fluctuations in oil prices are mainly driven by geopolitical risks, and the EIA inventory decline provided unexpected fundamental support. If the US-Iran conflict does not lead to actual supply disruptions, the current gains include a significant risk premium; however, if the Strait of Hormuz is blocked, the conflict escalates, or inventories continue to decline, oil prices may test higher levels further. Market participants warn that the market is in a highly sensitive period, and any new developments will trigger sharp fluctuations.
In the short term, oil prices remain bullish, but if there is a breakthrough in negotiations or military action fails to materialize, prices may quickly give back some of the gains. Close attention should be paid to US-Iran developments and inventory data changes, and a flexible approach should be taken in response to both trends and unexpected news. From the WTI daily chart, oil prices have broken through the early-year high of $65.24 (January 29th high) and the psychological level of $65.00, indicating a strengthening structure. Currently, crude oil prices are trending upwards along the 10-day ($64.25) and 20-day ($63.80) moving averages, with short-term moving averages in a bullish alignment. The MACD indicator on the daily chart has formed a golden cross above the zero line, with the momentum bars continuing to expand, indicating strengthening upward momentum; the RSI has risen above 60 but has not yet entered overbought territory, suggesting further upside potential. The overall structure shows clear signs of a trend breakout, and short-term pullbacks may present opportunities for long positions, but the risk of a rapid decline due to sudden diplomatic easing should be noted. Key resistance levels to watch are $68.37 (July 14th high of last year) and $70.00 (a psychological level); if geopolitical risks escalate further, a test of the $71.56 area (March high of last year) cannot be ruled out. Support lies at $64.26 (9-day simple moving average). A break below this level would challenge $61.76 (last week's low), followed by the psychological level of $60.00.
Consider going long on crude oil around $66.20 today; stop loss: $66.00, target: $67.50; $67.80
Spot Gold
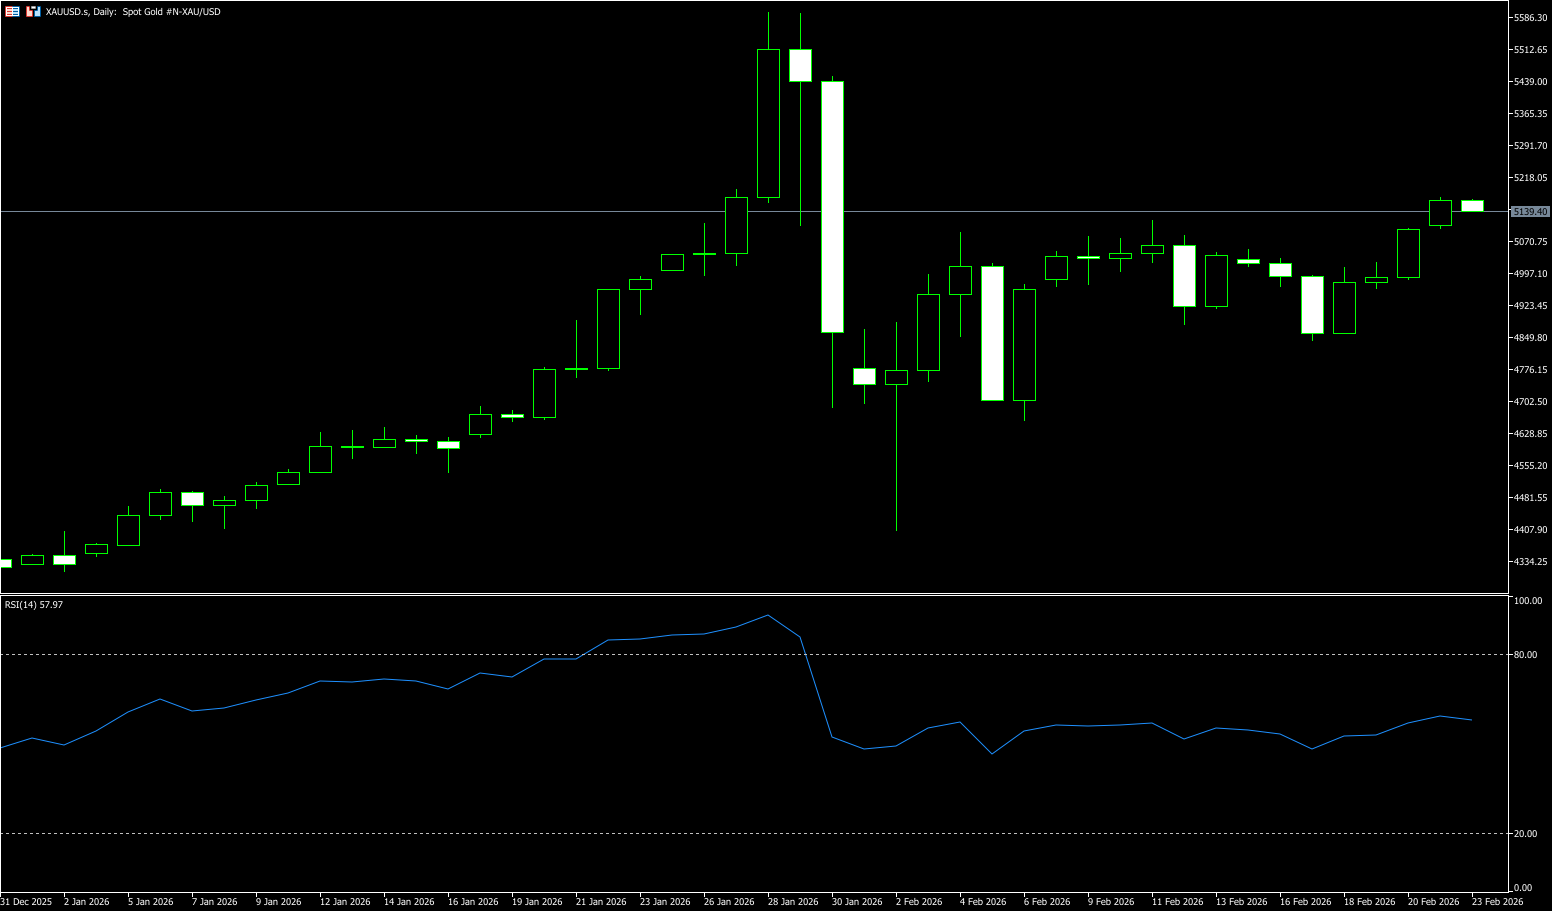
Gold prices rose more than 1% over the weekend as US economic growth slowed and inflation broke through the 3% threshold—the Fed's preferred inflation gauge—through the core personal consumption expenditures price index. Meanwhile, the US Supreme Court ruled against tariffs imposed by Trump, which were based on laws designed to address national emergencies. This decision improved risk appetite. The dollar weakened, and gold rebounded from a daily low of $4,981 to just below $5,100. Currently, gold prices are in a classic battle between bulls and bears: on one side are traditional traders focusing on gold's fundamentals, based on US Treasury yields and the dollar's performance, whose core trading logic revolves around the impact of interest rate changes on gold valuations; on the other side are speculative funds betting on gold's safe-haven appeal, attempting to leverage geopolitical tensions to push prices out of their trading range. Simultaneously, traders are weighing geopolitical risks against the Federal Reserve's policy outlook. Tensions between the US and Iran have escalated, with President Trump setting a 10-15 day deadline for nuclear agreement negotiations, and the US deploying its largest military force in the Middle East since the 2003 invasion of Iraq. Furthermore, with the Federal Reserve's policy stance gradually shifting towards a hawkish stance, coupled with the escalating US-Iran geopolitical tensions, market trading logic has fundamentally changed: the previous expectation of easing that dominated gold prices has been replaced by the reality of unchanged interest rates. Speculative funds have become cautious due to recent losses from the sharp drop in gold prices, and while safe-haven funds have entered the market, their strength is insufficient to push gold prices above key resistance levels.
Last week, spot gold experienced a volatile rebound with intensified divergence between bulls and bears, fiercely contesting the $5000-$5100 level. While the medium-term bullish foundation remains intact, the market has entered a short-term consolidation phase. The key levels to watch are whether the $5100-$5120 resistance zone can be effectively broken and whether the $4950-$4970 support zone can hold. On the other hand, while gold prices rebounded throughout the week, market volatility showed a clear downward trend. This divergence indicates that the bullish momentum driving gold prices is gradually waning, and market participation has cooled. The daily chart shows that gold prices oscillated within the $4840-$5055 range (last week's low/high) last week. Nevertheless, the lack of follow-through buying and range-bound trading over the past two days warrants caution from bullish traders. Meanwhile, the MACD indicator remains below the signal and zero lines, while the negative histogram is contracting, suggesting weakening bearish pressure. The 14-day Relative Strength Index (RSI) is 57 (neutral), consistent with the temporary recovery trend. If gold prices can continue to hold above the 4,840 (last week's low) and 4,848 (35-day simple moving average) area, the intraday risk will be skewed to the upside, further challenging last week's high of $5.098. A break above $5.098 would target $5,119 (February 11 high) and further to $5,182.30 (January 27 high).
Consider going long on gold today around 5,090; Stop loss: 5.085; Target: 5,150; 5,160
AUD/USD
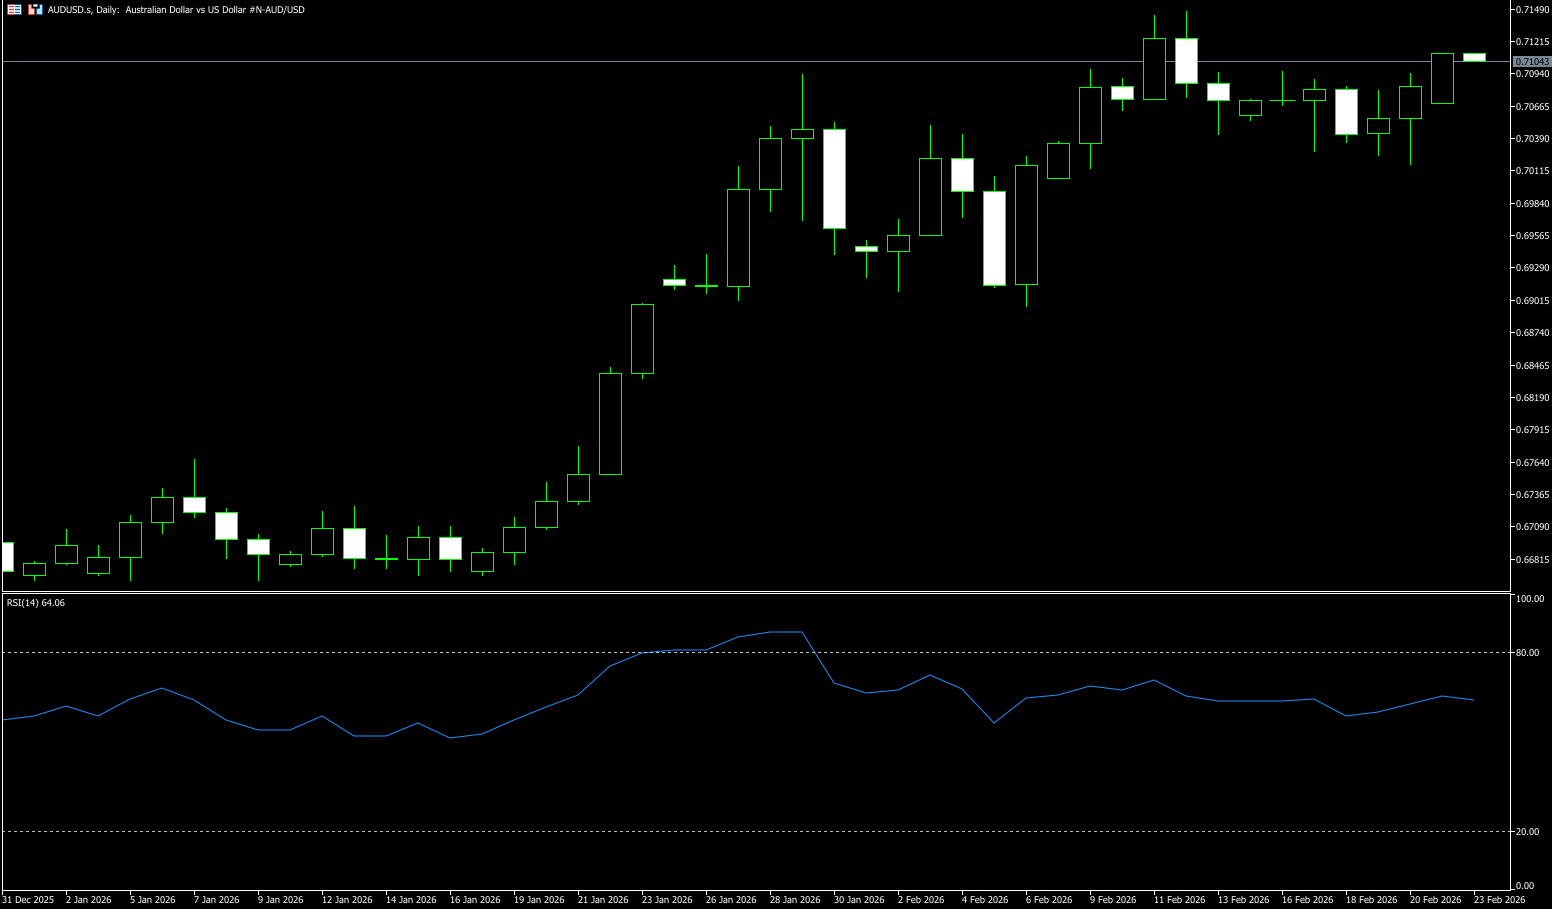
The Australian dollar remained in a narrow range slightly below $0.7100 before the end of last week, facing pressure from a stronger US dollar and weak domestic PMI data, potentially closing higher for the eighth consecutive week. Data shows that rapid PMI readings generally cooled in February, indicating slower growth but persistent inflationary pressures. Composite, services, and manufacturing readings all declined from January, although each remained above 50, suggesting continued expansion. Meanwhile, the US dollar strengthened on strong US economic data and hawkish signals from the Federal Reserve. At the same time, with improving domestic data and more hawkish signals from policymakers, the probability of an Australian rate hike in March is rising. The market currently expects a 76% probability of the Reserve Bank of Australia raising the cash rate in May, while the probability of a March rate hike has risen to about 28%. Year-to-date, the Australian dollar has been the best performing major currency, appreciating 6.2% against the US dollar. Stronger prices in industrial and precious metals have provided strong support for this commodity currency. Domestic inflation in Australia is rising again: the RBA's core monitoring indicator—the cut-off average CPI—has been consistently above 3% since July 2025. The RBA is expected to be the first major central bank to raise interest rates in 2026 and has stated that it will continue to tighten policy if inflation remains high and the labor market remains tight. Bond futures implied interest rates suggest that year-end rates may reach 4.2%, corresponding to 1-2 rate hikes of 25 basis points each.
Australia's macroeconomic backdrop is resilient. The Reserve Bank of Australia remains tight. Market positioning is improving. China's stability is sufficient. Last week saw overall high-level consolidation; the bullish pattern remains intact, but momentum has weakened. The key level is in the 0.7000-0.7020 area, with resistance concentrated in the 0.7090-0.7157 range. On the daily chart, the AUD/USD pair traded in a narrow range around 0.7080 before the end of last week. The pair remains above the rising 30-day simple moving average of 0.6936 and well above the 50-day simple moving average of 0.6833, confirming that the upward trend since the low near 0.6664 in January continues. Since hitting a yearly high of 0.7147 in early February, the AUD/USD exchange rate has been consolidating in a range of approximately 0.7000 to 0.7100, with the psychological level of 0.7000 acting as a key support. The RSI (14-day) is in the 60-65 range, having moved out of overbought territory, indicating weakening bullish momentum but not yet turning bearish; the MACD fast and slow lines have formed a death cross above the zero line, turning negative (-0.0019), with the histogram shortening, increasing short-term downward pressure. Immediate resistance is located at 0.7100-0.7090 (the area of concentrated highs from last week), followed by strong resistance at 0.7141-0.7157 (the February 2023 high + technical resistance). A close above the former could pave the way for a future rise to the 0.7200 level. The first support level is at 0.7000-0.7020 (a key level tested multiple times last week). A break below this level would test the 0.6936 level (30-day simple moving average).
Consider going long on the Australian dollar near 0.7070 today; stop loss: 0.7060; target: 0.7130; 0.7140
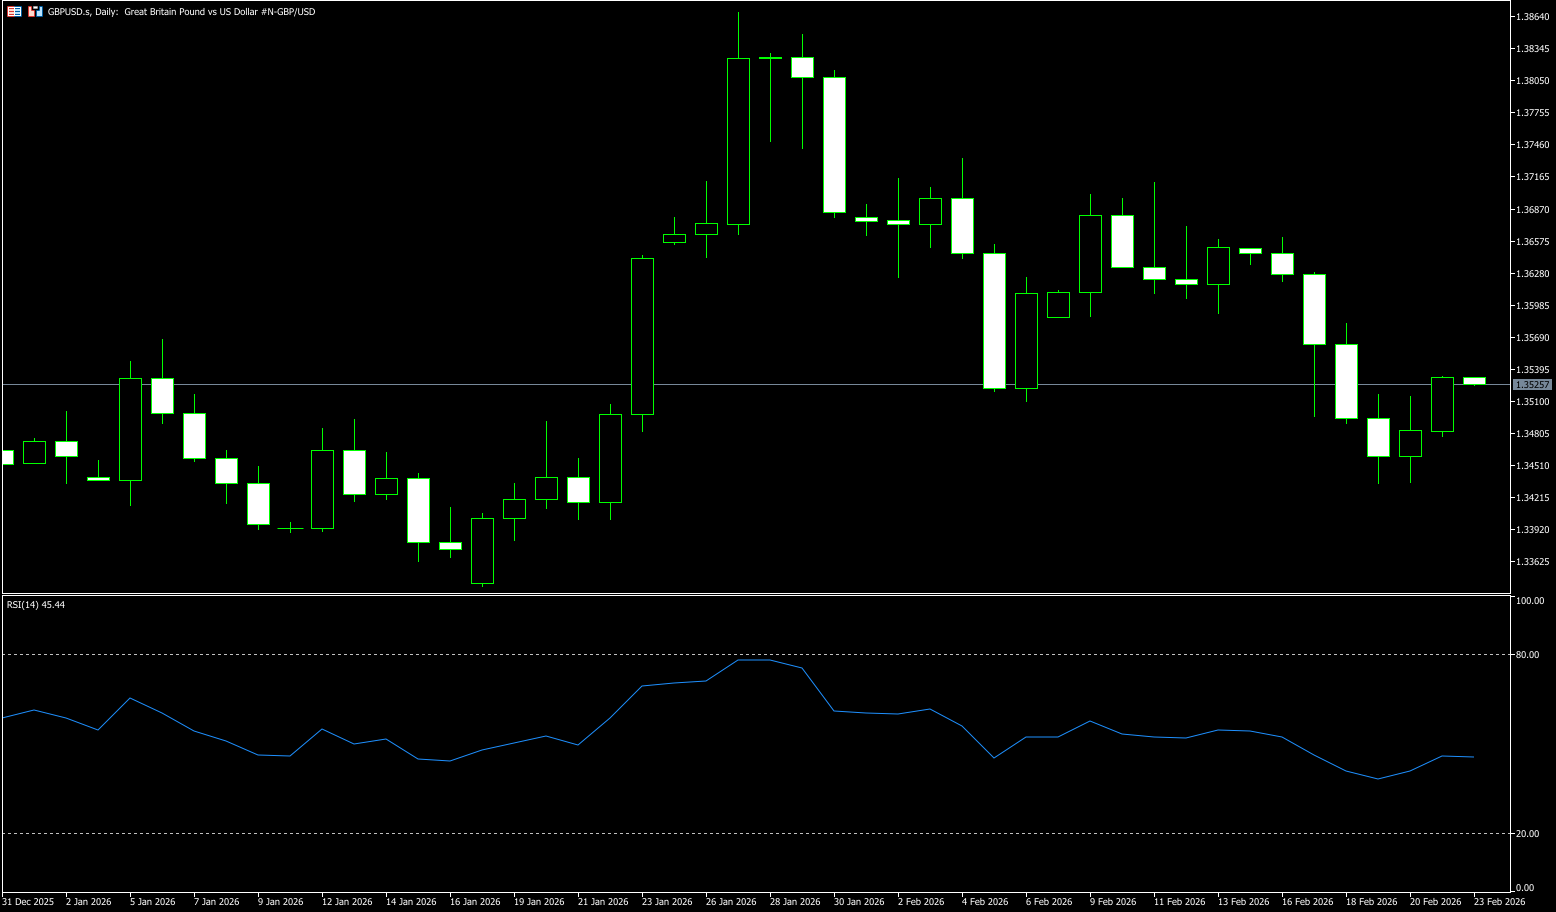
GBP/USD
The pound hovered around $1.35 last week, hitting a one-month low of 1.3434, as the dollar weakened after the US Supreme Court overturned President Donald Trump's broad emergency tariffs, and the pound attempted to rebound from its one-month low. Meanwhile, investors also digested strong UK economic data. The latest S&P Global UK Purchasing Managers' Index showed that private sector activity expanded at its fastest pace since April 2024 in February, with both manufacturing and services showing strong growth. Retail sales unexpectedly rose in January, increasing by 1.8% month-on-month (including fuel) and 2% (excluding fuel). Despite the strong UK economic data, the dollar continued to strengthen after the Federal Reserve released hawkish signals. The latest S&P Global UK Purchasing Managers' Index showed that private sector activity expanded at its fastest pace since April 2024 in February, with strong growth in manufacturing and services exceeding expectations. Retail sales also unexpectedly rose in January, increasing by 1.8% month-on-month (including fuel) and 2% (excluding fuel). Furthermore, public sector net borrowing recorded a surplus of £30.4 billion in January, far exceeding expectations and marking the highest monthly surplus since records began in 1993, surpassing the Office for Budget Responsibility's forecast. Additionally, the minutes of the latest Federal Reserve meeting revealed continued disagreement among policymakers regarding the interest rate outlook, suggesting the next Fed chair may face challenges in implementing rate cuts.
The daily chart shows that GBP/USD's rebound was limited after breaking below the 34-day simple moving average at 1.3563 last week, maintaining a short-term negative bias. Consecutive closes below this indicator suggest a weakening recovery attempt. Currently, the pair is again finding a key pivot point for short-term traders near the 200-day simple moving average at 1.3445. The 14-day Relative Strength Index (RSI) is at 43.25 (bearish), remaining below the midline but not oversold, confirming weak momentum. The MACD histogram remains negative, showing the MACD line below the signal line and near zero. This setup favors sellers, while the exchange rate remains below the declining moving average, and any rebound faces the risk of dynamic resistance. A daily close above 1.3530 (the 50-day simple moving average) would alleviate downward pressure and signal stabilization; otherwise, the path of least resistance remains downward, and the trend signals remain downward. The first downside target is at the 200-day simple moving average of 1.3445, followed by 1.3400 (the psychological level). A break below 1.34 would target 1.3344 (the low of January 19). On the upside, watch for 1.3530 (the 50-day simple moving average), followed by 1.3600 (the psychological level), and then the 1.3642 (the 20-day simple moving average) area.
Consider going long on GBP/USD around 1.3478 today; Stop loss: 1.3466; Target: 1.3540; 1.3530
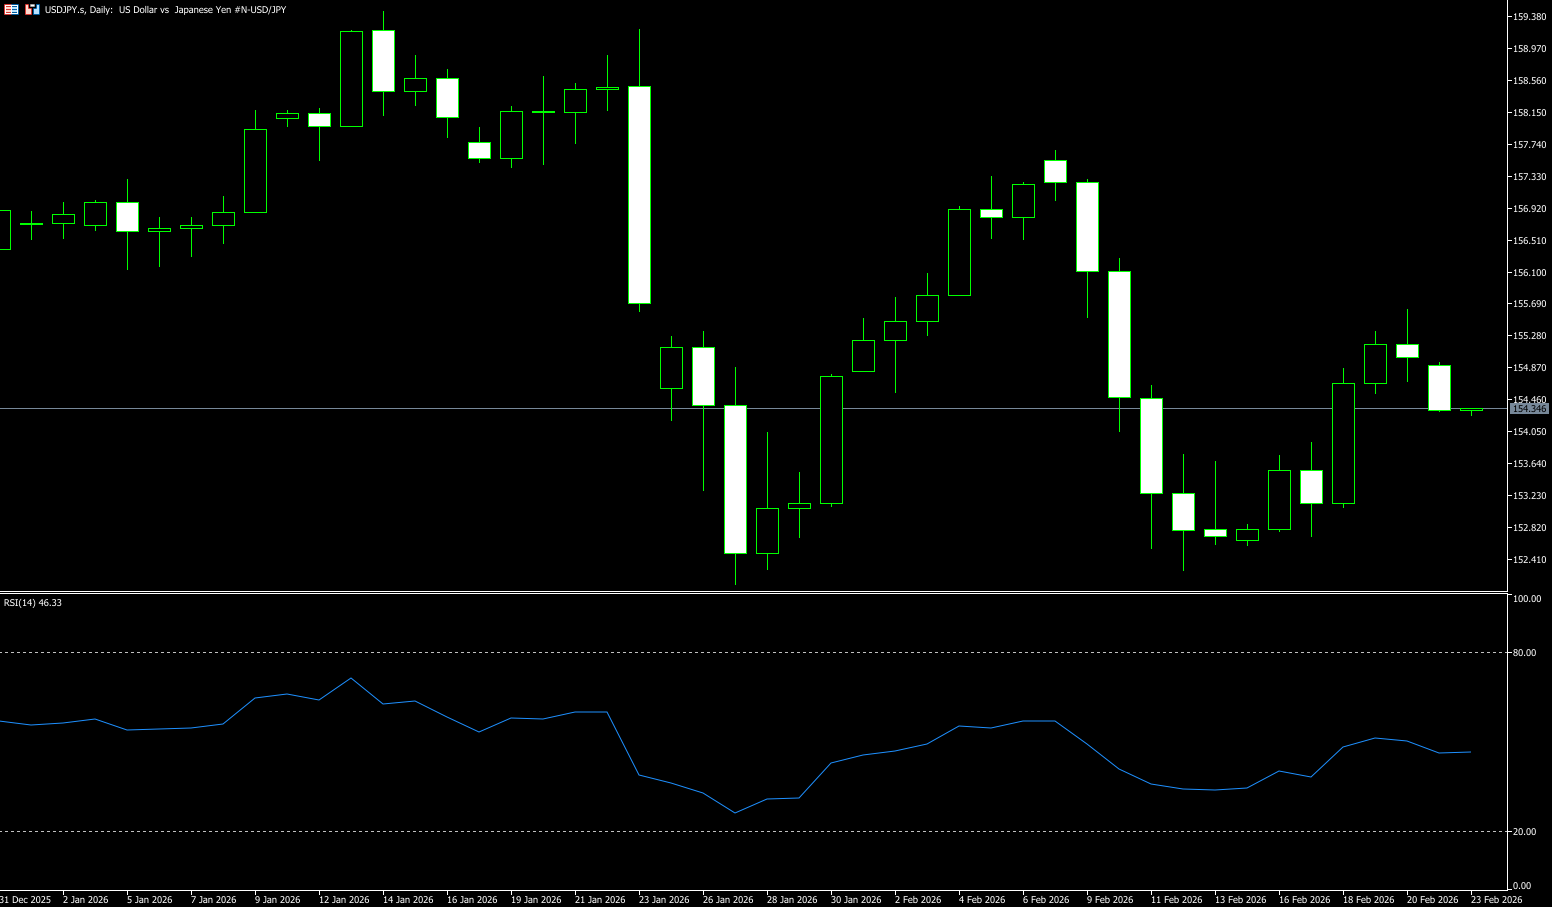
USD/JPY
The yen repeatedly weakened last week as overall and core inflation slowed in January amid government measures to ease cost of living pressures. The yen is expected to fall more than 1.5% this week, erasing about half of last week's gains following the overwhelming election victory of Sanae. Furthermore, the Bank of Japan is another major central bank entering a tightening cycle. Japanese inflation has been above the 2% target for 44 consecutive months, but the central bank remains extremely cautious about policy normalization, requiring clear evidence of a sustained domestic economic recovery before taking action. The core logic driving the exchange rate remains the USD/JPY interest rate differential and risk appetite, and the most worrying variable recently is the chain reaction triggered by rising Japanese government bond yields. Falling bond prices will rapidly accumulate duration losses on held assets, and unrealized losses reaching trillions of yen are not an exaggeration. Even more devastating is the highly sensitive "death line" in Japanese accounting rules: when the market value of bonds falls below 50% of the purchase cost and there is no clear path to recovery, institutions must make impairment provisions. This, coupled with widening interest rate differentials and heightened risk aversion, has had a significant impact on the USD/JPY exchange rate. Meanwhile, since Sanae Takashi took office as president of the Liberal Democratic Party, USD/JPY has risen from a high of 147.5 to 159.4, and although it retreated after suspected government intervention, it still accumulated a 4.1% increase during that period. Based on fundamental calculations of the US Treasury yield spread and purchasing power parity, the fair value of the yen is far below the 125 level. However, constrained by the aforementioned structural contradictions, the yen's return to a fair level may be a gradual process spanning multiple years.
From a technical perspective on the daily chart, the MACD is still hovering near the zero line. Although the narrowing momentum bars suggest a weakening of the downward momentum, the signal for a trend reversal is not yet sufficient. The RSI reading is in the neutral zone around 49.85, neither overheated nor oversold, more like accumulating energy for the next breakout. This stalemate is not accidental; it hides a deeper macroeconomic logic, particularly the structural changes in Japanese interest rates, which are quietly reshaping the market's pricing foundation. From a technical perspective, the USD/JPY pair entered a consolidation phase after reaching an 18-month high of 159.45 in January. The 20-day moving average at 154.54 and the 50-day moving average at 156.01 have formed a "death cross," indicating a bearish short-term signal. The currency pair is testing the key support zone of 154.54 (20-day moving average) – 154.50 (February 19th low). A break below this level could lead to a test of the 130-day moving average at 153.35 and the psychological level of 153.00. Conversely, a strong hold above the psychological level of 155.00 and the 14-day moving average area would indicate renewed weakness in the yen. For USD/JPY, the current level of 154.80 is not the end of the trend, but rather a transition point where interest rate policy and market narratives intersect. Therefore, the initial upside target is the psychological level of 156.00. And 156.02 {50-day moving average}. Next is the 157.66 {February high} level.
Today, consider shorting the US dollar near 155.25; Stop loss: 155.45; Target: 154.30; 154.20
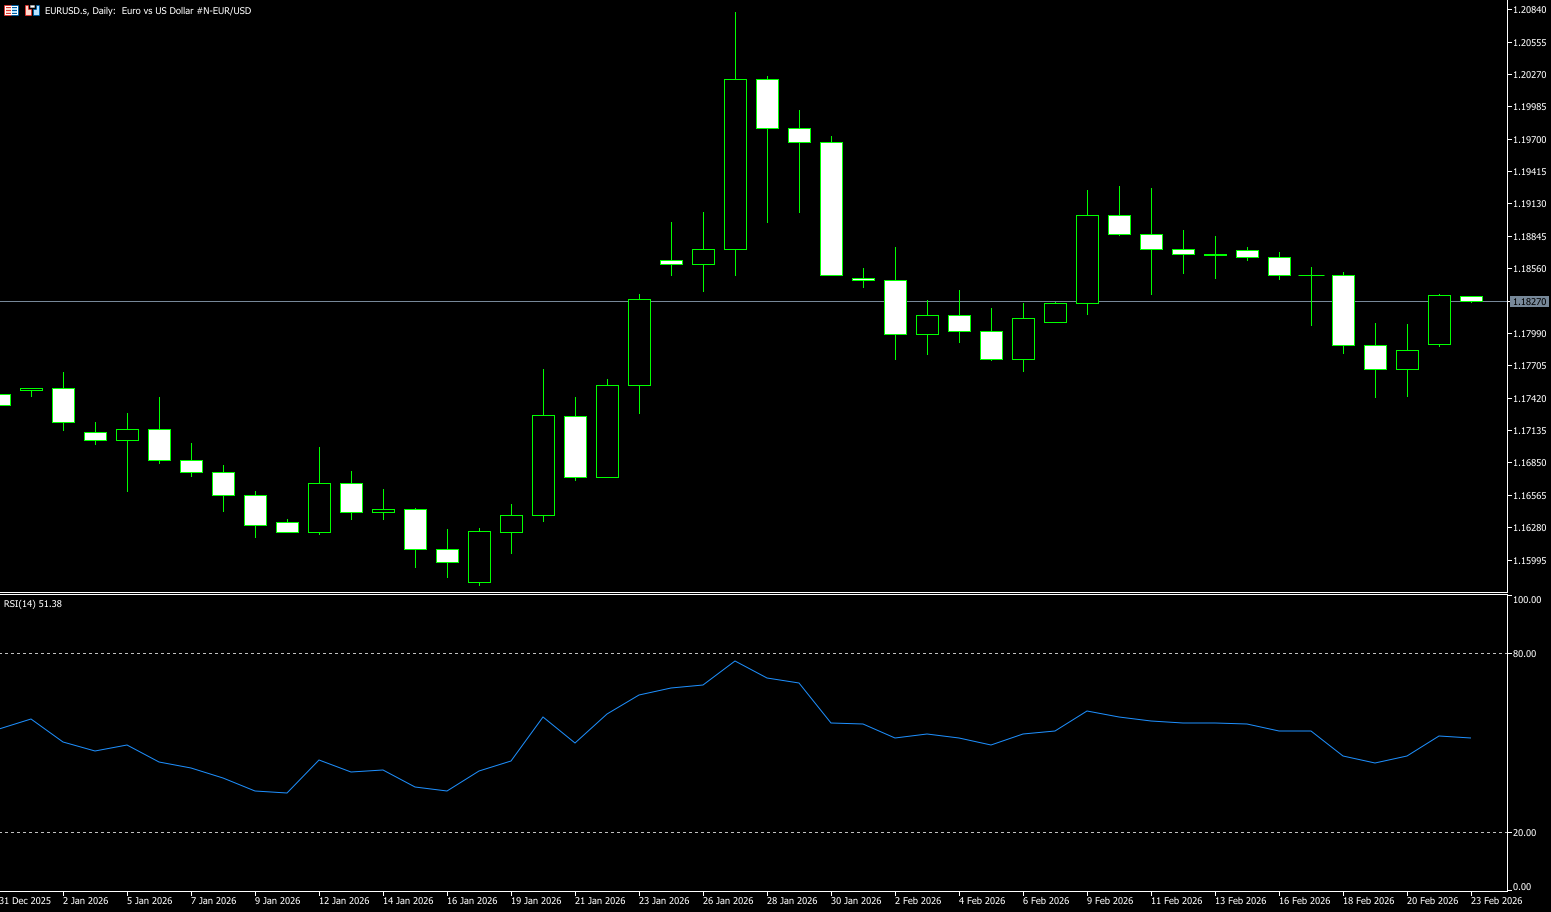
EUR/USD
Last week, the euro traded around $1.1770-$1.1780 before the weekend, hovering near its lowest level in a month, as stronger-than-expected Eurozone PMI data failed to offset hawkish signals from the Federal Reserve and continued support from US economic data. Recent survey data showed that Eurozone private sector activity expanded at its fastest pace since November 2022, primarily driven by the strongest growth in manufacturing activity since August 2025, as well as robust growth in the services sector. In Germany, manufacturing expanded for the first time since June 2022. The market also noted that European Central Bank President Christine Lagarde stated in an interview with the Wall Street Journal that she plans to complete her full term, refuting earlier speculation about an early departure. In the US, the minutes of the latest Federal Reserve meeting showed that policymakers remain divided on the interest rate outlook, suggesting that the next Fed chair may face challenges in pushing for rate cuts. On the other hand, Despite the euro/dollar exchange rate falling below 1.18 and the euro's spot yield against the dollar being lackluster year-to-date, the options market still reflects structural changes since "Liberation Day." Investors are increasingly using euro options to hedge dollar risk, further solidifying the euro's position as a major alternative reserve currency.
Last week, the euro traded in a downward trend against the dollar, gradually declining from a high of 1.1877 at the beginning of the week, reaching a low of [missing information] before the weekend. The pair closed at 1.1742, down approximately 0.90% for the week. Currently, the EUR/USD pair is driven more by the US narrative than by developments in the Eurozone. With the Fed's interest rate path in 2026 still unclear and the Eurozone yet to offer a convincing cyclical rebound, upward progress is likely to be slow rather than turning into a clean, sustained breakout. On the daily chart, EUR/USD is currently trading slightly below 1.1800. The 55-day moving average (1.1764) has risen above the 100-day (1.1688) and 200-day (1.1652) simple moving averages, reinforcing the bullish alignment. All three moving averages are rising, and the pair is holding above them to maintain its upward momentum. Bias. The 14-day Relative Strength Index (RSI) has slipped below 48, maintaining momentum below the midline. Trend strength is weakening, with the average direction index (14) falling back towards 25, suggesting a risk of consolidation unless buyers continue the trend. Initial resistance appears in the 1.1800 (psychological level) - 1.1835 (14-day simple moving average) area, followed by 1.1900 (round number level). A pullback to below 1.1700 (round number level) - 1.1695 (89-day simple moving average) could expose the 200-day simple moving average level at 1.1652.
Consider going long on the Euro today around 1.1775; Stop loss: 1.1760; Target: 1.1830, 1.1835
Disclaimer: The information contained herein (1) is proprietary to BCR and/or its content providers; (2) may not be copied or distributed; (3) is not warranted to be accurate, complete or timely; and, (4) does not constitute advice or a recommendation by BCR or its content providers in respect of the investment in financial instruments. Neither BCR or its content providers are responsible for any damages or losses arising from any use of this information. Past performance is no guarantee of future results.
More Coverage


Risk Disclosure:Derivatives are traded over-the-counter on margin, which means they carry a high level of risk and there is a possibility you could lose all of your investment. These products are not suitable for all investors. Please ensure you fully understand the risks and carefully consider your financial situation and trading experience before trading. Seek independent financial advice if necessary before opening an account with BCR.
BCR Co Pty Ltd (Company No. 1975046) is a company incorporated under the laws of the British Virgin Islands, with its registered office at Trident Chambers, Wickham’s Cay 1, Road Town, Tortola, British Virgin Islands, and is licensed and regulated by the British Virgin Islands Financial Services Commission under License No. SIBA/L/19/1122.
Open Bridge Limited (Company No. 16701394) is a company incorporated under the Companies Act 2006 and registered in England and Wales, with its registered address at Kemp House, 160 City Road, London, City Road, London, England, EC1V 2NX. This entity acts solely as a payment processor and does not provide any trading or investment services.

 English
 简体中文
简体中文
 繁體中文
繁體中文
 Bahasa
Melayu
Bahasa
Melayu
 Tiếng
Việt
Tiếng
Việt
 ไทย
ไทย
 日本語
日本語
 한국어
한국어
 ភាសាខ្មែរ
 español