


0
The US Dollar Index
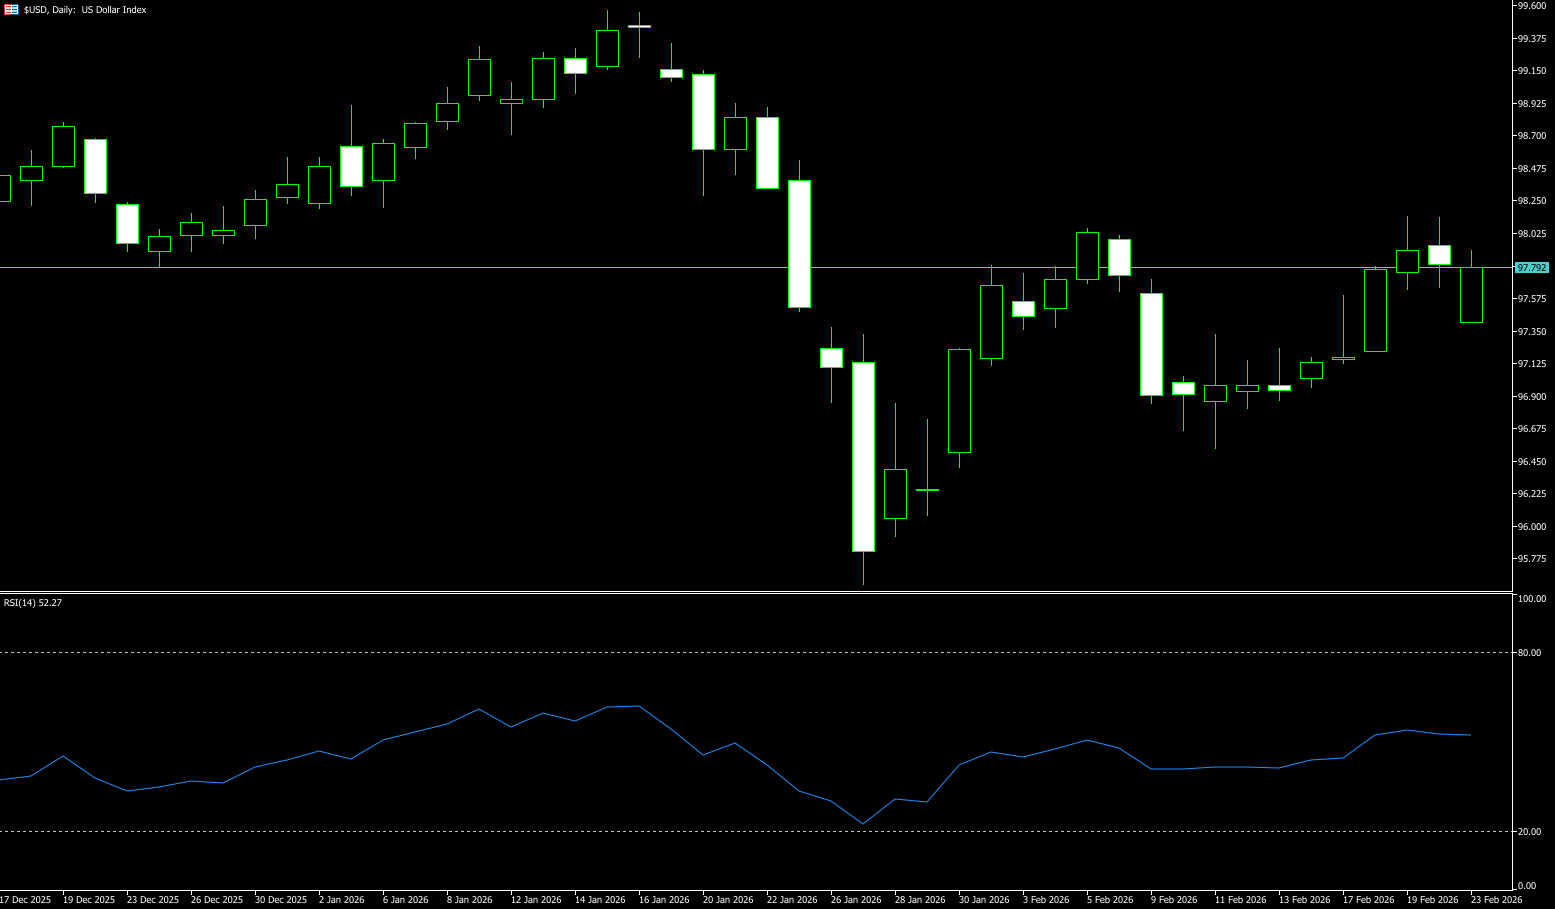
The US dollar index fell in volatile trading last week, ending a four-day winning streak. This followed the US Supreme Court's overturning of President Trump's massive tariff measures imposed under the National Emergency Act. In a 6-3 ruling authored by conservative Chief Justice Roberts, the Supreme Court upheld the lower court's decision, finding that Trump's use of the 1977 law exceeded his authority. The dollar had previously strengthened due to mixed US economic data—inflation readings were higher than expected while economic growth was far lower than expected. The dollar had been strong for most of last week, making this particular instance an exception, thus making the sell-off of US assets somewhat hasty. It remains to be seen how Trump, Treasury Secretary Bessant, and the government will respond. The ruling has a "slightly negative impact on the dollar, but not enough to change the current fundamental environment that favors a tactical long position in the dollar."
From a technical perspective, the current trend of the US dollar index is chaotic. The breakout and stabilization at key levels will determine the strength and potential of the short-term rebound. The daily chart shows that the US dollar index is currently consolidating in the range of 97.95 (50-day moving average) to 97.15 (20-day moving average), and is generally within a rebound channel. Since the rebound from the low of 95.54, upward momentum has gradually accumulated, market bullish sentiment has slowly warmed up, and the technical picture shows a healthy rebound trend. From a key level perspective, the US dollar index has successfully recovered the key psychological support level of 97.00. Stabilizing at this level lays the foundation for a subsequent rebound and validates the effectiveness of the current upward momentum up to 97.75 (Monday's high). The core resistance levels are 98.00 (a psychological level) and the 98.07 area (last Friday's high). These levels are crucial for the recent rebound; a successful break and hold above them would open up further upside potential, potentially leading to higher levels. On the downside, key support levels to watch are 97.15 (the 20-day moving average) and 97.00 (the psychological level). A break below these levels could trigger further short-term corrections, but considering fundamental support, the pullback is expected to be limited.
Today, consider shorting the US dollar index near 97.85; Stop loss: 97.96; Target: 97.30; 97.35
WTI Crude Oil
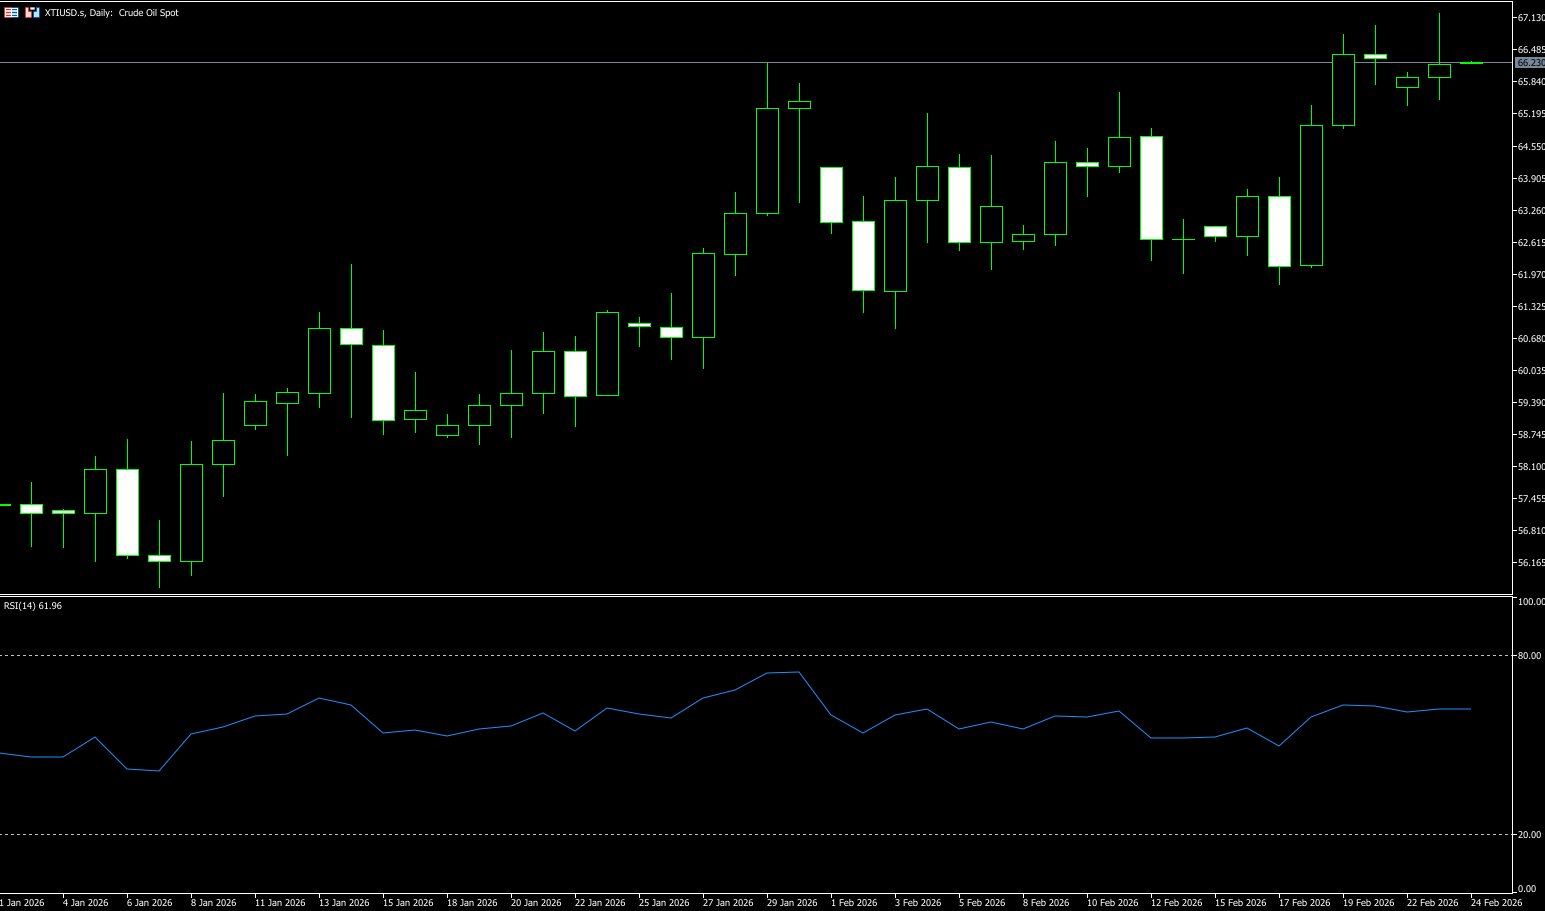
Oil prices performed strongly last week, with both major benchmark crude oils rising by more than 5% this week. In early trading this week, crude oil prices fell to $65.30, but remained near six-month highs. The core driver of current oil price volatility is geopolitical risk concerns stemming from escalating tensions between the US and Iran. US President Trump explicitly stated that if Iran does not agree to limit its nuclear program, he will set a 10-15 day deadline. This hardline stance significantly exacerbated market panic and fueled war risk premiums. Data shows that traders and investors have recently increased their purchases of Brent crude call options, fully reflecting market expectations for further price increases. Furthermore, Iranian military activities have further amplified market concerns; after temporarily closing the Strait of Hormuz for military exercises, Iran plans to conduct joint naval exercises with Russia.
Short-term WTI oil prices are complex, with profit-taking pushing a slight decline. The bullish hammer candlestick pattern on the chart failed to hold, indicating increased divergence in investment strategies and weakening bullish momentum, highly consistent with the current mixed bullish and bearish sentiment. Current oil prices are hovering around the late January high of $65.50-$66.00, with the RSI in the 60-65 range, indicating a high probability of a short-term pullback. The daily close broke below the year-end high of $65.24 (January 29th high) and the psychological level of $65.00, suggesting large-scale position liquidation and a potential period of price adjustment. Coupled with long-term oversupply pressure, the pullback could extend to the 14-day ($64.21) and 20-day ($64.06) moving averages. If geopolitical conflicts erupt or the Strait of Hormuz is blocked, oil prices could quickly break through the $68.37 (July 14th high of last year) and the psychological level of $70.00. If geopolitical risks escalate further, a test of the $71.56 (March 2019 high) area cannot be ruled out.
Today, consider going long on crude oil around 66.00; Stop loss: 65.80, Target: 67.50; 67.60
Spot Gold
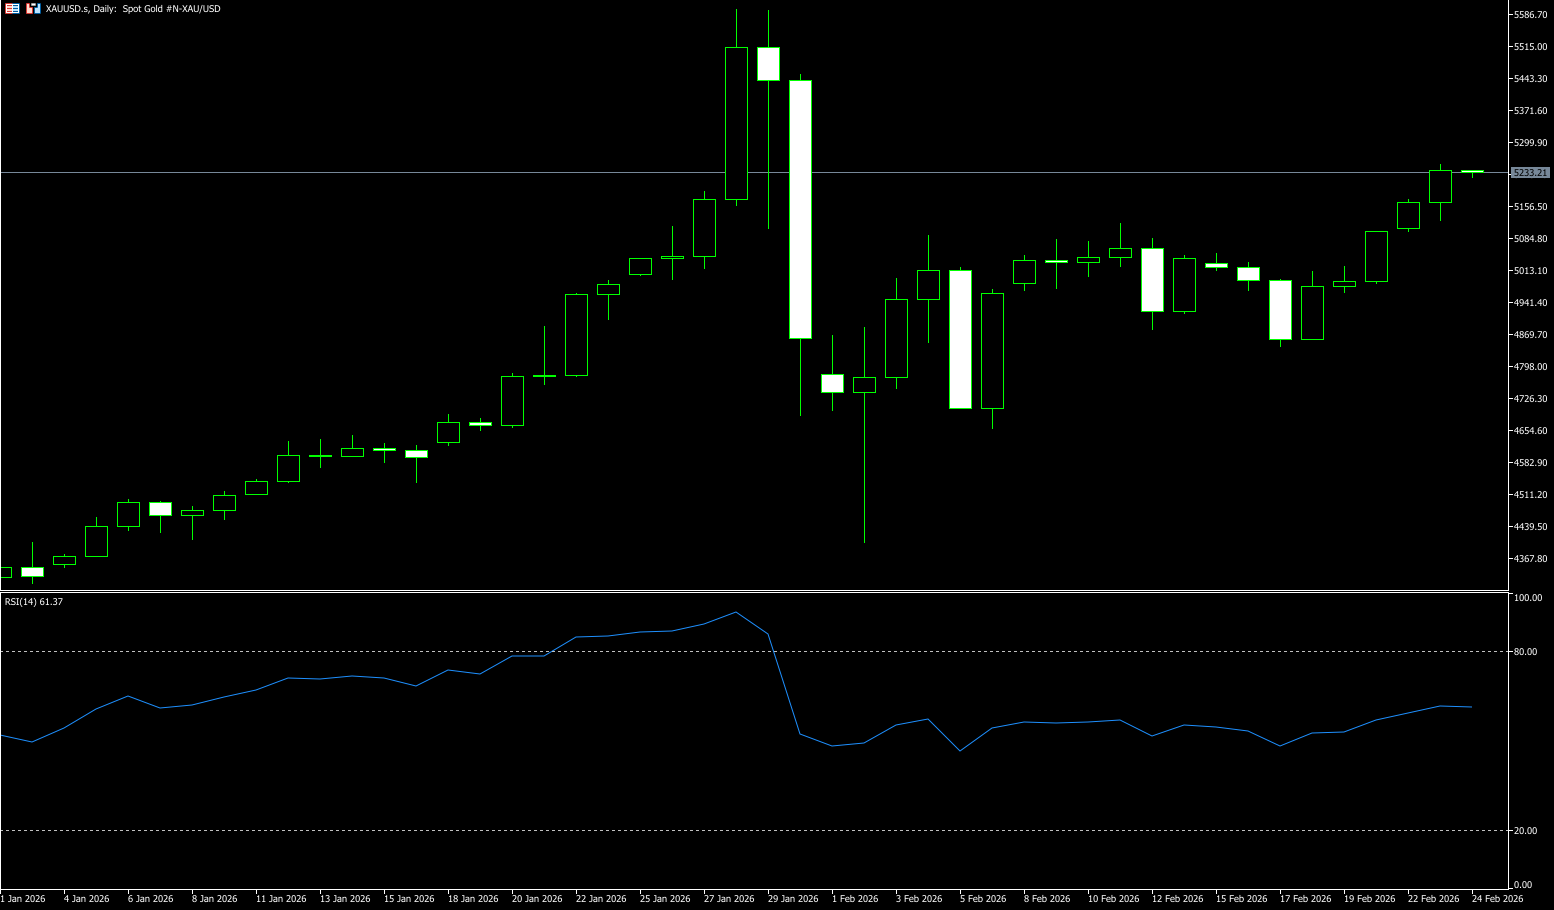
Gold rose more than 2% on Monday, trading above $5,210 per ounce, reaching its highest point in weeks, as escalating trade protectionism and geopolitical risks fueled safe-haven inflows. The rally accelerated after President Trump decided to impose a 15% global tariff under Section 122, circumventing the Supreme Court's recent restrictions on reciprocal tariffs. This policy shift triggered immediate retaliatory signals, with the EU proposing a suspension of ratification of a US trade agreement and India postponing interim negotiations. These trade frictions intensified as US-Iran nuclear talks stalled ahead of Thursday's Geneva meeting, while military buildup in the Middle East also increased. Despite the dollar index remaining at 97.8, gold received additional support after the holiday, with Chinese buyers returning. With the 10-year Treasury yield stabilizing at 4.07%, gold is leveraging its role as a hedge against a potential collapse in global trade and regional instability.
The daily chart shows that the 14-day Relative Strength Index (RSI) is above the 60 level, supporting a short-term bullish bias. The MACD histogram is narrowing in negative territory, indicating easing bearish pressure. Currently, the technical outlook for gold has turned neutral to bullish, but a break above the $5,182.30 (January 27 high) and $5,200 (psychological level) areas is needed to drive further upward movement. Once these levels are broken, the next resistance level will be $5,300, followed by the $5,450 area (January 30 high). On the downside, the psychological level of $5,000 provides key support; a break below this level could see gold test the $4,840 (last week's low) and $4,832 (38-day simple moving average) areas.
Consider going long on gold around 5,215 today; Stop loss: 5.210; Target: 5,270; 5,290
AUD/USD
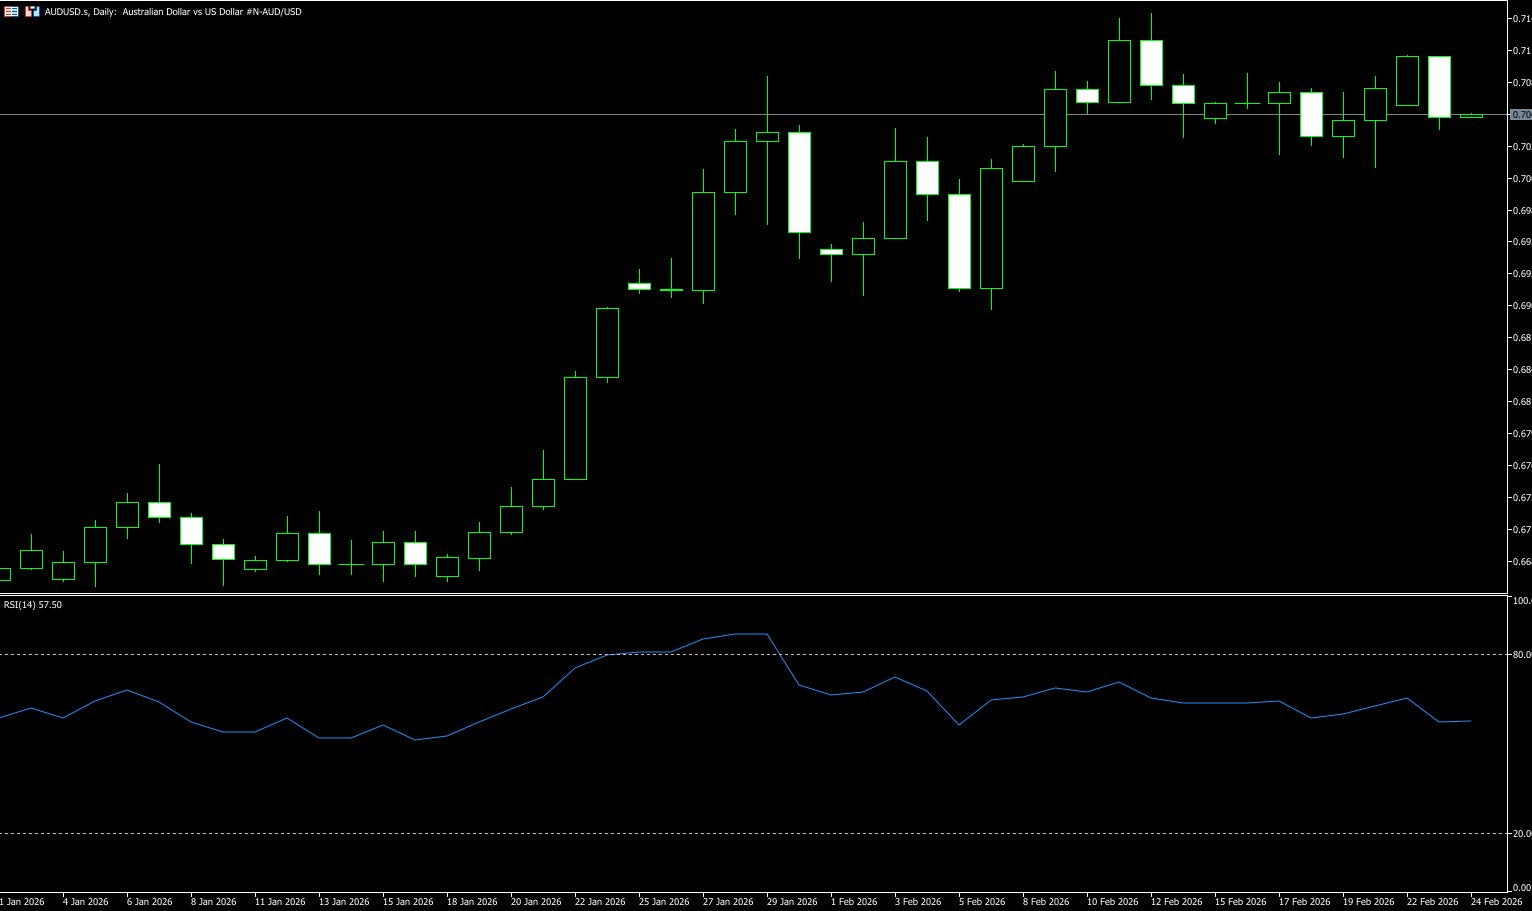
The Austrlian dollar/US dollar pair extended its gains in Asian trading on Monday, trading above 0.7100 at one point. The pair strengthened amid a weaker US dollar against major currencies due to persistent uncertainty surrounding trade tariffs. Trade policy uncertainty remains high after US President Trump criticized the Supreme Court for blocking his use of emergency powers to impose so-called reciprocal tariffs. However, gains in AUD/USD may be limited as tensions escalate between the US and Iran. Larger-scale attacks could be considered in the coming months if diplomatic efforts or initial targeted US strikes fail to persuade Iran to abandon its nuclear program. Meanwhile, the Australian dollar was supported by rising expectations of a hawkish outlook for the Reserve Bank of Australia (RBA). Stronger domestic data and robust guidance from policymakers have reinforced market expectations that the RBA may maintain a tightening bias to address persistent inflationary pressures.
The Australian dollar rebounded above 0.7100 against the US dollar early in the week, driven by persistent uncertainty surrounding trade tariffs, a weaker US dollar, and accelerating inflation nearing 3%. Currently, the pair is trading in a narrow range around 0.7100. From a technical perspective, after falling to 0.7015 last week, buyers pushed the pair above 0.7100 at the start of the week, and the AUD/USD pair has maintained an upward bias. Bullish momentum remains intact, with the Relative Strength Index (RSI) climbing upwards, nearing a bottom of 59.34. If the index surpasses 65.00, the AUD/USD could break through the next key resistance level of 0.7112, Monday's high, targeting the yearly high of 0.7147 (February 12th). This could pave the way for a further rise to the 0.7200 level. Conversely, if AUD/USD breaks below 0.7015 (last week's low) and the 0.7000 (psychological level) area, the first support level will be 0.6948 (30-day simple moving average). This will be followed by the 0.6900 level.
Consider going long AUD/USD near 0.7040 today; Stop loss: 0.7030; Target: 0.7100; 0.7110
GBP/USD
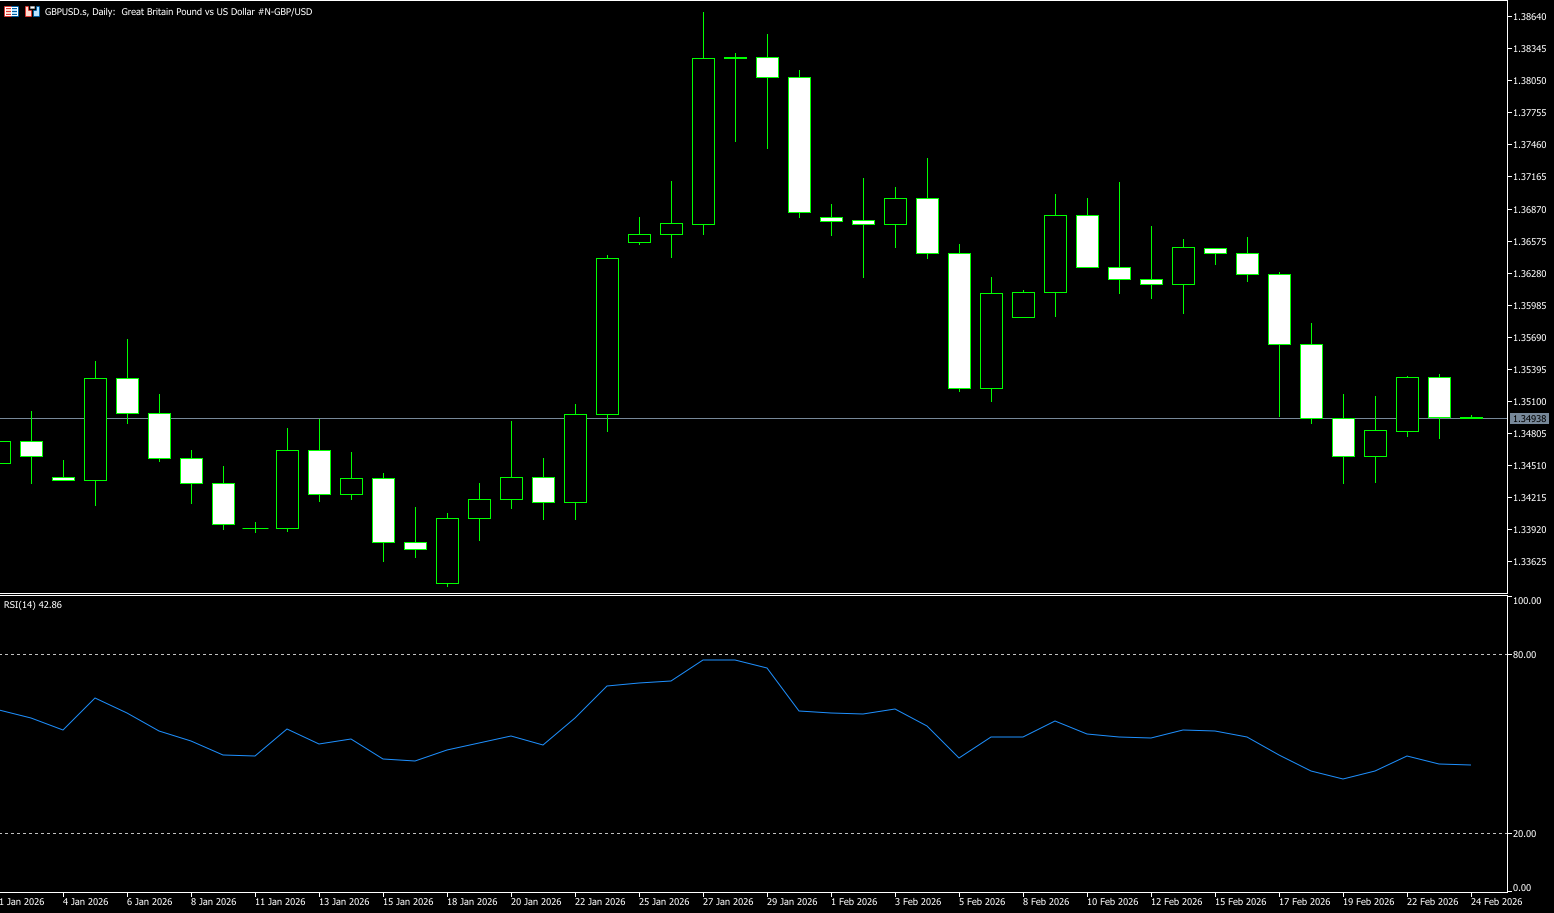
GBP/USD rose to around 1.3520 on Monday. The dollar faced some selling pressure due to continued tariff uncertainty. Traders will look for further clues from the US Producer Price Index report later on Friday. The US Supreme Court ruled on Friday that Trump's tariffs were illegal and exceeded his authority. It remains unclear whether the US needs to refund importers who have already paid tariffs, and the Supreme Court has not ruled on this issue. This has weakened the dollar to some extent, as it could benefit non-US economic growth, and stronger-than-expected UK economic data provided some support for the pound against the dollar. Meanwhile, investors' focus will shift to Friday's US January PPI report. Both overall and core PPI are expected to rise 0.3% in January. Any signs of accelerating inflation in the US could boost the dollar and exert downward pressure on currency pairs in the short term.
On the daily chart, GBP/USD is currently trading around 1.3500. The 100-day and 200-day simple moving averages are trending upwards, providing support for the exchange rate. The price is currently below the recent 50-day simple moving average around 1.3532, which constitutes short-term upward resistance. The upward trendline from 1.3009 provides support for the bullish pattern, with support around 1.3446 (the 200-day simple moving average). If the exchange rate closes effectively above the 50-day simple moving average at 1.3532, it will consolidate its upward momentum and target previous highs such as 1.3600 (a psychological level) and 1.3662 (last week's high). Conversely, if it fails to recover 1.3532, the exchange rate will likely consolidate. Given the nearby trendline support, a break below 1.3500 would increase the downside risk and could trigger a correction, testing the 1.3446 (200-day simple moving average) and 1.3400 support levels.
Today, consider going long on GBP/JPY around 1.3480; Stop loss: 1.3470, Target: 1.3540; 1.3530
USD/JPY
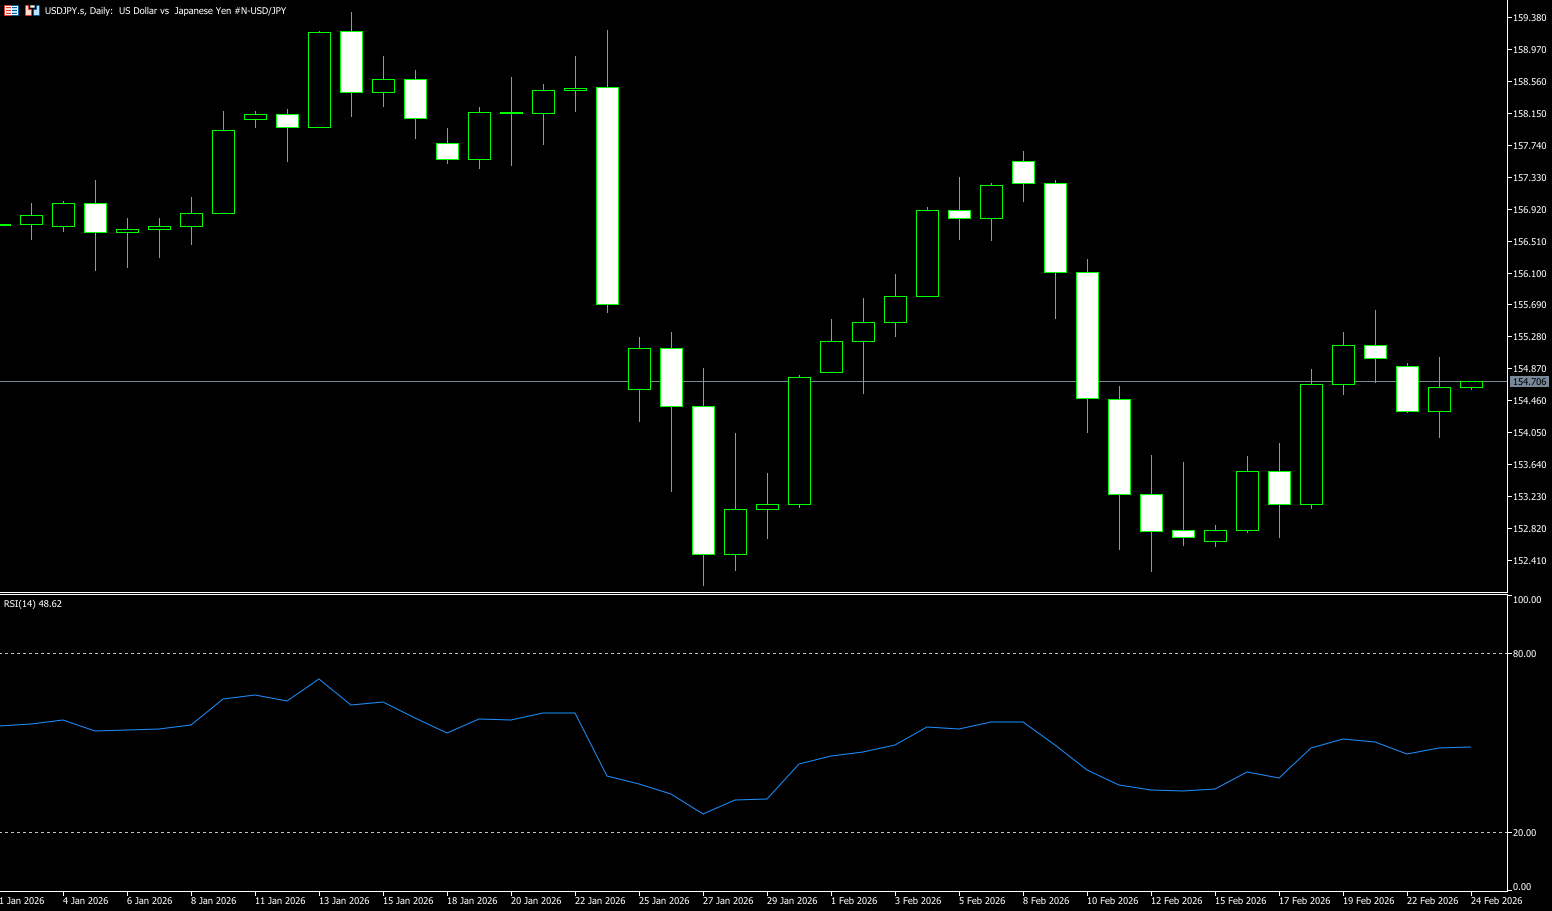
In early Asian trading on Monday, the USD/JPY pair faced selling pressure, falling back to around 154.00. The USD/JPY weakened due to tariff uncertainty. The US January Producer Price Index (PPI) report will be in focus later Friday. On Saturday, US President Trump announced an increase in global tariffs from 10% to 15% to maintain protectionist trade measures and launch several other investigations. Meanwhile, Japan's national consumer price index rose 1.5% year-on-year in January, compared to 2.1% in December. This figure is the lowest since March 2022, in line with the Bank of Japan's target. This could put pressure on the yen and limit the downside for the currency pair. Following Prime Minister Sanae Takaichi's victory in the quick election, traders will be closely watching potential fiscal spending plans. Prime Minister Takaichi stated last Friday that necessary spending would be funded as much as possible through the initial budget. She further noted that the debt-to-GDP ratio would be steadily reduced to restore fiscal sustainability.
The US dollar is currently weighed down by policy uncertainty, but the decline in Japanese inflation has also weakened the yen's fundamental support, resulting in a mild pullback rather than a trend reversal. In the short term, attention will be focused on the US PPI data. If inflation rebounds, the dollar may regain support; if the data is weak, USD/JPY may fall further. Pay attention to the effectiveness of the 154.00 support level and await fundamental catalysts to clarify the direction. The daily chart shows that USD/JPY encountered resistance above 155.00 and retreated, with short-term momentum weakening. The MACD shows initial signs of a bearish crossover at high levels, and the RSI has fallen from overbought territory, indicating a slowdown in the upward pace. The 154.00 (psychological level) and the 153.84 (9-day moving average) area are key short-term support levels. A break below these levels could lead to further testing of the February 18 low of 153.07 and the 153.00 (psychological level) area; resistance lies at the 155.00 (psychological level) and 155.56 (last week's high). The overall structure has shifted from a one-sided upward trend to high-level consolidation.
Consider shorting the US dollar around 154.82 today; Stop loss: 155.00; Target: 154.10; 154.00
EUR/USD
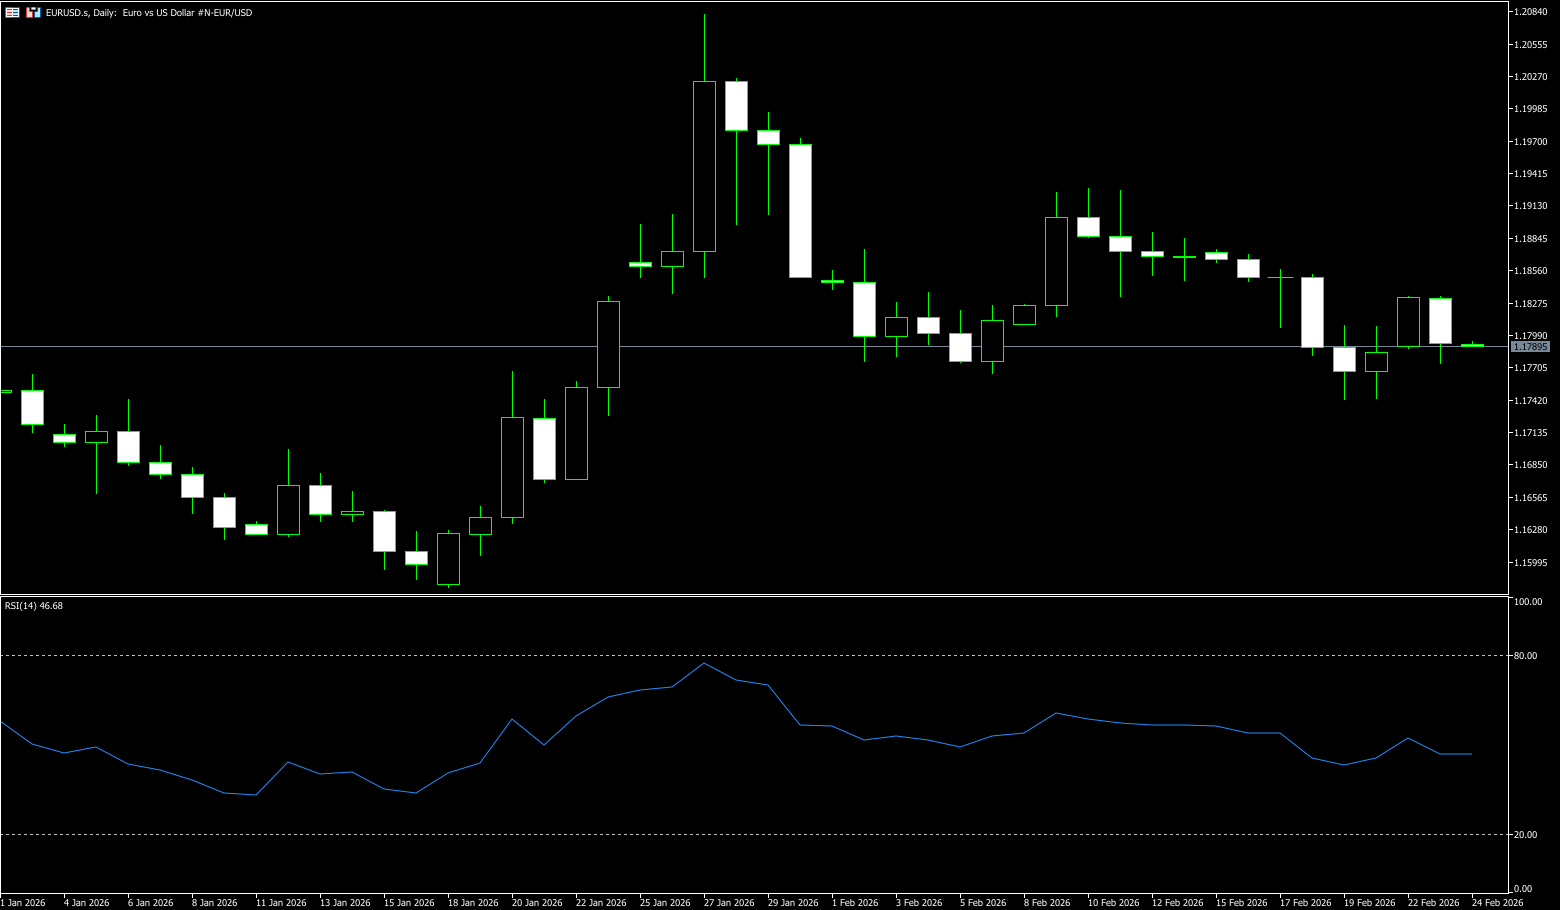
The EUR/USD pair continued its rebound from Friday's lows in the 1.1750-1.1740 area, or close to a one-month low, and gained some positive follow-through at the start of the new week. Momentum pushed the spot price up to the 1.1820 area during the Asian trading session, supported by a broad-based weakening of the US dollar. Despite legal setbacks, US President Trump stated that his trade agenda remained steadfast and quickly announced a new 15% tariff framework. Furthermore, a weak US GDP report overshadowed strong US inflation data, pulling the dollar away from four-week highs and providing a tailwind for the EUR/USD pair for the second consecutive day. Nevertheless, traders are still pricing in a higher probability of a Fed rate cut in June and expect at least two 25 basis point cuts in 2026. This further weakened the dollar and supported the EUR/USD pair.
On the daily chart, EUR/USD is trading between 1.1790 and 1.1800. The 20-day simple moving average (SMA) is sloping downwards and above the price, emphasizing continued selling pressure. The 20-day SMA at 1.1855 acts as initial resistance for EUR/USD. The 14-day Relative Strength Index (RSI) remains near 50, indicating a continued easing of bearish pressure. Currently, the technical outlook for gold has turned neutral to bullish, but a break above the 20-day SMA at 1.1855 and the 1.1877 area (last week's high) is needed for EUR/USD to have a chance to challenge the 1.1900 psychological level and the 1.1926 level (February 9 high). Additionally, the 61.8% Fibonacci retracement level from the low of 1.1590 to the high of 1.2026 is at 1.1757, a key technical level. A close below this level would expose the 1.1700 psychological level. Then there's the 78.6% Fibonacci retracement level at 1.1683.
Today, consider going long on the Euro around 1.1776; Stop loss: 1.1763; Targets: 1.1830, 1.1820
Disclaimer: The information contained herein (1) is proprietary to BCR and/or its content providers; (2) may not be copied or distributed; (3) is not warranted to be accurate, complete or timely; and, (4) does not constitute advice or a recommendation by BCR or its content providers in respect of the investment in financial instruments. Neither BCR or its content providers are responsible for any damages or losses arising from any use of this information. Past performance is no guarantee of future results.
More Coverage


Risk Disclosure:Derivatives are traded over-the-counter on margin, which means they carry a high level of risk and there is a possibility you could lose all of your investment. These products are not suitable for all investors. Please ensure you fully understand the risks and carefully consider your financial situation and trading experience before trading. Seek independent financial advice if necessary before opening an account with BCR.
BCR Co Pty Ltd (Company No. 1975046) is a company incorporated under the laws of the British Virgin Islands, with its registered office at Trident Chambers, Wickham’s Cay 1, Road Town, Tortola, British Virgin Islands, and is licensed and regulated by the British Virgin Islands Financial Services Commission under License No. SIBA/L/19/1122.
Open Bridge Limited (Company No. 16701394) is a company incorporated under the Companies Act 2006 and registered in England and Wales, with its registered address at Kemp House, 160 City Road, London, City Road, London, England, EC1V 2NX. This entity acts solely as a payment processor and does not provide any trading or investment services.

 English
 简体中文
简体中文
 繁體中文
繁體中文
 Bahasa
Melayu
Bahasa
Melayu
 Tiếng
Việt
Tiếng
Việt
 ไทย
ไทย
 日本語
日本語
 한국어
한국어
 ភាសាខ្មែរ
 español