


0
Currency & Commodity Analysis:
US Dollar Index
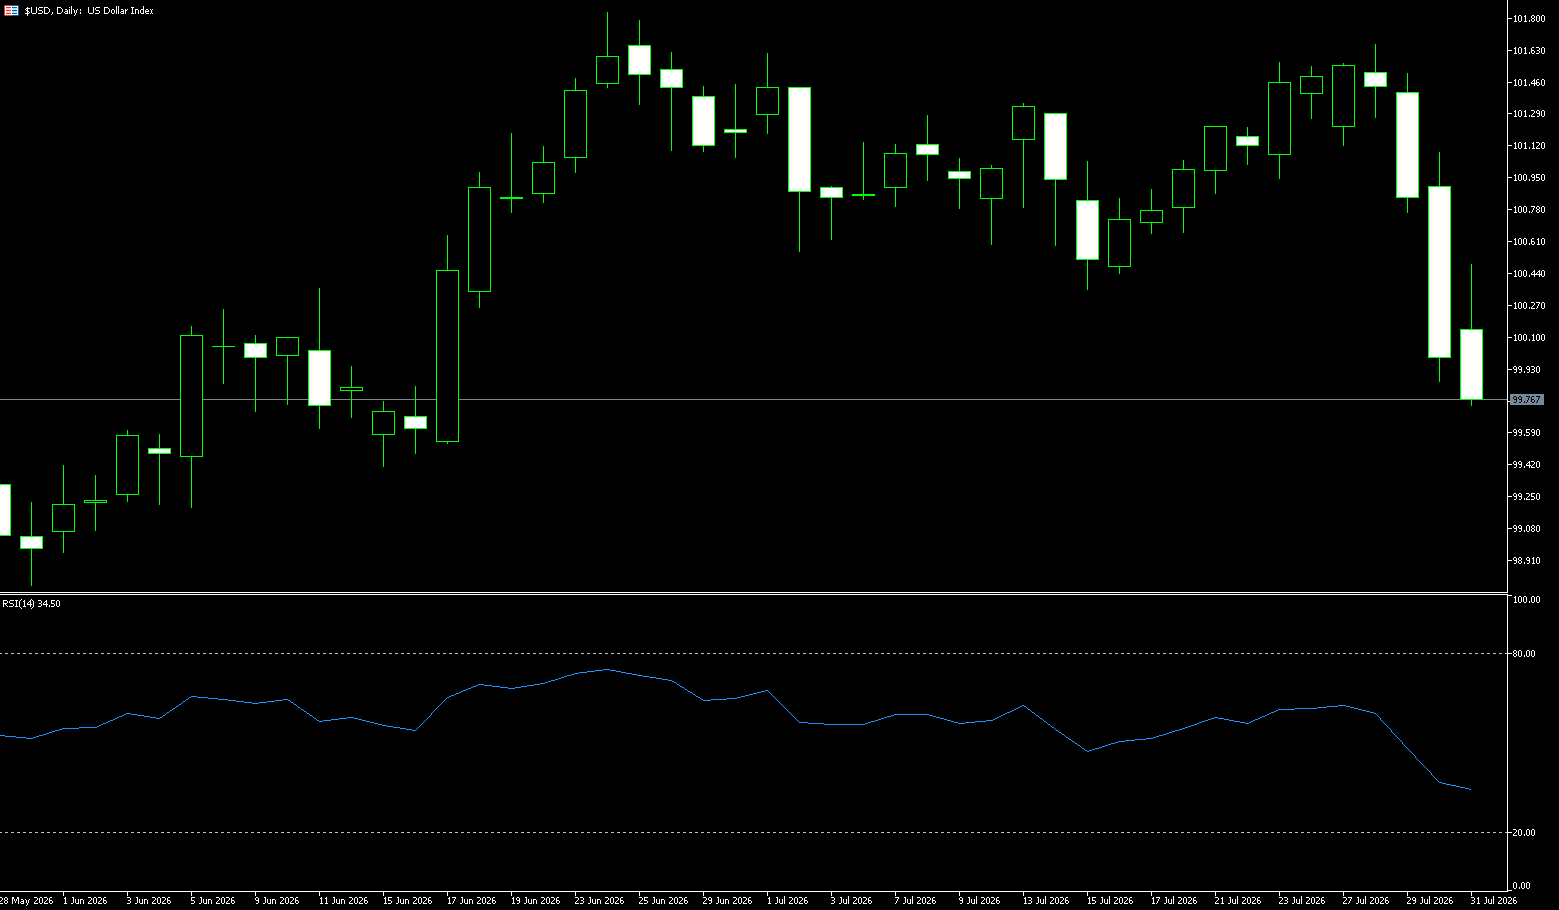
The US dollar index rose slightly to around 100 at the beginning of the week before falling back. Easing geopolitical tensions reduced safe-haven demand, putting pressure on the dollar but supporting the euro and yen. Furthermore, the New York Fed was reported to have sold euros on behalf of the US Treasury through banks in exchange for yen to avoid signaling a broad-based weakening of the dollar. The dollar index fell to 99.42 in early August, its lowest point in seven weeks, as the yen staged a new round of strong rebound, while foreign investors continued their trend of partially reducing their dollar positions from the previous week. The yen extended its upward momentum after the US Treasury used its large euro holdings to buy more yen, amplifying the yen's initial rebound following Tokyo's intervention in the foreign exchange market. These developments exacerbated the dollar's decline following the last Federal Reserve meeting. Meanwhile, the yen could weaken again after a short-term strengthening if the Bank of Japan does not cooperate in tightening monetary policy. The decline in US Treasury yields has provided additional support for gold and allowed the dollar index to struggle to hold steady amid divergence among non-US currencies.
Overall, the latest CFTC report suggests that the consolidation phase that has persisted in recent weeks may be giving way to the re-establishment of bullish dollar positions. While current positioning is skewed towards constructive rather than crowded, the rebound in weekly net inflows and improved momentum over four weeks provide a supportive backdrop for the dollar. As long as US economic data remains resilient and market expectations for Fed policy continue to lean towards "higher and longer interest rates," speculative positioning appears to have room for further strengthening. Therefore, on the upside, the first level to watch is 100.45 (last Friday's high); a break above this level could challenge the 100.71 (9-day simple moving average) area. On the other hand, the large bearish candlestick on the weekly chart has completely erased the gains of the previous weeks, indicating a strong bearish signal at the four-star level. Therefore, on the downside, consider 99.80 (lower Bollinger Band), followed by 99.42 (early week low).
Today, consider shorting the US Dollar Index at 100.00, with a stop-loss at 100.10 and targets at 99.55 and 99.60.
WTI Crude Oil
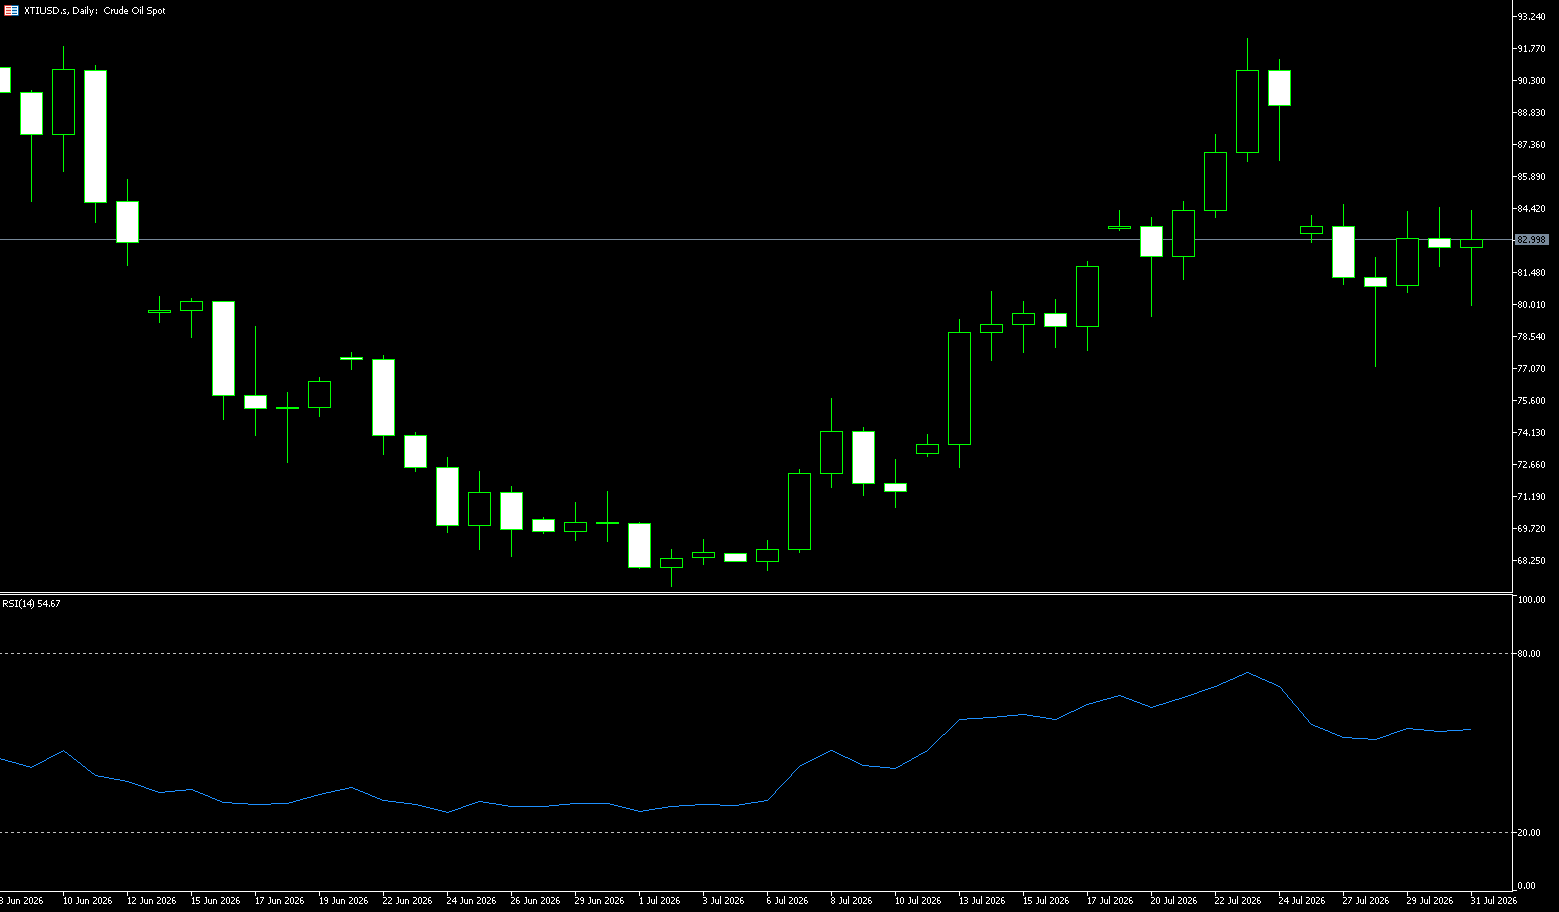
US crude oil (WTI) fell sharply on Tuesday, trading around $74.50 a barrel at the time of writing, its lowest level in the past three weeks. Oil prices remained under pressure after a series of comments boosted expectations of a possible easing of tensions between the US and Iran, which could lead to the reopening of the Strait of Hormuz. Oil prices plunged more than 7% on Monday, but Iran emphasized that it had not negotiated with the United States and would not allow the US to open non-Iranian shipping lanes in the Strait of Hormuz, adding further uncertainty to the Middle East situation. Trump subsequently stated that negotiations were "ongoing" and threatened "decapitation" if Tehran did not agree to an agreement, but the market still anticipated improvements on the supply side. This, coupled with the OPEC+ alliance's approval on Sunday to increase production quotas by approximately 188,000 barrels per day starting in September, further pressured oil prices. In addition, shipping tracking data showed that six Saudi supertankers were diverted to southern Africa due to threats from the Houthi rebels in Yemen, but other Saudi tankers continued to pass through the Bab el-Mandeb Strait. Meanwhile, ship traffic in the Strait of Hormuz slowed, and US gasoline and diesel futures both fell by about 5%. This sell-off was yet another overreaction to Trump's remarks.
International oil prices fell significantly on Monday due to Trump's comments on suspending military action and negotiations. Brent crude futures fell more than 7% to around $83.52 a barrel; WTI crude had previously plunged more than 6% to around $77.50 due to progress in US-Iran negotiations and expectations of geopolitical easing. The market remains cautious; if the US-Iran standoff continues in a cycle of verbal exchanges, denials, and further threats, oil price volatility could intensify further. In the short term, oil prices may see a corrective rebound after excessive declines, as the reality of Iran's refusal to negotiate and the restrictions imposed by Hormuz remain unchanged. However, any substantial diplomatic breakthrough could push oil prices to new lows, resulting in extremely high risk of two-way volatility. On the upside, initial resistance can be seen around $80 (a psychological level), followed by $82.90 (the 60-day moving average). If supply recovers faster than inventory replenishment, the price fluctuation center may gradually shift downwards to Monday's low of $70.70 (July 10th low) and then to the $70.00 (psychological level).
Today, consider going long on crude oil at $74.20, with a stop loss at $74.00 and a target of $76.00. 77.00
Spot Gold
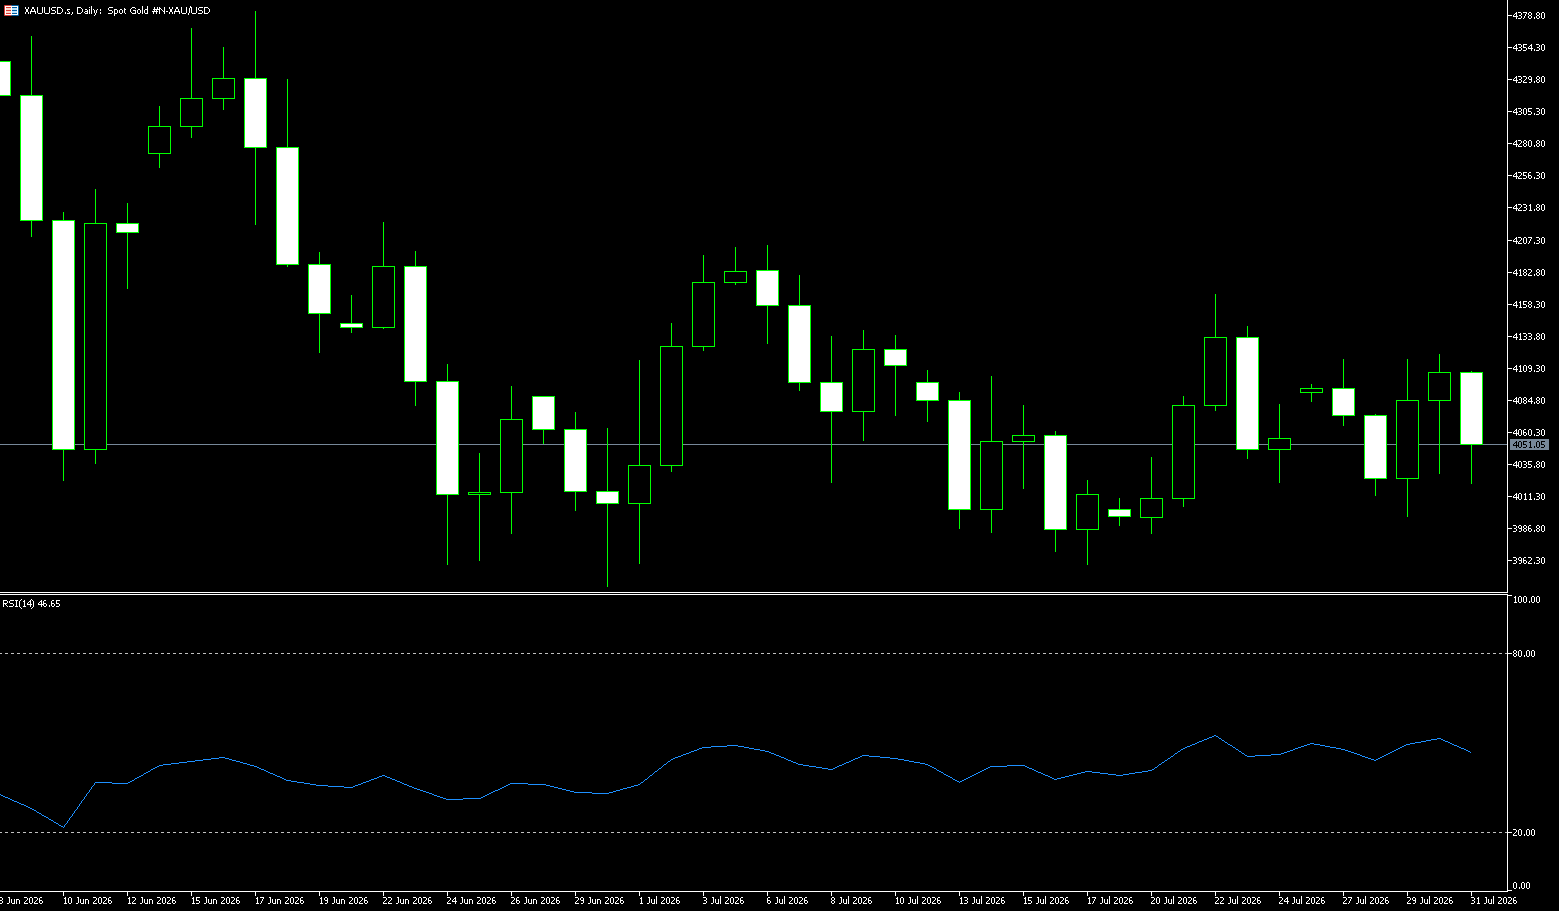
On Tuesday, spot gold held steady around $4065 per ounce, influenced by uncertainty surrounding the Middle East war, concerns about rising inflation, and the market's anticipation of this week's US employment data to gauge the Fed's policy direction. Gold has been fluctuating between $4000 and $4200 for over a month, supported by market expectations of a potential resurgence of inflation, particularly with July data potentially reversing some of June's losses. Meanwhile, three Fed officials advocated for interest rate hikes at last week's policy meeting, and New York Fed President Williams also stated that the Fed is prepared to raise rates if inflationary pressures do not ease. Iran denied any negotiations or planned meetings with the US on Monday, contradicting Trump's statements. The immediate trigger for this round of gold price increases and subsequent declines was US President Trump's sudden halt to the planned "massive strike" against Iran over the weekend, declaring that negotiations would take place. This statement quickly pushed gold prices higher in early trading on Monday, as the market briefly interpreted it as a de-escalation of the conflict. Safe-haven demand has temporarily eased.
From the daily chart, spot gold is trading within a descending wedge, with the latest price still slightly below the 34-day moving average of 4,076, indicating that the rebound has not yet broken through the medium-term equilibrium zone. The MACD indicator suggests that downward momentum continues to weaken, but both trend lines remain below the zero line, therefore the current signal is more like a correction within a downtrend than a complete reversal. The recent lows of $3,943.60 and $3,959.50 form a strong support level below. The recent rebound high for gold is $4166 (July 21 high). If gold prices continue to hold above $4076 (34-day moving average), the technical focus may shift towards the $4166-$4170 area. However, if prices encounter resistance again near the $4076 (34-day moving average), the descending wedge pattern remains valid, and the market may continue to seek equilibrium within the $4000 (psychological level) - $3982 (last month's low).
Today, consider going long on gold at $4070, with a stop-loss at $4065; targets: $4100; $4120.
AUD/USD
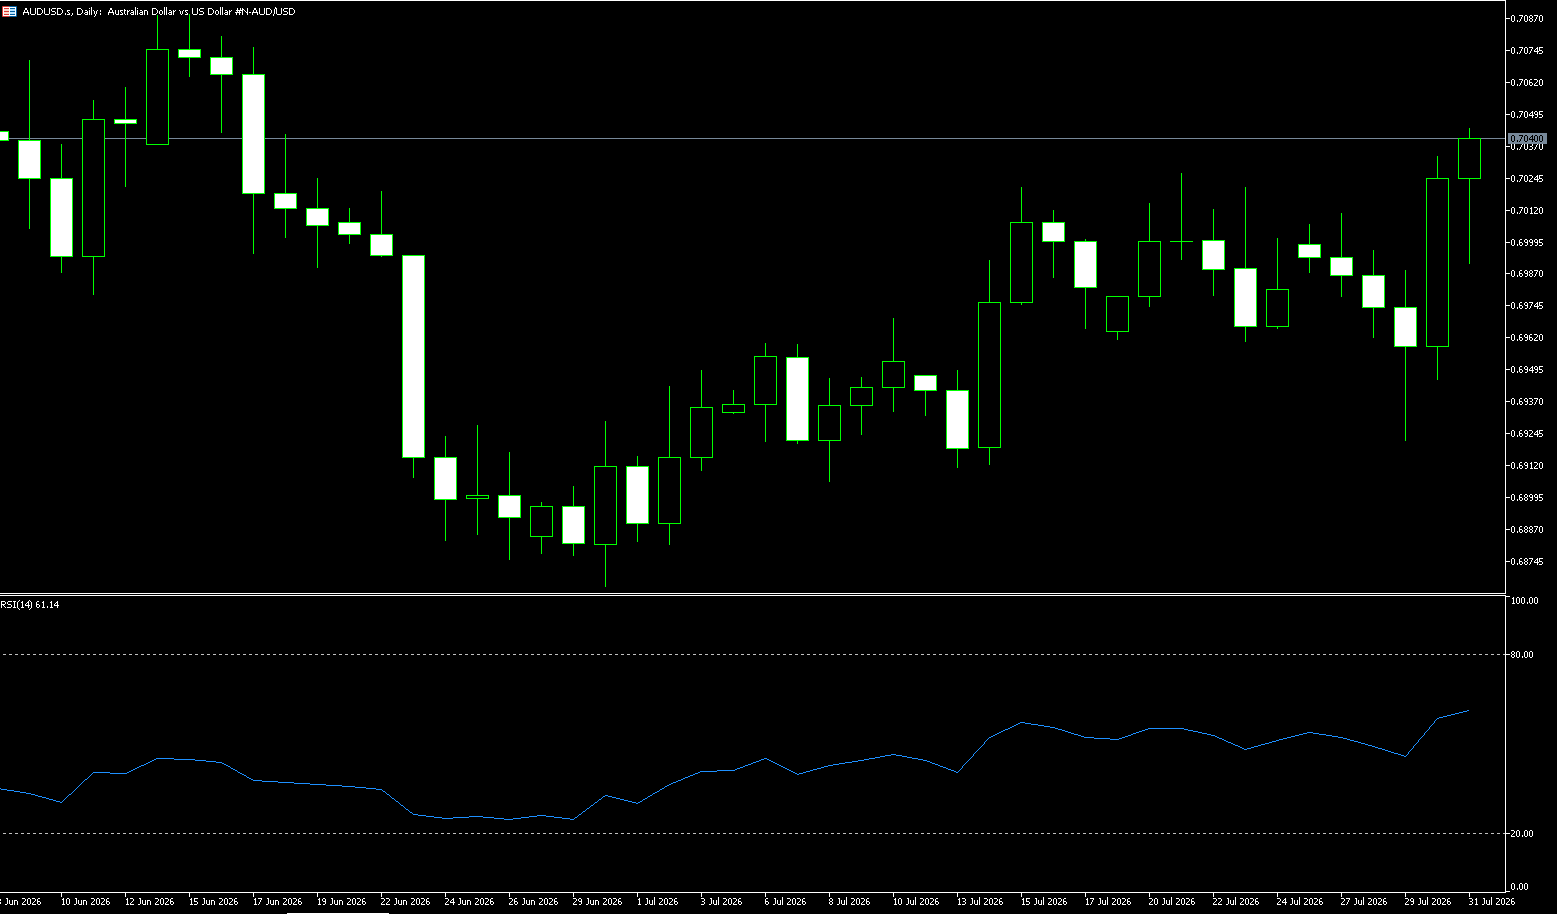
On Tuesday, the Australian dollar is currently trading near the 0.7040 level against the US dollar. The pair had previously tested 0.7050, but despite generally positive global market risk appetite, the US dollar recovered some ground supported by strong economic data, while signs of easing geopolitical tensions in the Middle East combined to put downward pressure on the Australian dollar. The US ISM Manufacturing PMI for July came in at 55.6, higher than the previous reading of 53.3, marking the highest level since 2022. Sub-indices showed continued hiring, but the prices paid index reflected persistently high input costs. Overall, despite mixed sub-indices, the manufacturing sector's overall expansion momentum was strong, providing upward pressure on the US dollar. As for the Australian dollar, although it opened higher due to intervention in the US and Japanese currency markets, it subsequently weakened as yen cross rates declined.
In summary, the Australian dollar is currently constrained by the rebound of the US dollar and the plunge in oil prices, with the 0.7000 level becoming a key battleground between bulls and bears. Its future direction will heavily depend on US employment data and Australian domestic confidence indicators. On the daily chart, the Australian dollar is trading at 0.7040 against the US dollar, holding above the 200-day simple moving average of 0.6915, but still constrained by the 100-day simple moving average of 0.7051, keeping the short-term trend neutral to bearish. Momentum is slightly constructive, with the Relative Strength Index (RSI) hovering around 54 and the Average Directional Index (ADI) around 15, indicating a weak trend with no clear direction. Prices are more likely to consolidate below these moving average resistance levels than to develop a clear directional move. Above, there are 0.7050 (Monday's high) and 0.7051 (100-day simple moving average), followed by the round number 0.7100. However, if this level holds again, the pair risks a pullback to 0.6946 (July 30 low) and the 200-day simple moving average at 0.6913.
Consider going long on the Australian dollar today at 0.7035, with a stop loss at 0.7025 and targets at 0.7070 and 0.7080.
GBP/USD
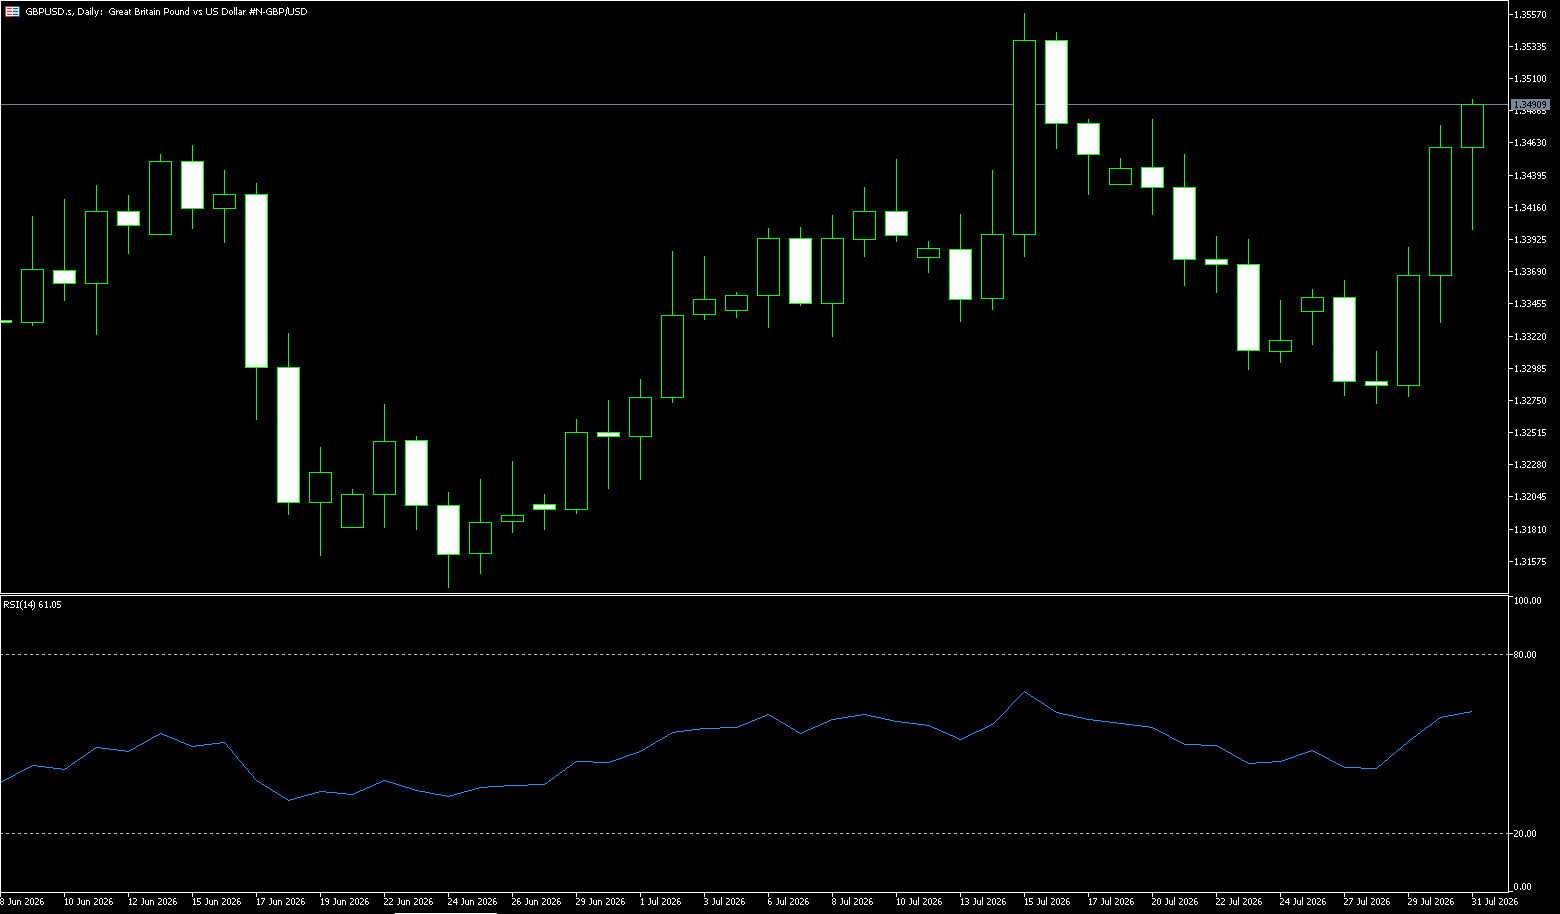
On Tuesday, the pound/dollar pair fell to around 1.3425. Uncertainty surrounding US-Iran negotiations drove traders to safe-haven currencies like the dollar, putting pressure on the pound. Market attention will be focused on US July jobs data, to be released later on Friday. Additionally, optimistic US economic data provided some support for the dollar and pressured major currency pairs. Data released by the Institute for Supply Management (ISM) on Monday showed that the US manufacturing Purchasing Managers' Index (PMI) rose to 55.6 in July, up from 53.3 in June. This figure was stronger than the market expectation of 54.0. Last week, the Bank of England kept interest rates unchanged at 3.75% by a 6-3 vote, with three policymakers supporting a rate hike. Bank of England Governor Andrew Bailey refuted market expectations of an impending tightening cycle, stating that the deflationary process remains intact. The market is currently only pricing in a rate hike before the end of the year, while renewed tensions between the US and Iran continue to add uncertainty to the economic outlook.
Looking ahead, market focus has shifted to Friday's US July jobs report. Prior to that, geopolitical news and US economic data will continue to dominate the GBP/USD exchange rate's two-way movement. On the daily chart, GBP/USD is trading at 1.3425, currently testing the area below a descending trendline that was broken at 1.3449. The Relative Strength Index (RSI) is at 53.95, indicating robust momentum and no overbought conditions. As long as the pair holds support at its 200-day simple moving average (SMA) of 1.3400, further upside is possible. On the upside, immediate resistance lies at the psychological level of 1.3500, followed by the next resistance near the previous ascending trendline breakout point at 1.3551. On the downside, key technical support is provided by the 200-day SMA at 1.3400. A daily close below this level would weaken the current constructive tone and expose a deeper pullback to the 1.3343 (34-day SMA) level.
Consider going long on GBP/USD at 1.3440 today, with a stop loss at 1.3430 and targets at 1.3490 and 1.3500.
USD/JPY
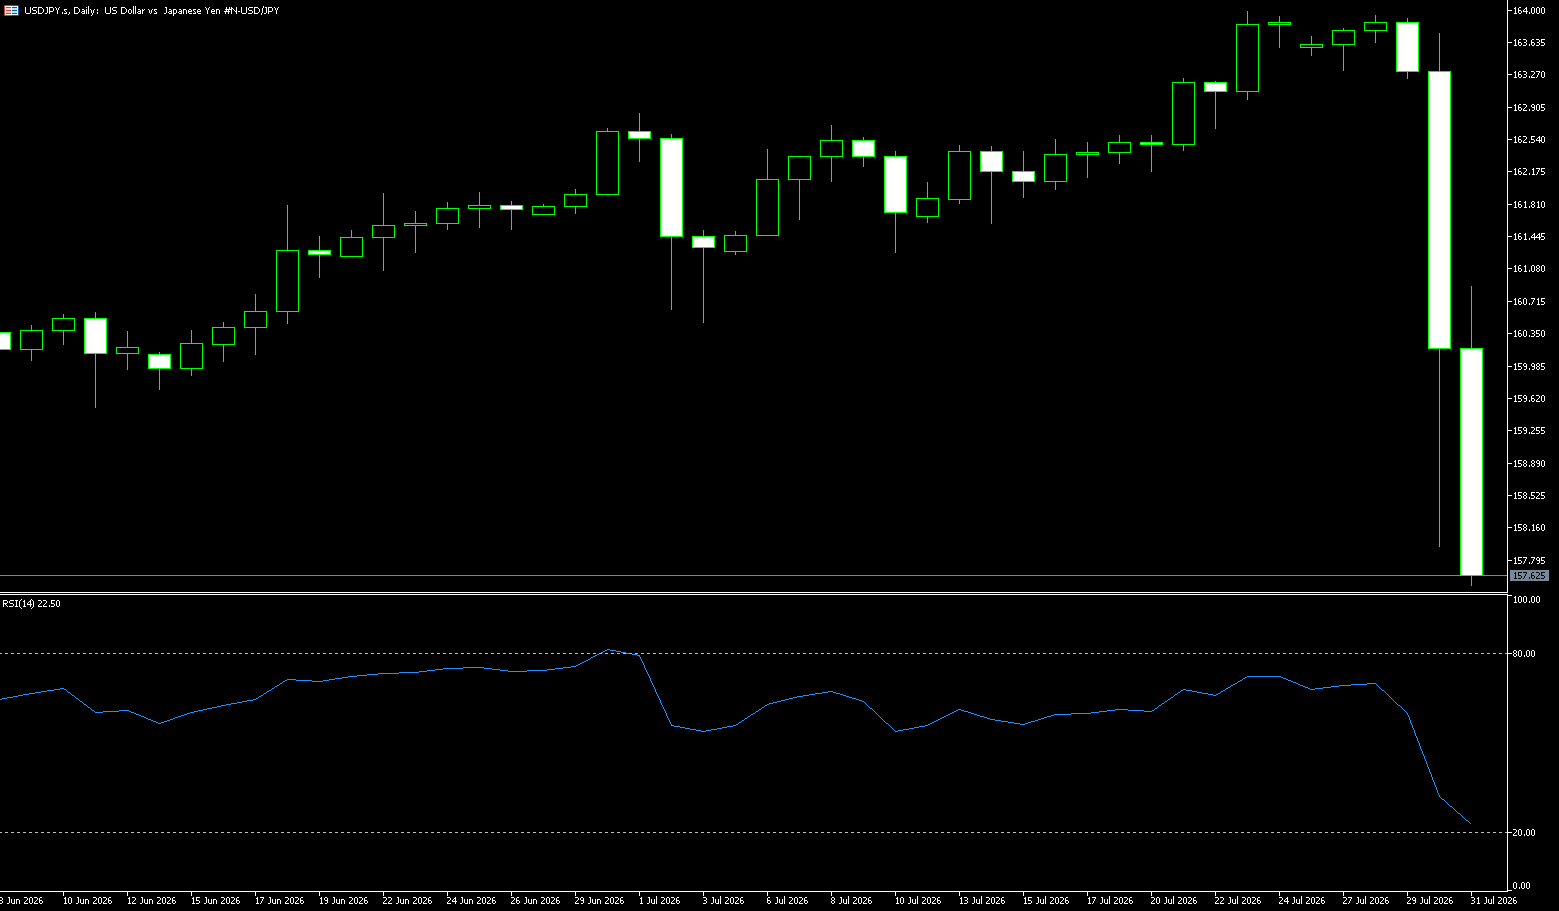
The yen traded near 157.60 per dollar on Tuesday, maintaining most of its gains from the previous days, as coordinated support signals from the US and Japan kept markets on edge, anticipating further intervention. US Treasury Secretary Scott Bessant urged the Federal Reserve to expand its foreign exchange and international monetary authorities repurchase facilities, which allow foreign governments to obtain dollars using their Treasury bonds as collateral. This was followed by comments from Bessant and President Donald Trump confirming coordinated US-Japanese intervention to support the yen. Meanwhile, data from the Bank of Japan showed that Tokyo spent approximately ¥5.33 trillion in operations on Friday, following a reported record single-day intervention of ¥8.45 trillion the previous day. The yen fell to a 40-year low last month due to rising energy costs, heightened fiscal concerns, and a persistent interest rate differential.
USD/JPY is trading around 157.50, maintaining a short-term bearish bias as the spot price is well below the 20-day exponential moving average (EMA) at 161.14. The pair's chart structure shows an emerging head and shoulders pattern, with the right shoulder yet to form, potentially near 160.00, suggesting a possible respite after the sharp decline. The pair has retreated from recent highs, with the RSI{14} at 26.90, in oversold territory, suggesting that downward momentum has been overextended, but no clear reversal signal has yet appeared. The psychological level of 160.00 will be a key resistance level. After that, the pair may retest 155.23 (Monday's low) and the neckline near 155.10. Conversely, if the pair can extend its rally above the July 16 low of 162.00, it will regain a bullish bias. A break above 162.00 would allow the pair to retest the multi-decade highs near 164.00.
Today, consider shorting the US dollar at 157.85, with a stop-loss at 158.00 and targets at 157.00 and 156.80.
EUR/USD
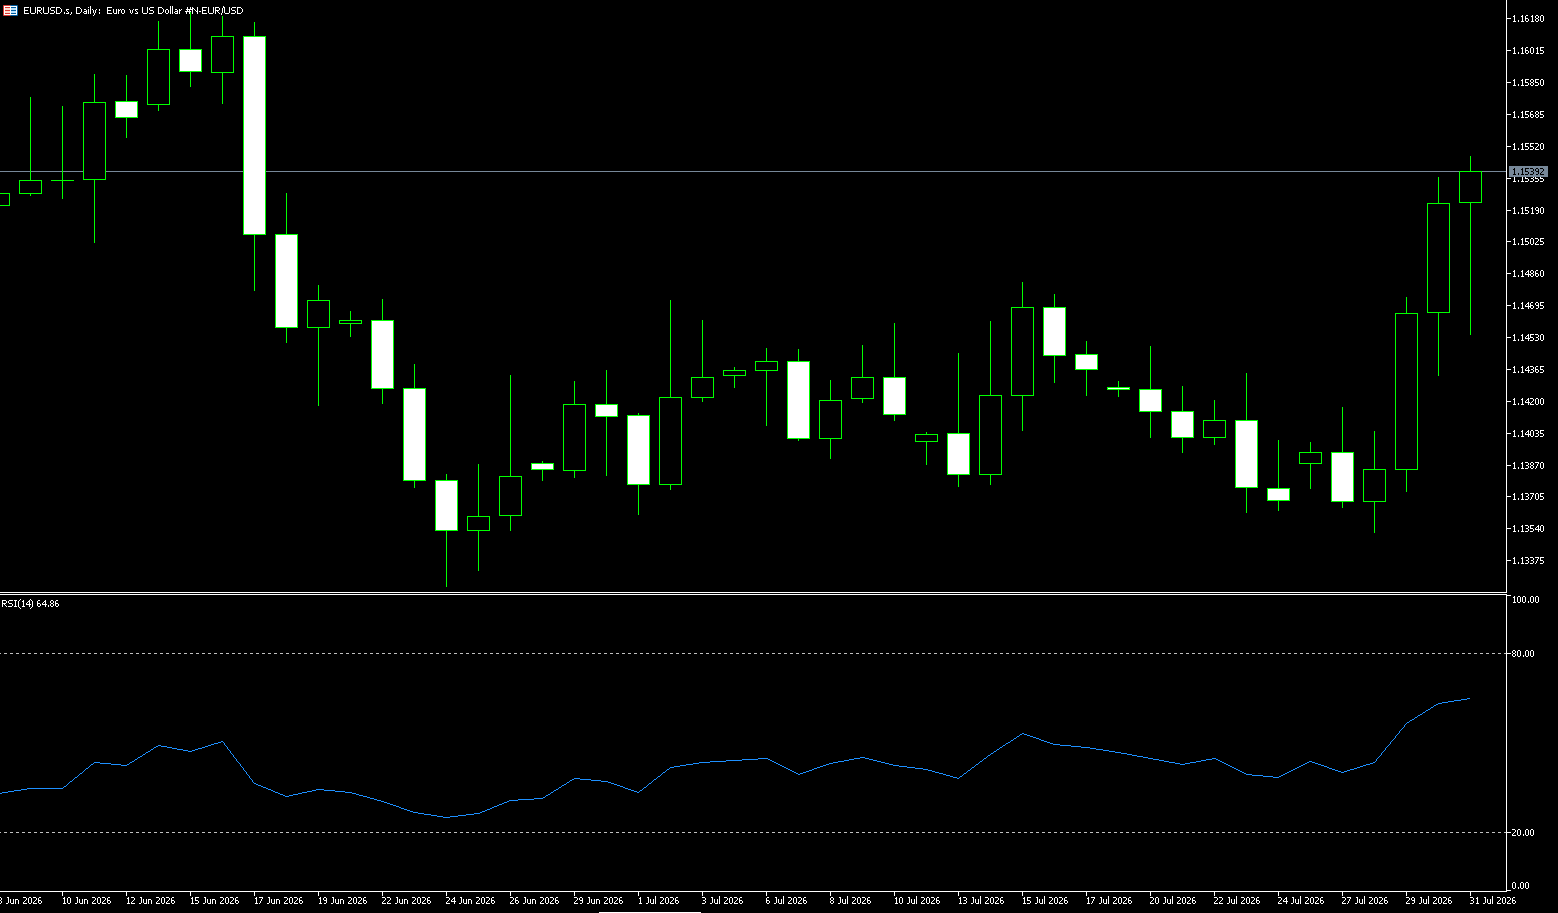
The euro is trading slightly above $1.15, hovering near its highest level since June 16, as risk sentiment improved following a sharp drop in oil prices. Markets are hopeful for a US-Iran agreement to reopen the Strait of Hormuz, easing concerns about a broader Middle East conflict, as President Trump indicated new talks with Tehran would begin on Monday. The decline in oil prices moderately reduced expectations for further tightening by the European Central Bank, although the possibility of a rate hike by September remains widely priced in. Meanwhile, stronger-than-expected Eurozone data continues to support the policy outlook. The region's economy grew by 0.4% in the second quarter, exceeding the expected 0.2% and marking the fastest growth since early 2025. Meanwhile, annual inflation accelerated to 2.9% in July, with core and services inflation also strengthening.
In the short term, the EUR/USD pair is expected to digest the news impact around the 1.1500 level, with the effectiveness of the Bollinger Band middle line support at 1.1423 determining the short-term trend. If the Rhine River water level hits a new low this week and triggers more energy alarms, the exchange rate may seek support around 1.1380. In the medium term, close monitoring of water level changes and electricity price increases is necessary, as these will be leading signals of a shift in sentiment. On the 240-minute chart, the EUR/USD pair is currently above 1.1500, with the Relative Strength Index (RSI) in the bullish zone at 58.70. After rebounding from 1.1352 (the low of July 28), the price briefly broke through the Bollinger Band upper line at 1.1523 to 1.1558 before retreating slightly. The key support level is currently at the Bollinger Bands midline at 1.1423. If this level holds, the bullish momentum could continue to rise to 1.1558 and the 1.1600 level. However, a break below this level would reverse the short-term uptrend, and market sentiment would quickly shift towards a defensive stance towards 1.1455 (last Friday's low) and the Bollinger Bands midline support at 1.1423.
Today, consider going long on the Euro at 1.1516, with a stop-loss at 1.1505 and targets at 1.1560 and 1.1550.
Stock Analysis:
Australian ASX 200 Stock Index
Basic Market Overview:
The Australian ASX 200 extended its gains to a third consecutive trading day on Tuesday, climbing 127 points, or 1.4%, to close at 9,149, its highest level since early March. Improved market sentiment, supported by a pullback in oil prices, boosted risk appetite, driven by stronger US stock index futures following Monday's Wall Street rally. Locally, personal consumption expenditure rose 0.8% month-on-month in June, easily exceeding the market consensus of 0.2%. However, gains were limited by caution regarding key trade data due later this week for Australia and its largest trading partner, China. Buying was broad-based, with technology, logistics, and healthcare sectors leading the gains.
Shares of the four major banks rose between 1.7% and 2.7% after Morgan Stanley indicated the sector was poised for strong earnings. Charter Hall Infrastructure REIT shares surged 8.6% after reporting a 12.6% increase in annual operating income. Technology stocks followed their U.S. counterparts higher, with Xero rising 3.5%, Technology One gaining 3.3%, and WiseTech Global climbing 3.0%, all recording substantial increases.
Sector Performance:
Leading Sectors
1. Information Technology (IT) +3.9% (Strongest Performer)
Following the Nasdaq AI rally, it closed higher for the 7th consecutive trading day.
• Strong performers: Life360 +11.4%, Appen +6.0%, Megaport +5.7%, Xero +3.5%, WiseTech +3.0%
2. Healthcare +2.4%
Medical devices and biotechnology stocks collectively strengthened.
• Strong performers: 4DMedical +8.6%, Pro Medicus +4.9%, CSL +3.6%
3. Financials +1.9%
With earnings season approaching, the Big Four banks led the financial sector.
• Strong performers: NAB +2.4%, Westpac +1.9%, ANZ +1.9%, CBA +1.8%; REITs Charter Hall surged 8.6%
4. Real Estate +1.5%, with industrials and materials sectors also recording strong gains.
Lagging Sectors / Weakest Performing Sectors
1. Consumer Staples -0.2%, the only sector to decline, with overall capital outflows from consumer staples.
2. Utilities -0.42%, a defensive sector that underperformed the broader market, with capital flowing into growth stocks.
3. Energy Sector Slightly Flat: Pressured by overnight oil price declines; Woodside and Santos were under pressure, and refining stock Ampol weakened; although the sector index did not fall sharply, there was significant divergence among individual stocks.
Technical Analysis:
The Australian ASX 200 index closed at 9,145.8 on Tuesday, +126.5 points, {1.40}, a five-month high, marking its third consecutive day of gains, and is only 57 points away from the February record high of 9202.9. Expectations of easing tensions in the Middle East, a decline in international oil prices, and a surge in US stocks overnight led to a broad recovery in risk appetite. In Australia: June personal consumption rose 0.8% month-on-month, significantly exceeding expectations, indicating strong economic data; the banking sector was favored by institutions, with funds flowing into heavyweight sectors. Market-wise, there was a broad-based rally, with 238 stocks rising and only 47 falling, indicating a clear bullish advantage. The daily chart shows a large bullish candle closing above all short-term moving averages, clearly indicating a bullish trend; the RSI is rising, not yet severely overbought, but approaching high levels, making a pullback likely near new highs.
Wednesday Scenario: Optimistically, overnight strength in overseas markets could lead to a direct test of 9200; if volume increases and 9210 is firmly established, the target could reach 9350. Neutrally, a pullback is expected near 9200, with the market likely to consolidate within the 9050-9150 range. On the pessimistic side, with weakening external factors and the 9200 resistance level proving effective, a break below 9050 would likely lead to a pullback to the key support level of 8940.
Trading Strategy:
The following are technical trading ideas only and do not constitute investment advice. Leveraged trading may result in losses exceeding the principal.
Bullish Strategy:
1. Buy on Pullback: Consider a long position if the price retraces and stabilizes within the 9050-9070 support range; place a stop-loss below 8930; first target is 9200, with a further target of 9340-9350 if it breaks through.
2. Buy on Breakout: Enter a long position only if the price breaks and holds above 9210 with significant volume; stop-loss at 9140; target around 9340.
It is not recommended to chase the price directly in the 9180-9200 resistance zone, as the risk-reward ratio for attempting to reach new highs here is very poor.
Short Selling Strategy (Only for Playing the Retracement to Resistance Levels)
If the price tests the 9190-9210 area and shows clear signs of stalling with a long upper shadow candlestick, a small short position can be initiated to play the pullback; stop loss above 9240; target 9070-9050 support.
The current overall trend is upward; shorting is only for short-term play and should not be taken as a medium-term strategy with heavy positions.
Key Risk Warnings:
Geopolitical Risk: The Middle East situation is volatile. If the conflict escalates again, a rebound in oil prices will suppress global risk assets, and the ASX200 will quickly retreat.
Historical High Selling Pressure: 9200 is an important psychological and technical historical high, with a large number of trapped positions. A rapid profit-taking pullback is highly likely after a surge.
External Linkage Risk: The ASX closely follows the performance of US stocks. A significant pullback in US stocks will directly drag down the opening of ASX.
Domestic Data Risk: This week's China-Australia trade data release; weaker-than-expected data will put pressure on resource-heavy sectors.
Shanghai Composite Index
Basic Market Overview:
On Tuesday, the Shanghai Composite Index rose 0.3% to close at 3,822.3 points, while the Shenzhen Component Index jumped 3.25% to 13,885.7 points, as investors snapped up artificial intelligence and semiconductor stocks after a sharp sell-off. These sectors were boosted by renewed optimism about China's technological development, with DeepSeek's low-cost AI model and Alibaba's latest AI announcement bolstering investor sentiment. Leading gainers included Cambricon Technologies (4.88%), SMIC (3.95%), InnoLight Technology (13.24%), Accelink Technologies (13.68%), and NAURA Technology Group (7.13%).
In contrast, financial stocks such as ICBC (-3.77%), Agricultural Bank of China (-4.06%), and China Construction Bank (-3.35%) came under pressure. Domestically, investors are focused on upcoming key economic data, including trade and inflation figures, following the central bank's reaffirmation of its commitment to supporting the economy through moderately loose monetary policy, ample liquidity, and balanced credit growth.
Sector Performance:
Leading Sectors & Representatives
1. Telecommunications (CPO/Optical Modules, Computing Hardware): The strongest theme in the market, with computing power leasing and optical communications experiencing a collective surge.
Representatives: Guangku Technology, Tianfu Communication, Zhongji Xuchuang, Xin Yisheng
2. Electronics (PCB, Semiconductor Components): Oversold rebound, with many stocks hitting the daily limit/20cm limit.
Representatives: Hudian Technology, Shennan Circuits, Yuanjie Technology
3. Pharmaceuticals CRO/Innovative Drugs: WuXi AppTec's performance catalyst drives the sector's strength.
Representatives: WuXi AppTec, Kailaiying
Leading Sectors & Representatives
1. Banking: Heavyweight sectors collectively decline, with the four major banks falling by more than 3%, suppressing the Shanghai Composite Index.
Representatives: ICBC, CCB
2. Insurance, Liquor, Automobile, Highway and Railway Transportation: Defensive/consumer stocks weaken, with funds flowing out of heavyweight blue chips and into growth sectors.
Representatives: China Pacific Insurance, some leading liquor stocks, leading automobile manufacturers
Technical Analysis
The Shanghai Composite Index closed at 3822.28 points, up 0.33%, with an intraday high of 3831.94 and a low of 3799.52. Shanghai's single-day turnover reached 1008.383 billion yuan, an increase from the previous day. Total turnover in both Shanghai and Shenzhen markets reached 2.21 trillion yuan, a significant increase. Market characteristics: Shanghai was weaker than Shenzhen, with the Shanghai Composite Index fluctuating, while the ChiNext and STAR Market 50 rose sharply. The yellow line was far above the white line, indicating strong profit-making opportunities for small-cap growth stocks, while large financial stocks weakened. Funds flowed out of banks and consumer goods (especially liquor) and into the communications, semiconductor, component, PCB, and CXO sectors. Technically, the index closed with a small positive candle, recovering after testing support near 3800 during the session, and closing above the 60-day moving average. This is a continuation pattern within a range, not a topping signal, and the index is expected to consolidate within the 3798-3832 range in the short term. In terms of capital flow, the number of rising stocks outnumbered those in both Shanghai and Shenzhen stock exchanges, with an increase in the number of stocks hitting their daily limit, indicating a recovery in market sentiment. Northbound capital flows remained generally stable, with domestic capital flowing back into growth stocks, while heavyweight sectors saw significant outflows.
Wednesday's Market Scenario Prediction:
Neutral Scenario (Highest Probability ≈ 70%): A slight upward move in the morning testing the 3830-3840 range, followed by consolidation to digest profit-taking, with the overall trading range between 3800 and 3840. Sector differentiation is expected, with rotation within growth stocks and continued consolidation in heavyweight stocks.
Optimistic Scenario (≈ 20%): Increased trading volume in both Shanghai and Shenzhen stock exchanges, with heavyweight sectors taking the lead, pushing the index above 3850 and opening up upward potential.
Weak Scenario (≈ 10%): Short-term profit-taking in growth stocks is concentrated, causing the index to retrace to the 3788-3800 support range. The strength of support after the retracement will be observed.
Trading Strategy:
Trading Strategy (Shanghai Composite Index Perspective, Index-level Analysis Only, Not Individual Stock Strategy)
Short-Term (1-3 Trading Days)
1. For Holders
• If the index stabilizes above 3800, continue holding; if it rallies towards the 3845-3850 resistance zone, consider partially reducing positions to lock in profits on short-term gains.
• If it breaks below 3800, reduce positions to mitigate the risk of a pullback.
2. Observing/Preparing to Enter
• Avoid chasing short-term themes with sharp rises; prioritize waiting for a pullback to the 3800-3805 support level, observe the support level, and then consider buying on dips.
• If it breaks through 3850 with significant volume, then follow the trend; do not chase rallies without volume.
3. Sector Focus
• Main Themes: Growth sectors such as semiconductors, communication hardware, and CXOs are showing signs of divergence. Focus on leading stocks and avoid high-flying small-cap stocks that have experienced continuous surges.
• Defense: Banks and liquor stocks are experiencing short-term capital outflows; it's not advisable to rush into bottom-fishing.
Key Risk Warnings:
Sector rotation is rapid, and high-flying themes are highly volatile. Chasing highs can easily lead to significant pullbacks.
If heavyweight banks continue to decline, it will drag down the Shanghai Composite Index and limit the market's rebound potential.
External market and policy news can change short-term trends at any time. The above is only a technical analysis and does not constitute investment advice.
Disclaimer: The information contained herein (1) is proprietary to BCR and/or its content providers; (2) may not be copied or distributed; (3) is not warranted to be accurate, complete or timely; and, (4) does not constitute advice or a recommendation by BCR or its content providers in respect of the investment in financial instruments. Neither BCR or its content providers are responsible for any damages or losses arising from any use of this information. Past performance is no guarantee of future results.
More Coverage






Risk Disclosure:Derivatives are traded over-the-counter on margin, which means they carry a high level of risk and there is a possibility you could lose all of your investment. These products are not suitable for all investors. Please ensure you fully understand the risks and carefully consider your financial situation and trading experience before trading. Seek independent financial advice if necessary before opening an account with BCR.
BCR Co Pty Ltd (Company No. 1975046) is a company incorporated under the laws of the British Virgin Islands, with its registered office at Trident Chambers, Wickham’s Cay 1, Road Town, Tortola, British Virgin Islands, and is licensed and regulated by the British Virgin Islands Financial Services Commission under License No. SIBA/L/19/1122.
Open Bridge Limited (Company No. 16701394) is a company incorporated under the Companies Act 2006 and registered in England and Wales, with its registered address at Kemp House, 160 City Road, London, England, EC1V 2NX. Open Bridge Limited acts solely as a payment processor for BCR Co Pty Ltd and does not provide any financial, trading, or investment services on its behalf. Open Bridge Limited's role is limited to payment processing.


 English
 简体中文
简体中文
 繁體中文
繁體中文
 Bahasa
Melayu
Bahasa
Melayu
 Tiếng
Việt
Tiếng
Việt
 ไทย
ไทย
 日本語
日本語
 한국어
한국어
 ភាសាខ្មែរ
 español