0
US Dollar Index
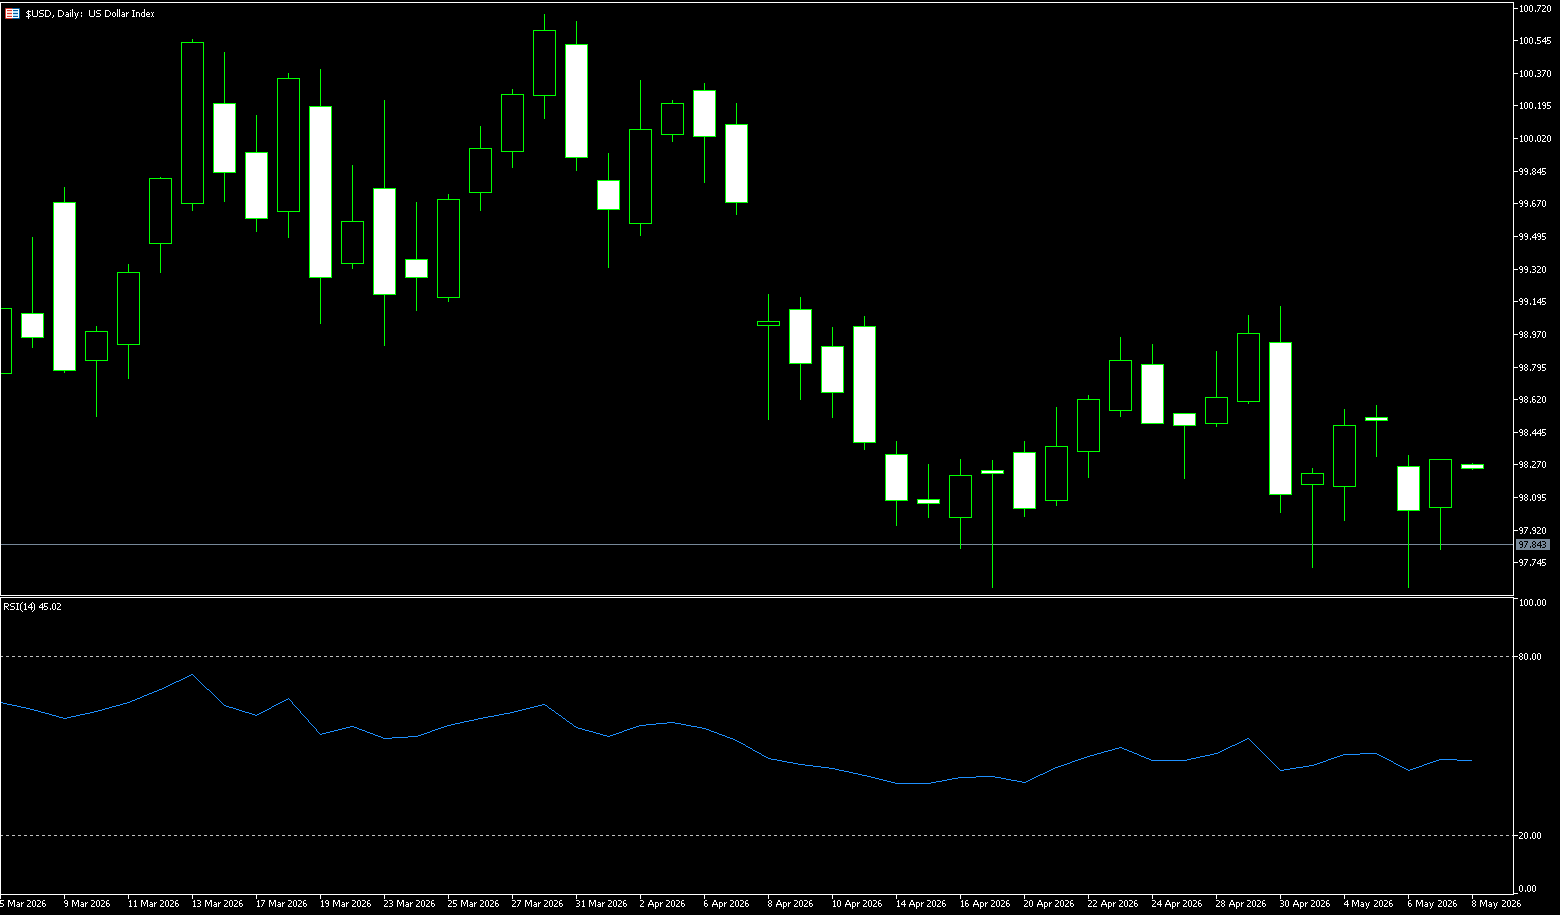
The US dollar index climbed to 99.45 on Tuesday, reaching its highest level in six weeks, as concerns about accelerating inflation intensified. War-related energy price pressures have increased inflation risks, with the earlier surge in oil prices seen as reinforcing market expectations that the Federal Reserve may need to maintain higher interest rates for a longer period or even further tighten policy. Although oil prices have retreated somewhat after reports that NATO is considering measures to help ensure the safety of shipping in the Strait of Hormuz, and if the strait remains closed in July, energy costs remain high enough to keep inflation concerns under scrutiny. Market pricing has shifted dramatically, with traders now expecting the Fed's next move to be a rate hike before the end of the year, compared to earlier expectations of multiple rate cuts in 2026. Investors are now awaiting the latest Federal Open Market Committee meeting minutes and preliminary US Purchasing Managers' Index data for further insight into the outlook for monetary policy and economic activity.
The US dollar index is currently hovering near 99, a result of a highly contentious struggle between bulls and bears. On the upside, there's support from rising US Treasury yields and persistent inflation providing an interest rate premium; on the downside, there's a decline in safe-haven demand due to rising expectations of peace talks, and the economic downside risks accumulated by high interest rates. The biggest risk in the current market isn't a single unexpected data point, but rather the simultaneous exertion of geopolitical and monetary policy forces in the same direction—that would be the moment a true trend-driven market move begins. During the Asian session, the US dollar index rose to around 99.45, its highest level in over five weeks. Overall, the strong dollar trend is unlikely to change in the short term, but caution is advised at higher levels regarding profit-taking and event-driven reversals. Resistance lies in the 99.78 (70-week moving average) - 100.00 (psychological level) range, while support is around 99.00 (psychological level) and 98.55 (200-day simple moving average).
Today, consider shorting the US Dollar Index at 99.40, with a stop-loss at 99.50 and targets at 99.00 and 98.90.
WTI Crude Oil
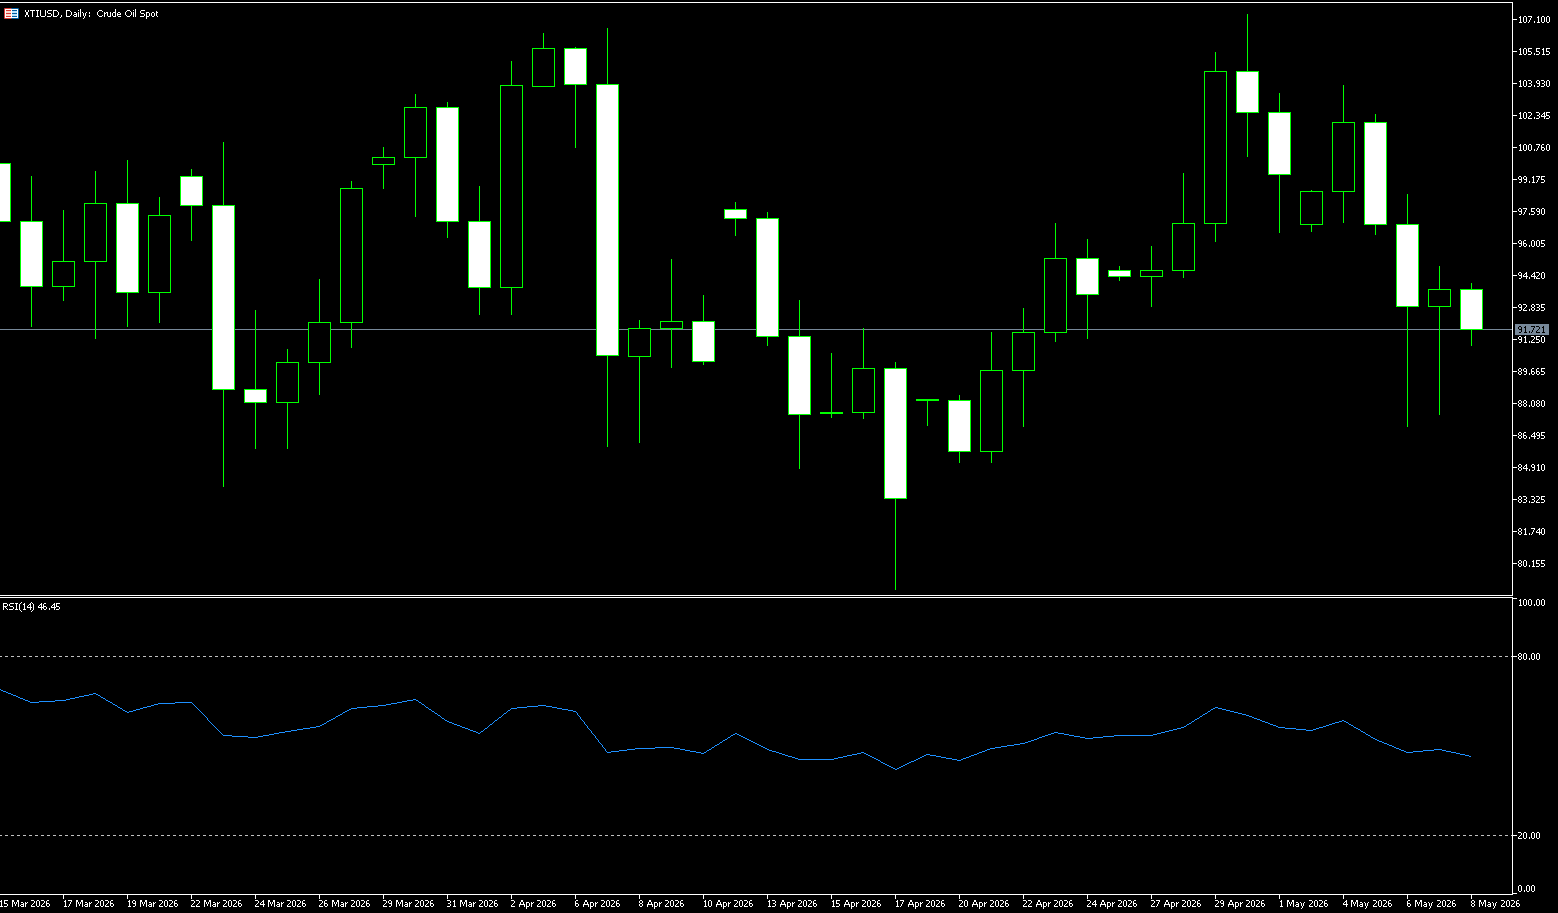
WTI crude oil rose for the fourth consecutive day on Tuesday to $103.35 per barrel, giving back some recent gains after President Trump said he had canceled a planned military strike against Iran at the urging of Gulf allies, fueling optimism that negotiations might resume. Trump said Saudi Arabia, Qatar, and the UAE asked him to "hold back," adding that serious negotiations were underway, although Tehran has not confirmed this claim. Oil prices have been rising over the past week as US-Iran peace talks stall and shipping in the Strait of Hormuz remains effectively closed. Tehran's nuclear program and the dual blockade of this vital waterway continue to be major obstacles to a breakthrough in negotiations. Meanwhile, the US issued a new waiver allowing the sale of Russian crude oil and petroleum products already loaded on tankers.
From a technical perspective, the daily chart for WTI crude oil still shows a clear bullish trend. After oil prices quickly broke through the psychologically key resistance level of $100, market buying momentum has further strengthened, and the overall trading range has clearly shifted upwards. On the daily chart, the $100 level has gradually transformed into a significant support area, while the $104-$107 range constitutes key short-term resistance. If the situation in the Middle East deteriorates further, oil prices may continue to challenge the previous high of $113.28. Technically, the daily MACD maintains a high-level golden cross structure, and although the RSI indicator has entered overbought territory, no obvious top divergence has yet appeared, indicating that the market trend remains bullish. However, with the continuous and rapid rise in oil prices, some short-term funds have begun to show signs of profit-taking at higher levels, and market volatility has significantly increased. If recent inventory data is weak, coupled with a cooling of market risk aversion, a further short-term pullback in WTI to the $100 (psychological level) and the $98.24 (early week low) area cannot be ruled out.
Today, consider going long on crude oil at 103.15, with a stop-loss at 103.0 and targets at 105.00 and 106.00.
Spot Gold
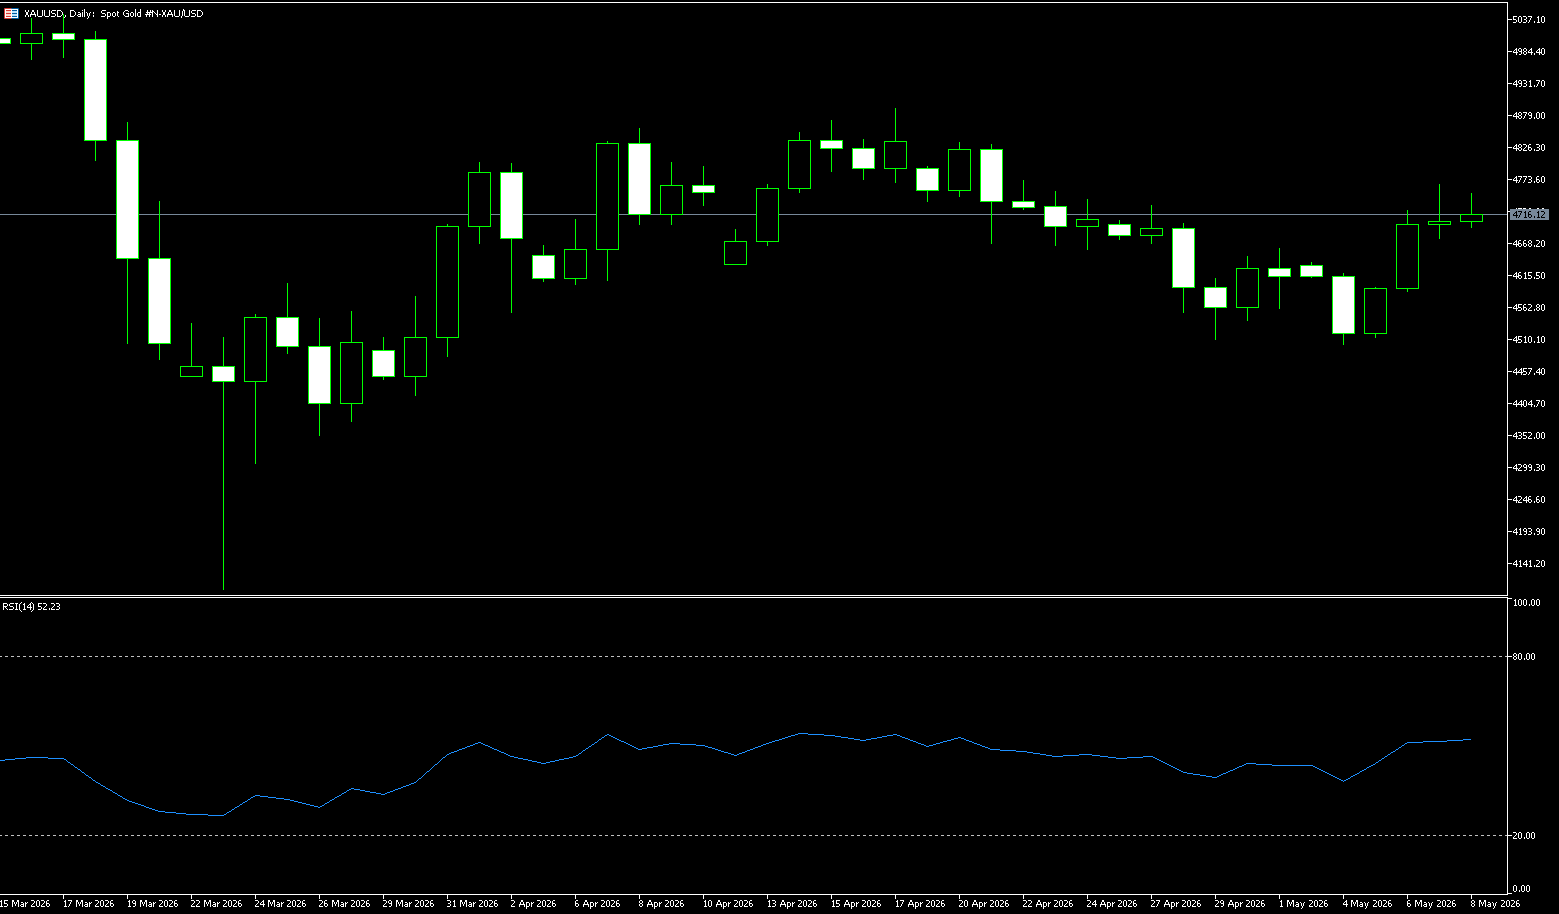
Gold fell below $4,500 per ounce on Tuesday, giving back some of the previous day's gains, as uncertainty surrounding the Middle East conflict and persistent inflation concerns weighed on market sentiment. The market reacted cautiously to President Donald Trump's hints of a possible peace deal with Iran, with investors remaining skeptical about the possibility of a crisis resolution. Gold has been under pressure since the conflict began, with soaring oil prices exacerbating inflation concerns and reinforcing expectations of further central bank rate hikes. Stronger U.S. inflation has also led traders to further reduce their expectations for a Fed rate cut this year, while increasing speculation that the Fed may still raise rates before the end of the year. Investors are now awaiting the latest Federal Open Market Committee meeting minutes and preliminary U.S. Purchasing Managers' Index (PMI) readings for further clues about the outlook for monetary policy and economic activity.
On the daily chart, gold is trading below 4,500, maintaining a short-term bearish bias as it lies below both medium- and long-term moving averages, while the 14-day Relative Strength Index (RSI) is around 37, indicating continued weak momentum. The pair is capped by the 20-day simple moving average near 4,637 and the psychological level of 4,600, suggesting that any rebound may encounter supply pressure as prices remain below this set of overhead resistance zones. On the upside, initial resistance lies at the 20-day simple moving average around 4,637, followed by the 50-day simple moving average near 4,706, an area that needs to be reclaimed to alleviate current downward pressure. Conversely, on the downside, the descending wedge resistance-turned-support level around 4,460 is the first significant downside limit, followed by the 200-day simple moving average near 4,358, where buyers may attempt to prevent further losses should the metal fall further.
Today, consider going long on gold at 4,480, with a stop-loss at 4,474 and targets at 4,530 and 4,540.
AUD/USD
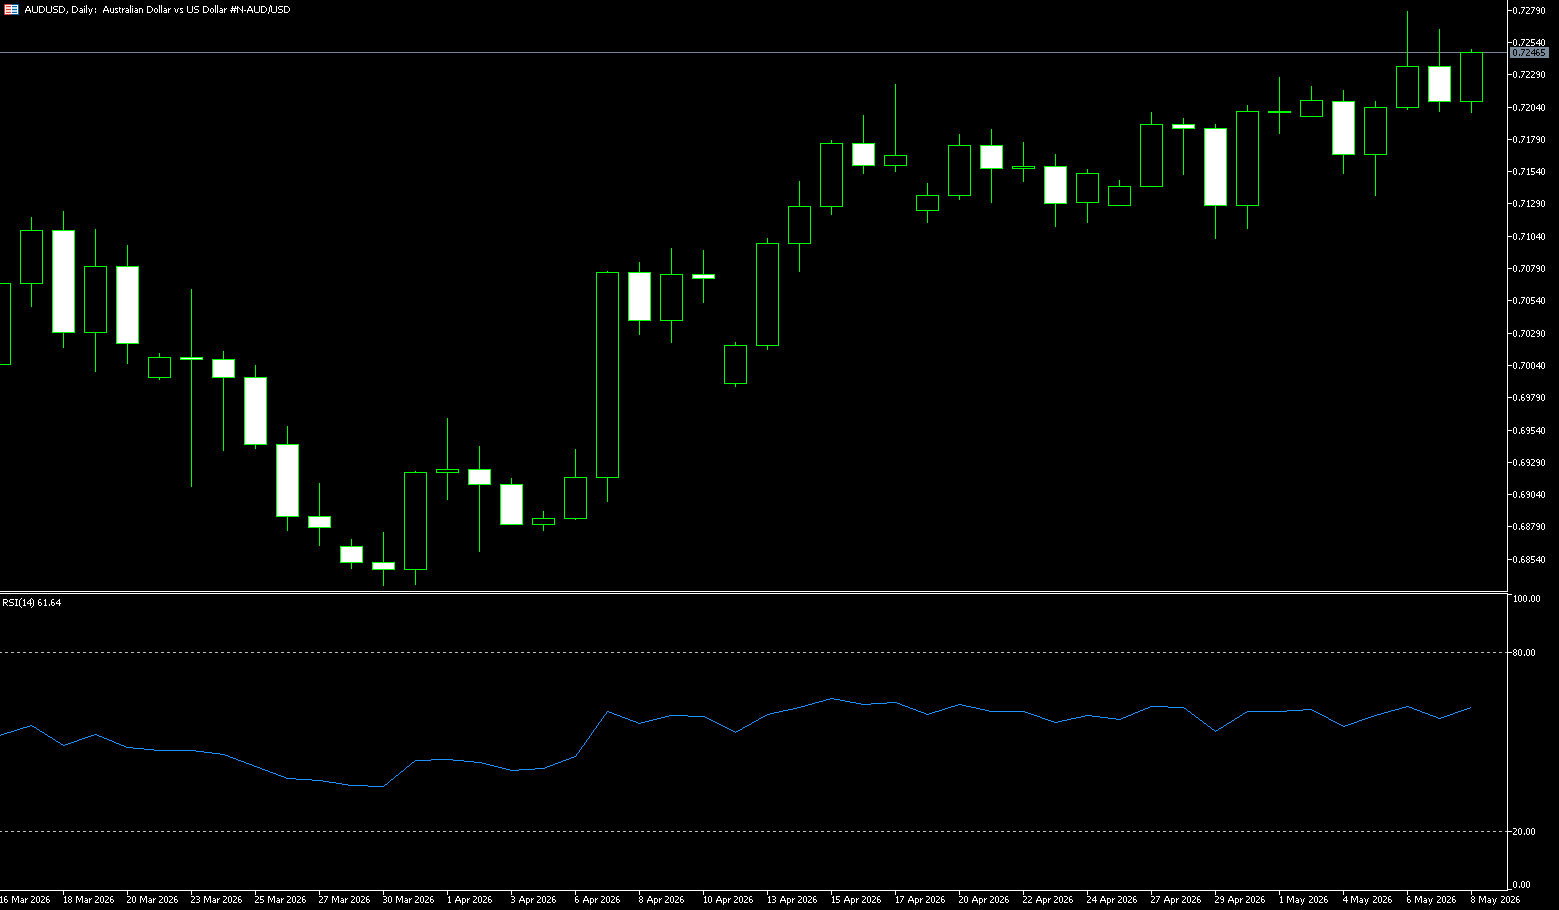
The Australian dollar fell below US$0.71 on Tuesday, reversing gains from the previous session and reaching its lowest level in nearly three weeks, as the Reserve Bank of Australia's (RBA) meeting minutes failed to send a clear hawkish signal on the policy outlook. The minutes of the central bank's May meeting showed that the policy committee believed there was now room to pause further interest rate hikes while remaining focused on preventing rising inflation expectations. The central bank's economists noted that the committee was assessing the cumulative effects of the three cash rate hikes this year, as well as external uncertainties including the ongoing Middle East conflict. A senior economist at the CBA said the market increasingly expects the RBA to keep rates unchanged at its June meeting, with investors anticipating another adjustment to around 4.60%. Domestically, the Westpac-University of Melbourne Consumer Confidence Index rose 3.5% month-on-month in May to 83, rebounding from a two-and-a-half-year low of 80.1 in April.
The Australian dollar found support at 0.7100 in early European trading on Monday and gradually recovered to 0.7180 in the afternoon, benefiting from a weaker US dollar and slightly improved risk sentiment. On the surface, this rebound aligns with the broader bullish narrative for the Australian dollar: a hawkish stance from the Reserve Bank of Australia, high commodity prices, and the global energy shock keeping inflation sticky enough to support another rate hike. However, the problem is that this narrative is already widely known, and the market has fully priced it in. On the daily chart, the Australian dollar is trading at 0.7130 against the US dollar. The pair maintains a short-term bullish bias as the spot price holds above the 50-day simple moving average at 0.7092 and 0.7100, with the next level at the 89-day simple moving average at 0.7050; despite the pullback from last week's highs, the larger uptrend structure remains intact. The Stochastic Relative Strength Index (RSI) is around 43.89, having retreated from overbought territory, suggesting a slowdown in upward momentum, but not yet a reversal. Therefore, the upside target is 0.7189 (20-day simple moving average), followed by 0.7200 (psychological level).
Consider going long on the Australian dollar today at 0.7095, with a stop loss at 0.7085 and targets at 0.7150 and 0.7160.
GBP/USD
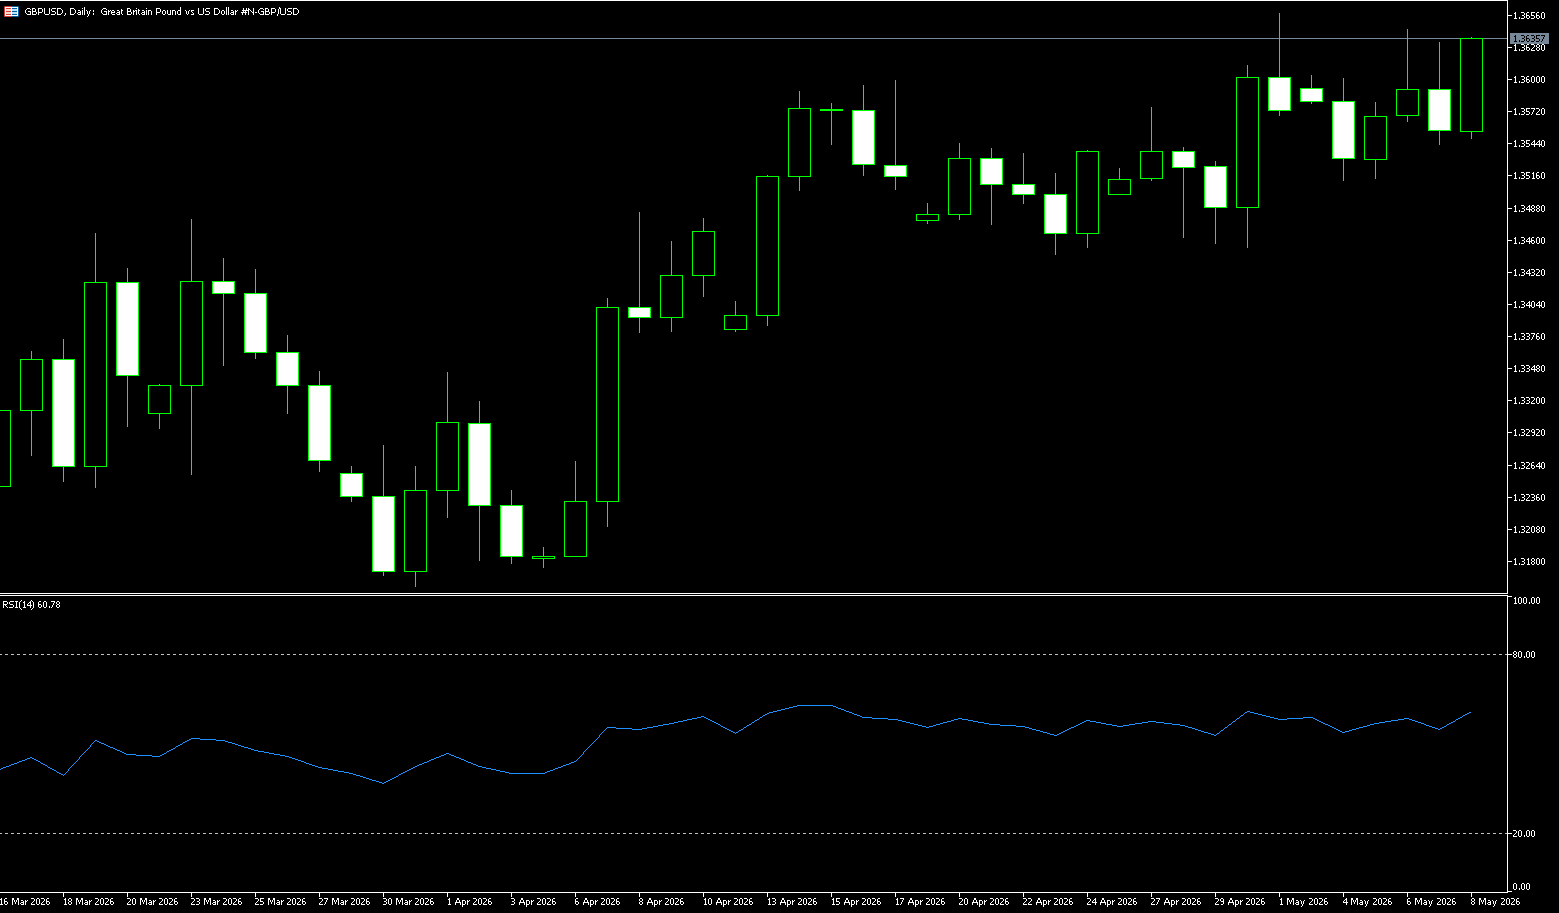
The pound/dollar pair fell to near 1.3400 during Tuesday's European trading session. The pound weakened against the dollar due to political turmoil in the UK. Prime Minister Keir Starmer faces a major leadership crisis following the disappointing results of the May 7 local elections, triggering a wave of resignations among senior government officials and significant market volatility. UK government bond yields surged to a 28-year high due to fiscal concerns, putting some selling pressure on the pound. The International Monetary Fund (IMF) raised its UK economic growth forecast for this year on Monday but warned that further "domestic uncertainty" could dampen spending and investment amid political instability surrounding the government. On the dollar front, stronger-than-expected US inflation data fueled hawkish comments from the Federal Reserve, boosting the dollar. According to the CME FedWatch tool, traders in the federal funds futures market expect a 35.0% probability of a 25 basis point rate hike by the Fed by the end of the year.
On the daily chart, GBP/USD is trading at 1.3400. The pair is slightly above a tight cluster of 50-day, 100-day, and 200-day simple moving averages, which together provide dynamic resistance nearby. However, a clear bullish trend is not yet apparent as the price remains capped by a descending trendline formed from previous highs, referenced by the breakout area near 1.3608. The Relative Strength Index (RSI) (14) is around 46, slightly below the neutral 50, suggesting a lack of strong directional momentum and an overall neutral bias, with a slight downside risk if the moving average support breaks. On the upside, initial resistance lies in the descending trendline resistance zone around 1.3608; a daily close above this zone would help remove overall downward pressure and open the way for a more compelling rebound to the 1.3650 level. On the downside, 1.3380 (the low of April 12) provides immediate support; a close below this zone would expose the pair to renewed selling pressure and could potentially lead to a pullback to the recent low of 1.3315.
Consider going long on GBP/USD today at 1.3388, with a stop-loss at 1.3375 and targets at 1.3435 and 1.3445.
USD/JPY
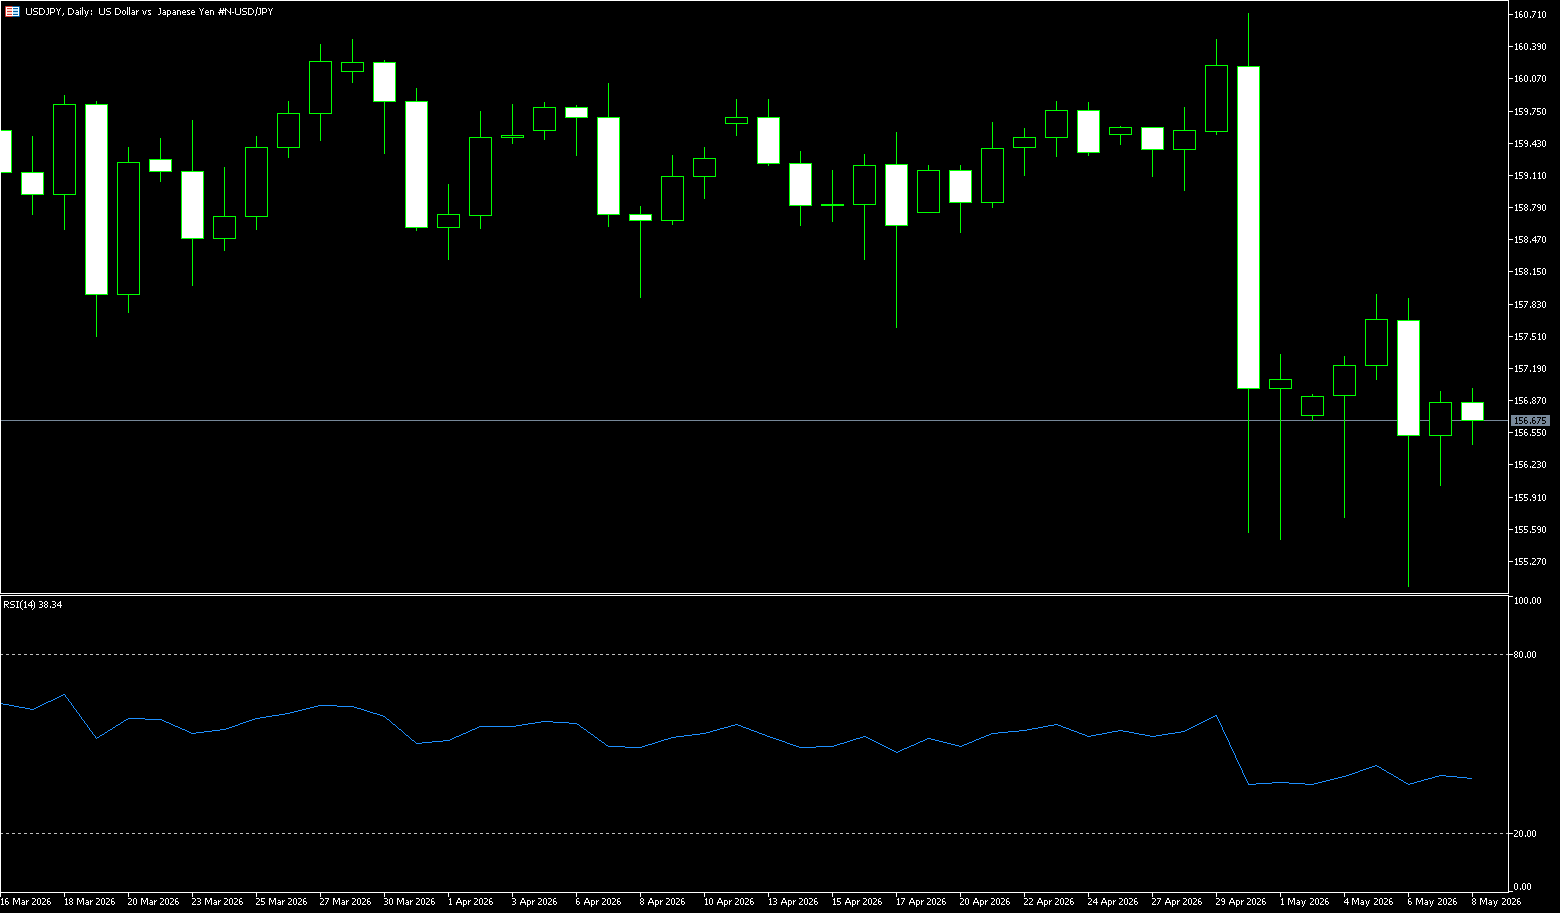
USD/JPY has shown a positive bias for the seventh consecutive day, currently near its highest level in nearly three weeks, with bulls attempting to extend the rally above 159.00. The dollar has regained upward momentum amid continued geopolitical uncertainty and market bets that the Federal Reserve will raise interest rates before the end of the year. Furthermore, economic concerns stemming from the Middle East conflict weakened the yen and provided a tailwind for the USD/JPY pair. Despite optimistic first-quarter GDP figures from Japan and concerns about intervention, the upward momentum in prices appears unaffected, suggesting the path of least resistance for spot prices is upward. Meanwhile, the yen is gradually approaching the key 160 level against the dollar, following intervention by Japanese authorities in late April to stabilize the currency. Investors remain closely watching for possible further intervention, as several Japanese officials have indicated there may be no limit to the frequency with which authorities intervene in the foreign exchange market.
From a technical perspective, USD/JPY maintains a short-term bullish bias above the 158.56 confluence range, which includes the 200-period simple moving average on the 4-hour chart and the 61.8% Fibonacci retracement level of the April-May decline. The 14-day Relative Strength Index (RS) is at 73.34, in overbought territory, suggesting that upside potential may have been excessive, while the Moving Average Convergence Divergence (MACD) has slipped slightly into negative territory. Momentum indicators suggest that while price action remains supported, upward momentum is beginning to weaken. Therefore, any subsequent rise may encounter immediate resistance at the 78.6% simple moving average retracement level of 159.49, followed by the psychological level of 160.00 and the cycle high area of 160.72. On the downside, the converging range of 158.56 may continue to provide initial support. If this level is decisively broken, the target will be the 50% Fibonacci retracement level of 157.86, with further downside support at 157.18 and 156.35.
Consider shorting the US dollar today at 159.20, with a stop loss at 159.35 and targets at 158.40 and 158.30.
EUR/USD
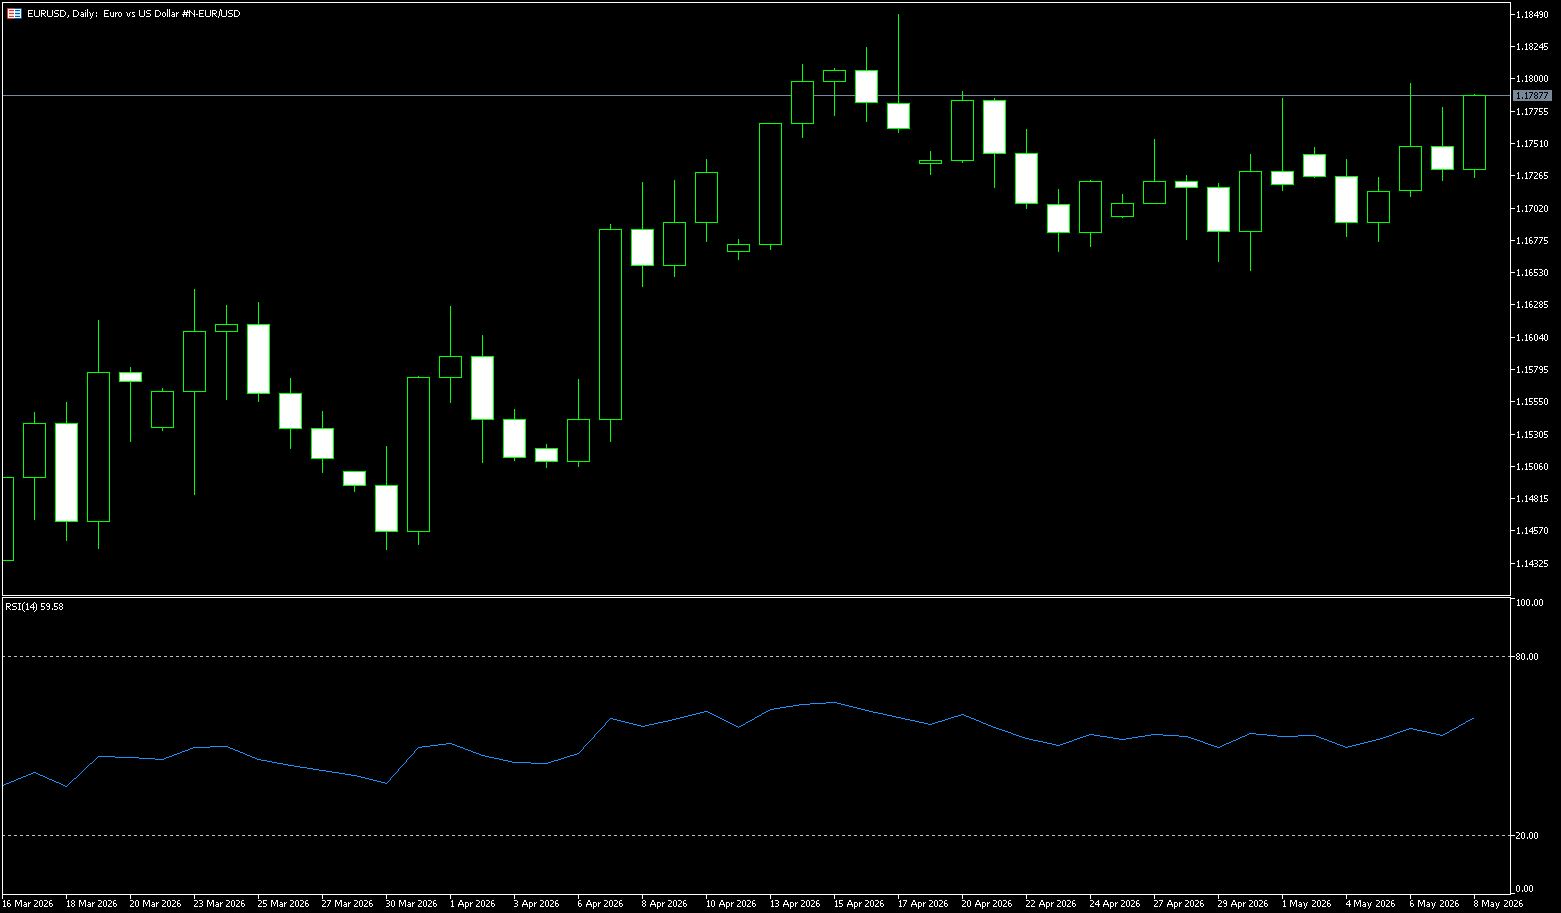
The euro/dollar weakened near 1.1600 in Tuesday's European session. The euro weakened against the dollar due to continued uncertainty surrounding the Middle East situation surrounding Iran. European Central Bank Chief Economist Philip Lane is expected to speak later in the day. US President Donald Trump stated that he postponed a planned military strike against Iran on Tuesday at the request of the leaders of Qatar, Saudi Arabia, and the UAE, citing "serious negotiations underway." However, uncertainty remains high, and Trump also warned that the US is prepared for a "full-scale attack on Iran" if an acceptable agreement is not reached. Signs of continued conflict in the Middle East could boost the safe-haven dollar and exert downward pressure on the major currency pair in the short term. On the other hand, hawkish comments from European Central Bank policymakers may provide some support for the euro. ECB Governing Council member Yannis Stournaras stated over the weekend that a moderate ECB rate hike could curb inflation without harming the economy.
This week, the euro continued its weakness against the dollar, trading around 1.1600, and is on track for its sixth consecutive day of decline. The core reason for the euro's pressure is the broad-based strengthening of the dollar—the Federal Reserve's shift to a more aggressive anti-inflationary policy stance, coupled with safe-haven demand stemming from the ongoing geopolitical conflict in the Middle East, has jointly pushed up the dollar's exchange rate. From a technical perspective, although the 14-day Relative Strength Index (RSI) has turned bearish, EUR/USD may still consolidate further. Currently, the spot price is supported by the 200-day, 100-day, and 20-day simple moving averages, located at 1.1681, 1.1703, and 1.1707 respectively. A decisive break above this area would pave the way for a challenge of the downtrend resistance line around 1.1750/1.1760, potentially targeting the 1.1800 level. On the downside, a break below 1.1600 for EUR/USD is expected to test the swing low of 1.1505 from April 6th.
Today, consider going long on EUR/USD at 1.1595, with a stop-loss at 1.1585 and targets at 1.1640 and 1.1650.
Disclaimer: The information contained herein (1) is proprietary to BCR and/or its content providers; (2) may not be copied or distributed; (3) is not warranted to be accurate, complete or timely; and, (4) does not constitute advice or a recommendation by BCR or its content providers in respect of the investment in financial instruments. Neither BCR or its content providers are responsible for any damages or losses arising from any use of this information. Past performance is no guarantee of future results.
More Coverage


Risk Disclosure:Derivatives are traded over-the-counter on margin, which means they carry a high level of risk and there is a possibility you could lose all of your investment. These products are not suitable for all investors. Please ensure you fully understand the risks and carefully consider your financial situation and trading experience before trading. Seek independent financial advice if necessary before opening an account with BCR.
BCR Co Pty Ltd (Company No. 1975046) is a company incorporated under the laws of the British Virgin Islands, with its registered office at Trident Chambers, Wickham’s Cay 1, Road Town, Tortola, British Virgin Islands, and is licensed and regulated by the British Virgin Islands Financial Services Commission under License No. SIBA/L/19/1122.
Open Bridge Limited (Company No. 16701394) is a company incorporated under the Companies Act 2006 and registered in England and Wales, with its registered address at Kemp House, 160 City Road, London, City Road, London, England, EC1V 2NX. This entity acts solely as a payment processor and does not provide any trading or investment services.

 English
 简体中文
简体中文
 繁體中文
繁體中文
 Bahasa
Melayu
Bahasa
Melayu
 Tiếng
Việt
Tiếng
Việt
 ไทย
ไทย
 日本語
日本語
 한국어
한국어
 ភាសាខ្មែរ
 español