


0
Currency & Commodity Analysis:
US Dollar Index
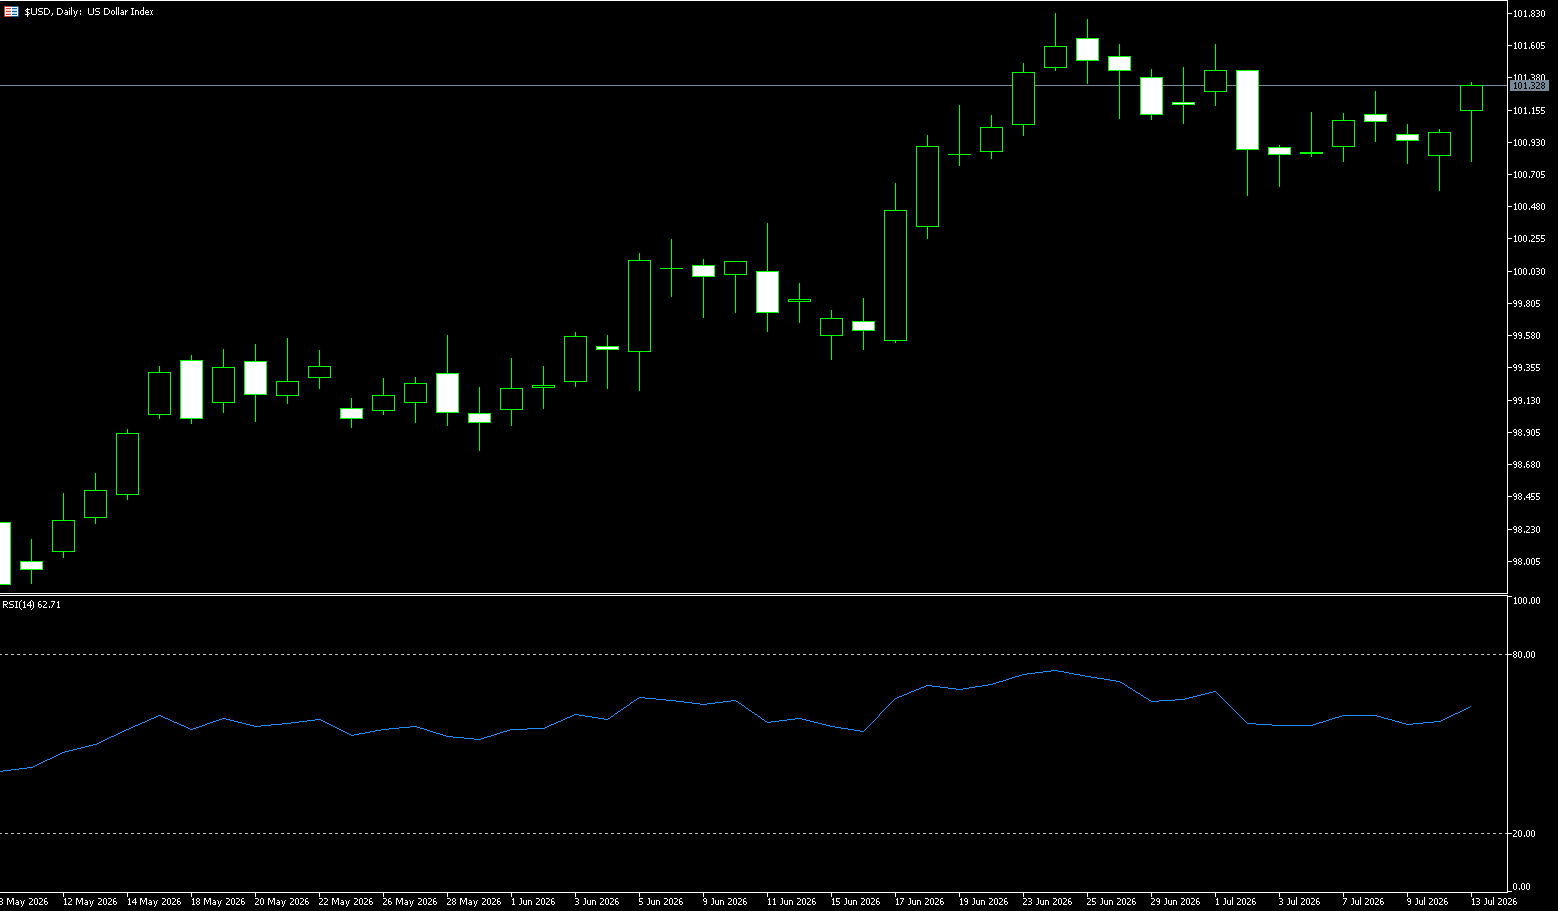
The US dollar index rose slightly to 101.25 on Monday, remaining close to July levels, as investors assessed the situation in the Middle East and the outlook for US monetary policy. A new round of military clashes between the US and Iran, along with conflicting reports about whether the Strait of Hormuz is open to shipping, drove up oil prices. The market is also awaiting this week's US Consumer Price Index (CPI) and Producer Price Index (PPI) reports for further insight into inflation trends, as well as Federal Reserve Chairman Walsh's testimony before Congress for more clues about the central bank's policy path. Traders currently expect at least one Fed rate hike this year, with a roughly 71% probability of a September rate hike. The US dollar depreciated against the euro but appreciated against the yen, as the yen came under pressure after a Reuters report that Japan had no immediate plans to change the asset allocation of its national pension fund.
The daily chart shows that the US dollar index previously rebounded from 99.46 to 101.8000, currently around 101.20, still above the midline of the Bollinger Bands at 100.72, and not far from the upper band at 101.95. The 100.55-100.60 range forms a dense area of recent pullback lows, while the area around 100.72 coincides with the midline and short-term market costs. The index remains above the midline, and the structure is still considered a high-level consolidation after an upward move. However, the MACD indicator's DIFF is 0.3049, lower than the DEA at 0.3956, and the histogram is -0.1813, indicating that the price trend has not yet been broken, but marginal momentum has clearly cooled. 101.50 and 101.80 are previous high resistance levels. The real information at present is not the immediate price movement after the data release, but whether the trading range can expand and whether the closing price can break out of the 100.55-101.80 consolidation range.
Today, consider shorting the US Dollar Index at 101.40, with a stop-loss at 101.50 and targets at 100.90 and 100.80.
WTI Crude Oil
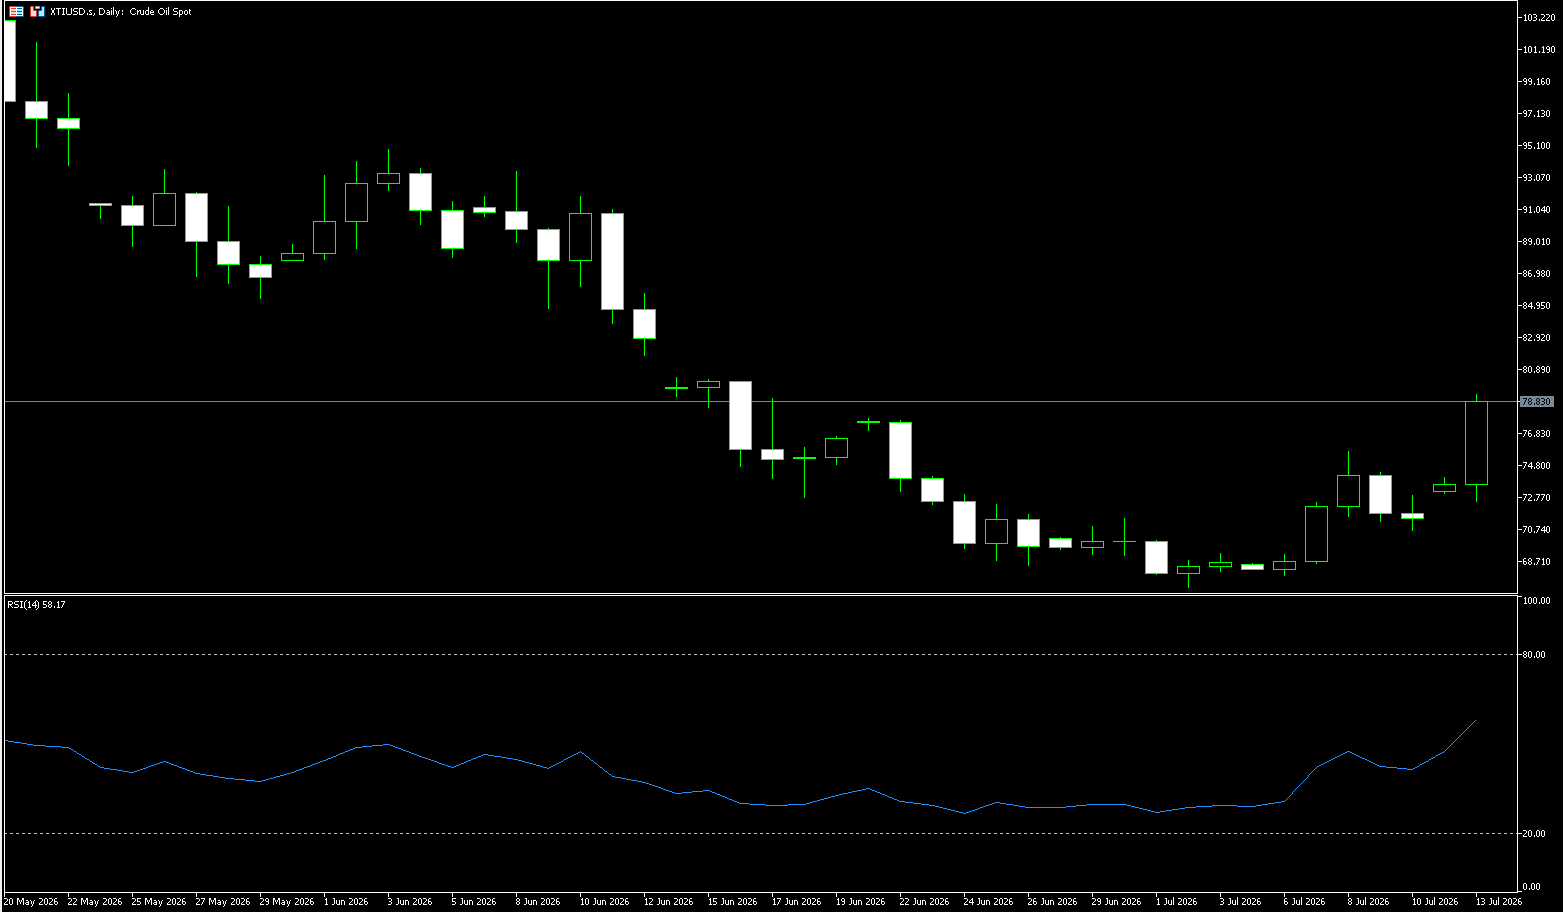
Crude oil prices rose more than 8% on Monday to $77.80 a barrel, the highest in nearly a month, after President Trump said the U.S. would reimpose a blockade on Iranian ships passing through the Strait of Hormuz and seek to charge fees on other cargoes transiting the waterway. These comments came after escalating tensions between Washington and Tehran, with attacks on regional energy infrastructure exacerbating supply concerns. Trump stated that the Strait of Hormuz would remain open regardless of Iranian involvement, and that the US would impose a 20% fee on other cargo passing through this crucial passage. At current prices, such a fee would amount to approximately $32 million for a supertanker, significantly higher than previous Iranian transit fees, which reached up to $2 million. The US launched strikes against Iran targeting shipping capacity, while Tehran retaliated against US allies, including attacks on Kuwaiti offshore drilling platforms. Meanwhile, OPEC lowered its 2026 oil demand growth forecast to 800,000 barrels per day.
This week, the market will also focus on US inflation data, API and EIA crude oil inventory reports, and speeches by Federal Reserve officials. Continued weak US economic data could strengthen market expectations for monetary policy adjustments, providing some support for oil prices from the demand side; however, inventory changes and developments in the Middle East will remain the core factors influencing international oil price fluctuations. From a technical perspective, WTI crude oil maintains a slightly bullish trend on the daily chart, with prices regaining ground near major moving averages. Short-term bullish momentum has recovered somewhat, and the MACD indicator remains near the zero line with signs of a potential golden cross, indicating gradually improving market momentum. If oil prices fail to effectively break through the resistance levels near $75.73 (last week's high) and $76.95 (the 160-day moving average), they may continue to consolidate at high levels in the short term. A successful breakout could open up further upside potential to $80.00 (a psychological level) and $82. On the downside, oil prices may retest $75.73 (last week's high) or even lower to the $70 (psychological support) level.
Today, consider going long on crude oil at 77.75, with a stop-loss at 77.60 and targets at 80.60 and 81.00.
Spot Gold
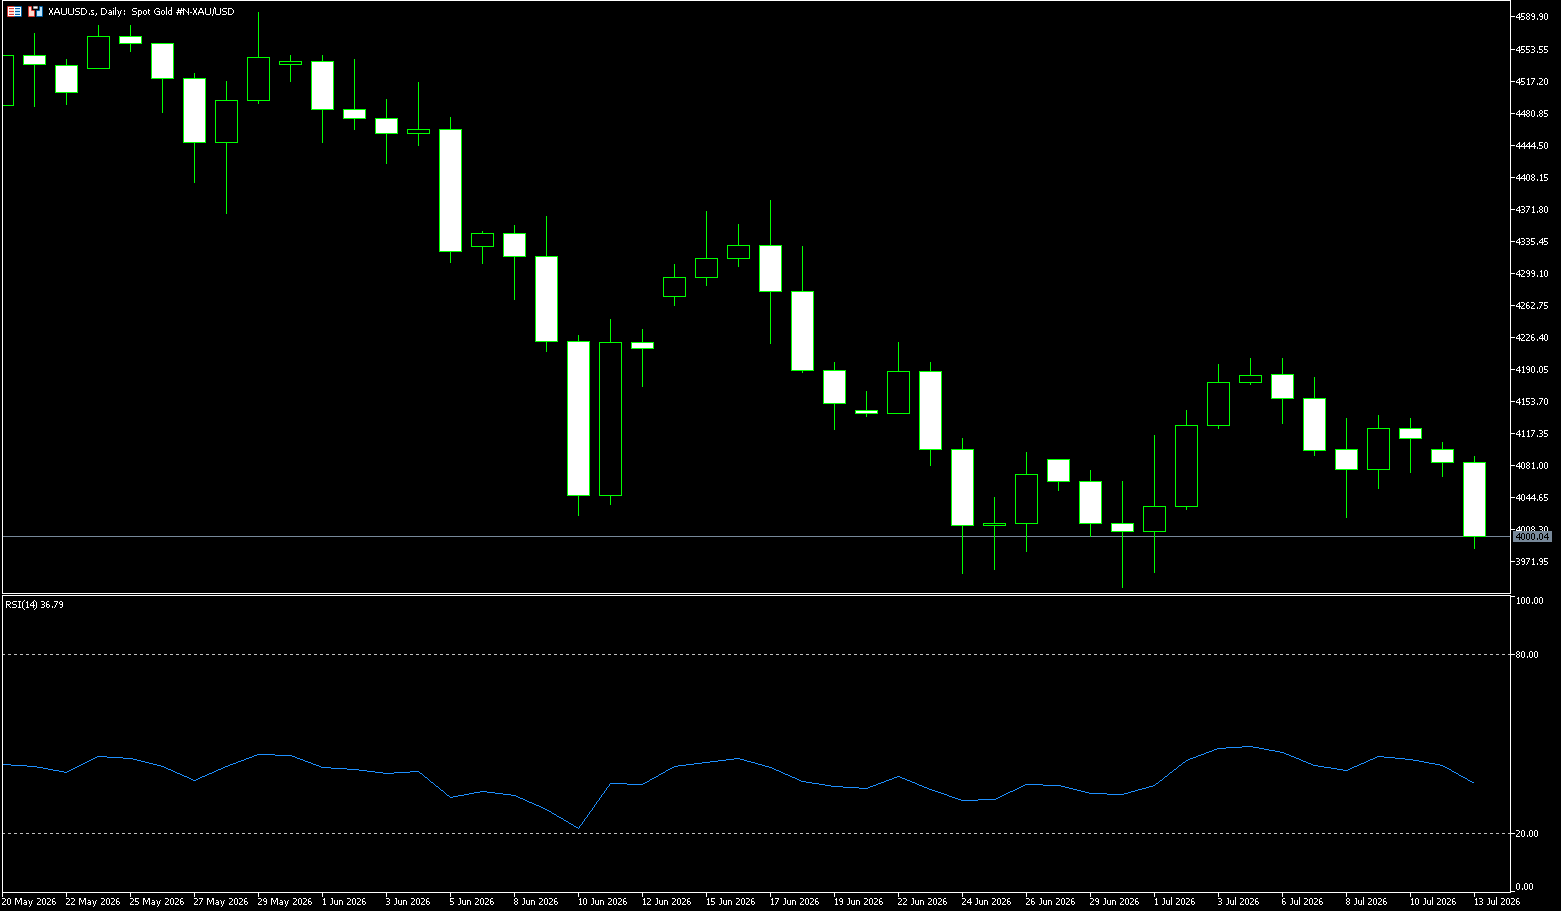
Gold fell more than 2% on Monday to $4,010 an ounce, marking its second consecutive day of losses, as escalating conflict in the Middle East heightened inflation concerns and reinforced expectations that US interest rates will remain high for an extended period. Over the weekend and on Monday, US and Iranian forces conducted intense missile and drone attacks. Tehran claimed to have targeted US military facilities in the Gulf region and closed the Strait of Hormuz, pushing oil prices up by more than 4%. In response, investors increased their bets on a Federal Reserve rate hike, with the market now expecting a near 70% probability of a September rate increase. Meanwhile, Federal Reserve Chairman Kevin Warsh will deliver his first monetary policy testimony to Congress on Tuesday, and the market will closely analyze his remarks for further policy signals. In addition, key US economic data will be released this week, including the June Consumer Price Index and retail sales figures.
Gold prices narrowed their intraday trading range to below $4,100/oz, holding above the key support zone of $4,021 (last week's low) - $4,000 (a psychological level) to avoid a sharp drop. However, the rebound momentum is severely weak, failing to break through the core resistance zone of $4,184 (30-day moving average) - $4,200 (a psychological level), which has become the core bottleneck for this round of gold price rebound. Gold prices have repeatedly tested the $4,200 level and the $4,202 level (last week's high) but failed to hold, indicating a continued weakening of short-term bullish momentum and a gradually bearish market outlook. On the downside, the first support level to watch is the $4,000 (psychological level) area, followed by the low near the end of June at $3.941.70.
Today, consider going long on gold at $3,993, with a stop loss at $3,985 and targets of $4,050 and $4,060.
AUD/USD
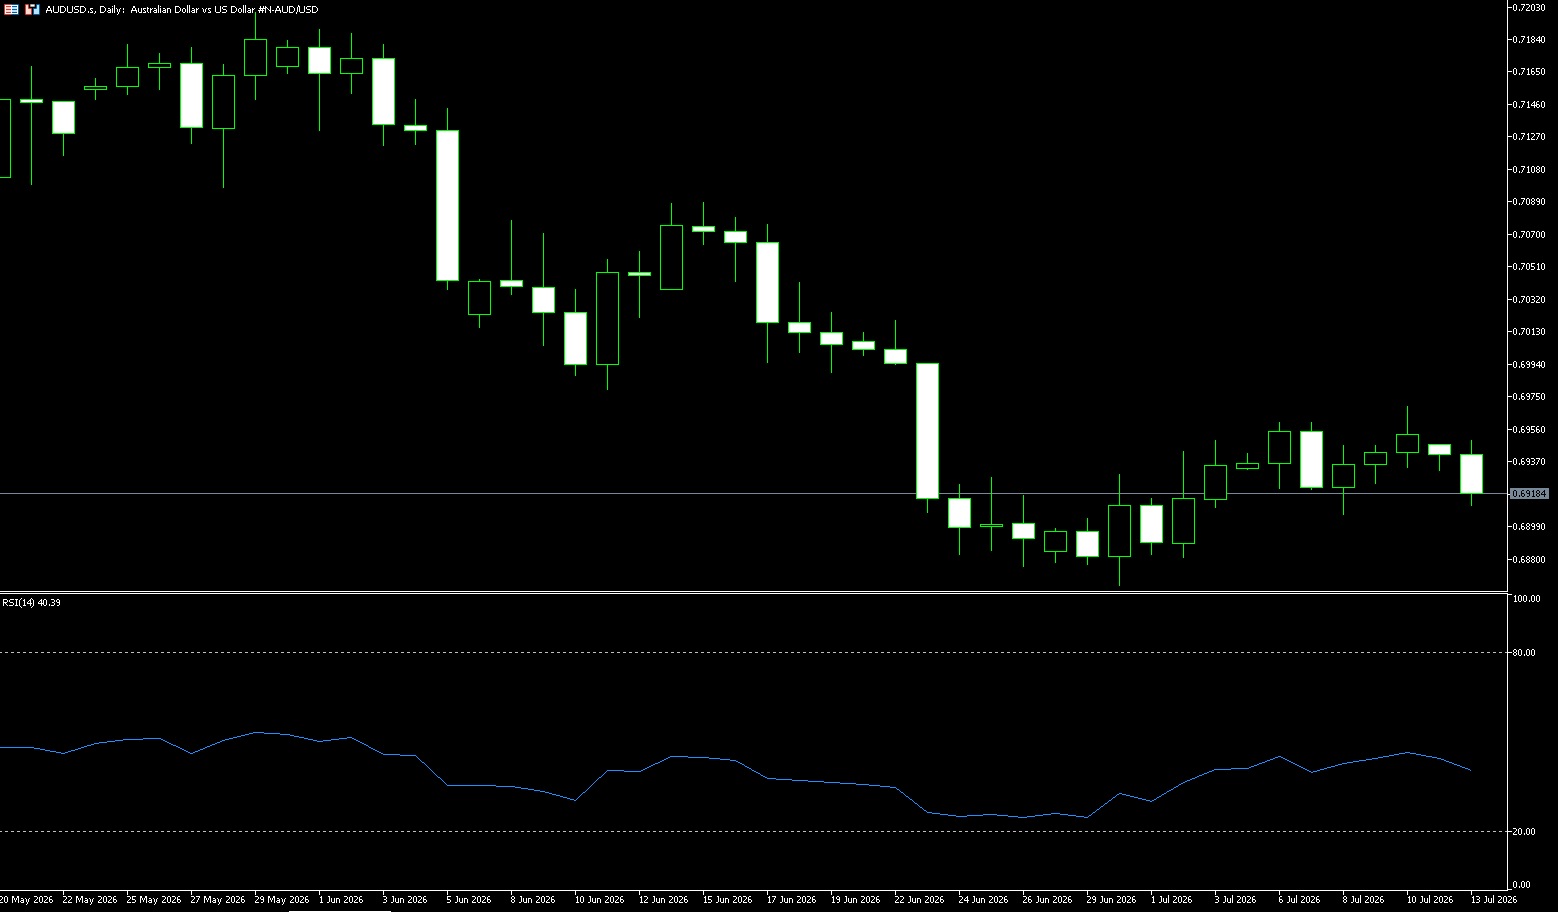
The Australian dollar hovered around US$0.6920, extending its losses of about 0.2% from last week and trading near a three-month low, as continued tensions in the Middle East weighed on global risk sentiment. The US launched another wave of airstrikes against Iran over the weekend in response to an attack on a container ship in the Strait of Hormuz, while Tehran retaliated by targeting US military facilities in the Middle East. Meanwhile, hawkish comments from the Reserve Bank of Australia helped limit the Australian dollar's losses. RBA Assistant Governor Sarah Hunt stated last week that the board would act as needed to restore inflation to the target level, and warned that some tightening measures might be necessary if oil price shocks boost inflation expectations. The market currently estimates a roughly 60% probability of another rate hike later this year, up from 40% previously, although futures only suggest a 19% probability of an August rate hike. Traders are now awaiting key employment and inflation data later this month for new clues about the policy outlook.
Tuesday's US CPI data is a key external variable for the Australian dollar against the US dollar – a stronger-than-expected CPI could reignite expectations of a Fed rate hike, reversing the current weakness of the US dollar and putting additional pressure on the Australian dollar. In the current environment, the Australian dollar's movement against the US dollar will continue to depend on the balance of power between "geopolitical risk suppression" and "policy divergence support." The Australian dollar is likely to fluctuate within the 0.6900-0.6980 range in the short term, with the direction depending on the evolution of these two variables. On the upside, if there are signs of easing tensions in the Middle East, a recovery in risk appetite could push the Australian dollar back to 0.6980 or even 0.7000. If Australian inflation data exceeds expectations, increasing the probability of an August rate hike, the Australian dollar could also receive independent policy support. On the downside, if the US-Iran conflict continues to escalate, further deterioration in risk appetite could push the Australian dollar to test the 0.6900 or even 0.6850 area.
Today, consider going long on the Australian dollar at 0.6910, with a stop loss at 0.6900 and targets at 0.6960 and 0.6970.
GBP/USD
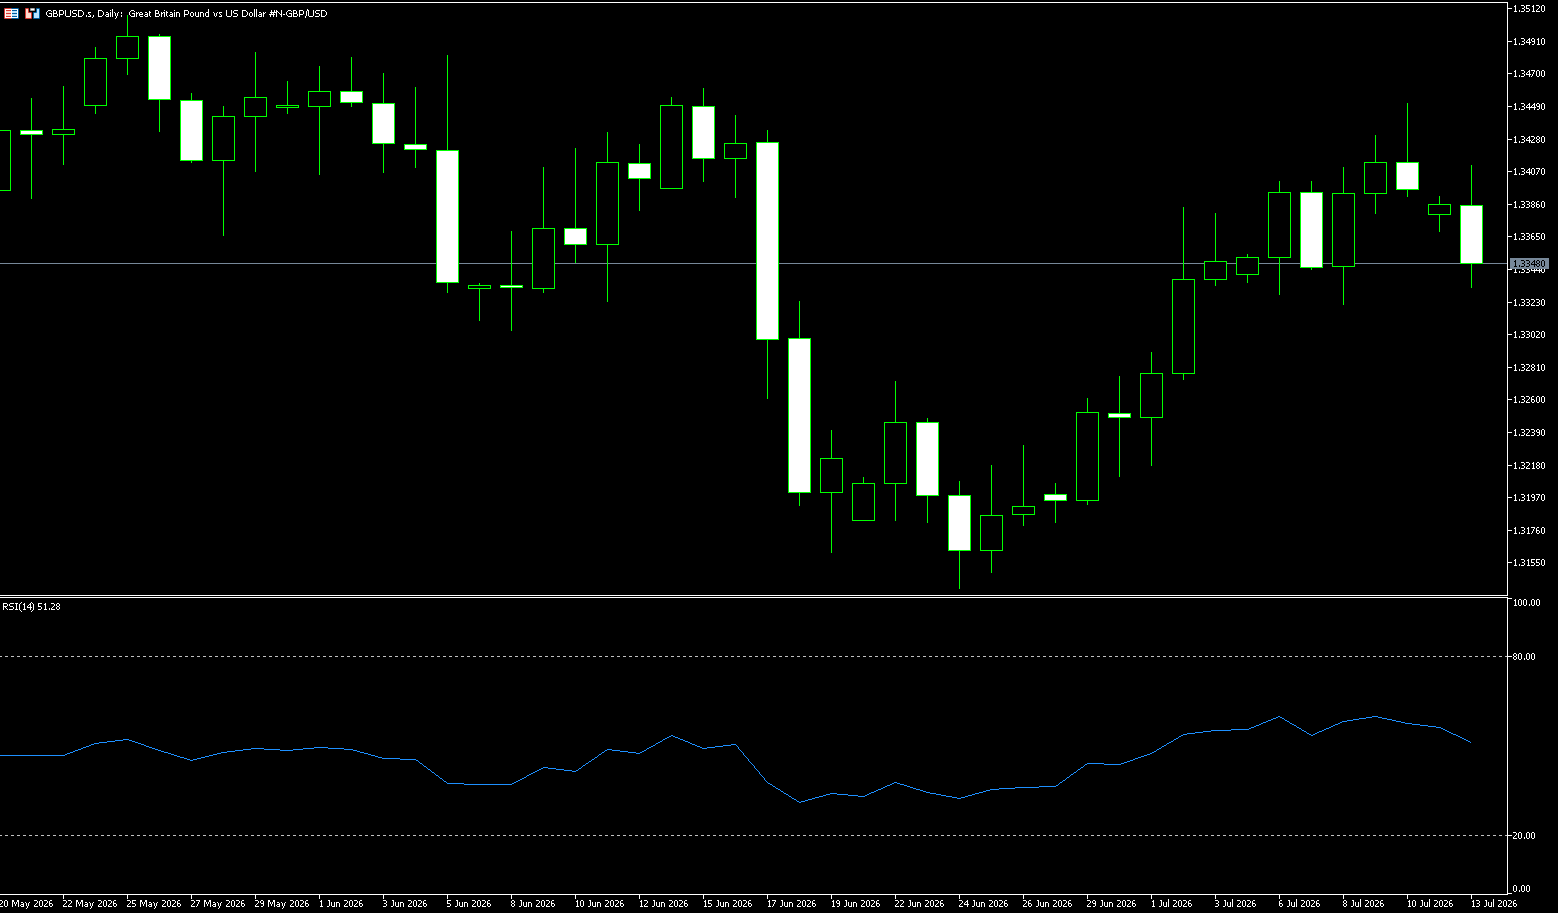
The pound fell back below $1.3350, retreating from a three-week high, as investors reacted to escalating tensions in the Middle East. Oil prices surged following another round of US strikes against Iran, with the two sides clashing over the status of the Strait of Hormuz. US Central Command confirmed strikes on dozens of targets to curb Iran's ability to threaten shipping in the region, while Iran declared the strait "closed indefinitely." The resulting uncertainty exacerbated inflation concerns, prompting investors to increase bets on further interest rate hikes by the Bank of England. The market now expects at least one rate hike later this year, and possibly a second. Politically, Andy Burnham is expected to become the new Labour leader after leading the election on Friday and is projected to be formally appointed Prime Minister next Monday. The pound's resilience amid recent political turmoil suggests that much of the negative news has already been priced in by the market.
The pound/dollar pair's rebound was capped near a six-week low of 1.3300, as selling pressure continued to linger above the 1.3451 area (last Friday's high). Despite the later pressure, the pound/dollar recorded weekly gains, reversing some of last week's sharp decline. At the start of the week, GBP/USD opened weaker and further declined to a near six-week low of 1.3365, influenced by renewed geopolitical tensions over the weekend. On the daily chart, GBP/USD maintains a slightly bullish short-term bias as the price remains above the 30-day simple moving average at 1.3332. The Relative Strength Index (RSI) (14) is at 54.40, indicating constructive but not overextended upward momentum above, with initial resistance at the 1.3400 level, followed by the June 15 high of 1.3460. Buyers may hesitate here. Immediate support is provided by the 30-day simple moving average at 1.3332, while a deeper pullback is likely to be limited at the 1.3300 (psychological level).
Today, consider going long on GBP at 1.3332, with a stop-loss at 1.3320 and targets at 1.3380 and 1.3390.
USD/JPY
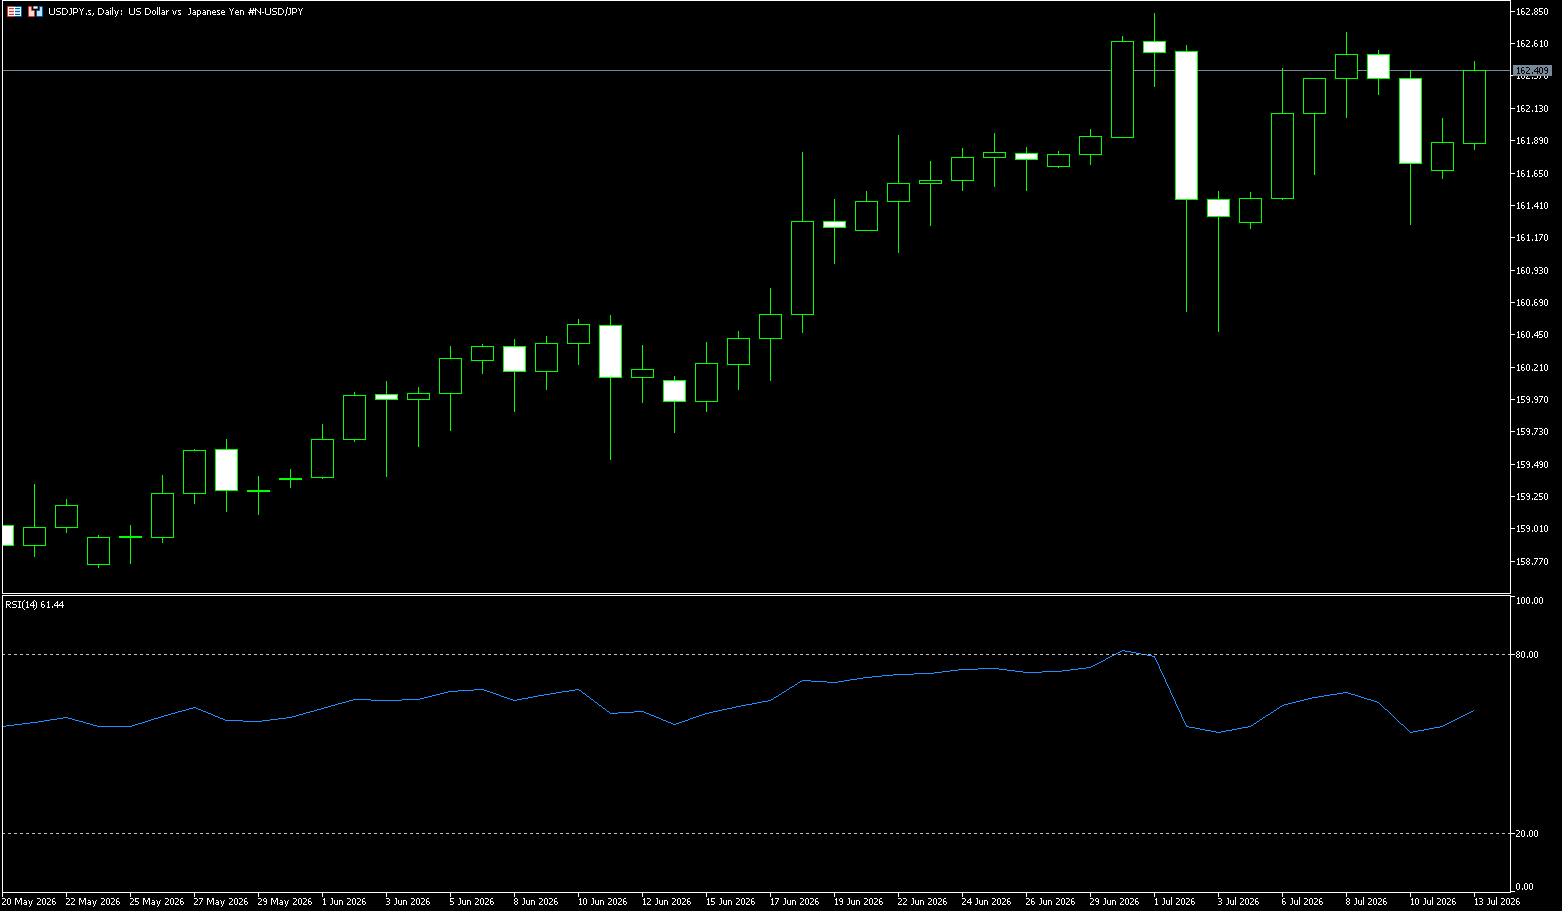
On Monday, the USD/JPY pair fluctuated at high levels, currently trading around 162.40. According to sources, the Bank of Japan may slightly raise its fiscal year 2026 economic growth forecast at its policy meeting ending on July 31, while moderately lowering its short-term inflation outlook due to falling oil prices. However, this adjustment is not expected to change the central bank's cautious stance on inflation risks—any downward revision to inflation will be framed as a reflection of falling oil prices, rather than a softening of policy. The market widely expects the Bank of Japan to keep its short-term policy rate unchanged at 1% at its July meeting, but most analysts still expect another rate hike to 1.25% by the end of the year. The Bank of Japan will release its quarterly economic and price outlook report on July 31, and the market will closely watch for clues regarding the timing and pace of further rate hikes. Sources familiar with the matter indicated that the lack of a clear signal regarding the timing of an interest rate hike in the central bank's guidance could lead to continued volatility in the yen around the July 30-31 meeting. Investors will have to interpret the overall tone of the quarterly report to infer policy direction, rather than relying on a specific timeframe.
Overall, the USD/JPY pair is currently in a weak rebound phase. Looking at the 4-hour chart, the USD/JPY has recently rebounded from its lows, but the overall trend remains suppressed by multiple moving averages. The chart shows that the pair formed short-term highs near 162.84 (July 1st high) and 163.00 (psychological level), indicating significant resistance above. The current price is below 162.71 (last week's high), suggesting that medium-term downward pressure remains. If the pair can effectively break through 162.71-162.84 and further test the 163 psychological level, bullish momentum may strengthen again, and the pair could continue its push towards the resistance near 163.50. On the downside, if the exchange rate fails to break through 161.28 and instead falls back, the first support level to watch is around 161.21 (the 30-day moving average), followed by the psychological level of 160.20-160.00.
Today, consider shorting the US dollar at 162.60, with a stop loss at 162.75 and targets at 161.70 and 161.80.
EUR/USD
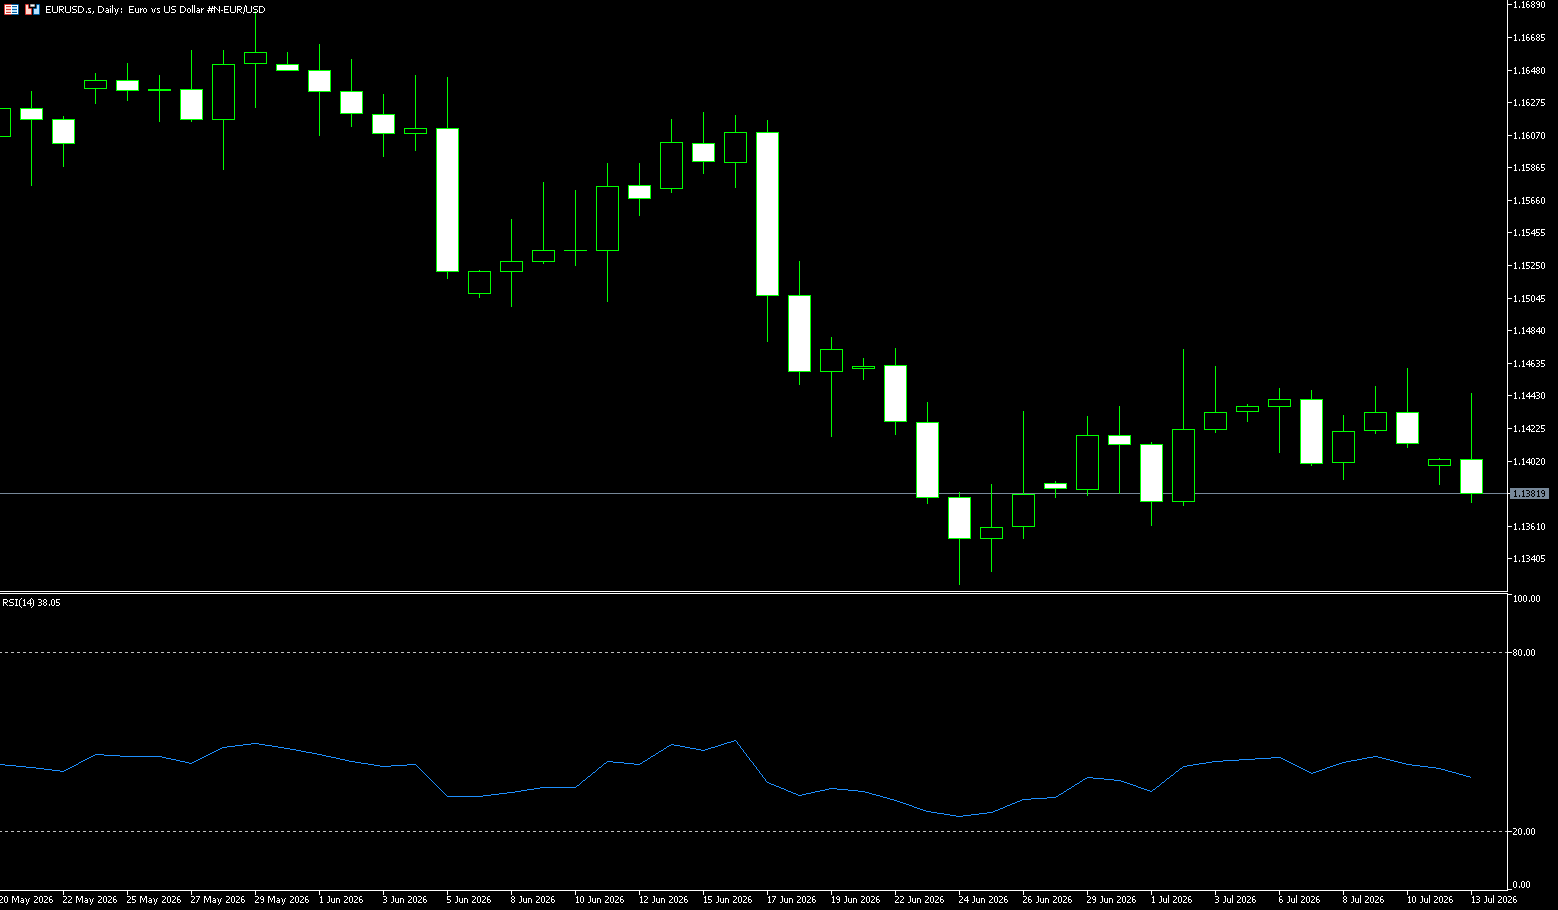
On Monday morning, the euro weakened against the US dollar, trading below 1.1400. The renewed escalation of the US-Iran conflict over the weekend was the core factor weighing on the euro—the US Central Command announced a new round of strikes against Iran, and the Iranian Islamic Revolutionary Guard Corps subsequently launched retaliatory attacks against US allies such as Kuwait, Jordan, and Qatar. The escalating geopolitical risks boosted the safe-haven demand for the US dollar, putting downward pressure on the euro against the dollar. The renewed escalation of the situation in the Middle East over the weekend was the direct trigger for the euro's weakness. The US Central Command announced a new round of strikes against Iran, targeting its ability to threaten civilian vessels in the Strait of Hormuz. Market reaction saw the euro fall back to around 1.1400 against the dollar, indicating that safe-haven demand temporarily outweighed the transmission effect of energy inflation and the ECB's interest rate hike. Previously, the market had anticipated progress on a US-Iran agreement to ease geopolitical tensions, but weekend developments suggest a diplomatic breakthrough remains a distant prospect.
In the current environment, the euro/dollar exchange rate is facing geopolitical risks. In the short term, 1.1400 is a key psychological level; a break below this level could open up further downside potential. Holding above this level suggests a high probability of consolidation before the CPI data release. Technically, the recent decline in the euro/dollar exchange rate has created a bearish flag pattern within an upward-sloping channel. This keeps the 34-day simple moving average at 1.1495 on the 4-hour chart acting as resistance, further reinforcing the upper supply zone. Meanwhile, momentum indicators show a slightly constructive outlook. In fact, the Relative Strength Index (RSI) is hovering below 40, while the MACD histogram is slightly positive. Relevant resistance levels are locked at 1.1455 (25-day simple moving average) near the top of the channel, followed by the 34-day simple moving average at 1.1495. On the downside, the first significant support appears at 1.1371 near the lower trendline of the ascending channel. If bearish pressure persists, the previous channel starting area around 0.1324 (June 24 low) will become secondary support.
Consider going long on Euros at 1.1370 today, with a stop loss at 1.1360 and targets at 1.1420 and 1.1430.
Stock Analysis:
Australian ASX 200 Stock Index
Basic Market Overview:
The Australian Securities Exchange (ASX) 200 index was nearly flat on Monday, closing at 8,808 points, with strong performance in communications, financials, and energy and mining offsetting weakness in technology, industrials, and consumer stocks. The market retreated from the previous day's gains as US stock index futures weakened, and traders anticipate a series of key events this week, including US inflation data and testimony from Federal Reserve Chairman Walsh, as well as June trade figures and second-quarter GDP releases from China's major trading partners. Locally, July's consumer and business sentiment data will also be released this week.
Mining stocks retreated ahead of the quarterly update, with BHP Billiton (-0.1%) and Rio Tinto (-0.3%) declining slightly, while technology stocks underperformed due to sharp drops in Xero (-4.5%) and WiseTech (-2.1%). Gold mining stocks also declined, led by Northern Star (-2.6%) and Evolution Mining (-1.6%). Conversely, Woodside Energy rose 0.9% as escalating tensions in the Middle East and rising oil prices followed a new round of US strikes against Iran. The four major banks rose between 0.3% and 1.3%, providing support for broader indices.
Sector Performance:
Leading Sectors (Ranked by Gains)
Telecommunications Services: Telstra's positive earnings expectations and solid market share lead to Telstra (TLS) +1.2%
Financials: All four major banks rise, with stable interest rate expectations; Commonwealth Bank (CBA) +1.3%, Westpac (WBC) +0.8%
Energy: Concerns about shipping in the Strait of Hormuz drive up oil prices; Woodside Energy (WDS) +0.9%, Santos (STO) +0.6%
Leading Sectors (Ranked by Losses)
Information Technology: High interest rate expectations weigh on growth stocks; Xero CEO reduces holdings in Xero (XRO) -4.3%
Utilities: Rising interest rates and increased energy costs lead to Origin Energy (ORG) -2.7%, AGL Energy (AGL) -3.8%
Gold Mining: Rising interest rate expectations lead to Northern Star (NST) -2.6%, Evolution Mining (EVN) -1.8%
Technical Analysis The ASX200 index opened higher on Monday but encountered resistance after an initial surge, fluctuating by less than 30 points throughout the day. The four major banks, energy, and telecommunications sectors supported the index, while technology, precious metals mining, and industrial stocks all weakened, resulting in a weak market breadth (6 out of 11 sectors closed lower). Investors were cautious, awaiting the release of US inflation and Chinese trade/GDP data this week. The closing price was 8808.5 points, a slight increase of +0.03%, reflecting a narrow range-bound trading throughout the day. The market was balanced between bulls and bears, with extreme sector divergence, maintaining an overall medium-term range-bound trading pattern. Moving Average System: Prices are oscillating closely around the 20-day EMA, with the 5-day moving average flat, indicating no clear unilateral trend in the short term; the 50/100-day moving averages maintain an upward trend, suggesting a bullish medium-term trend. Technical Indicator RSI (14): In the neutral range around 48, with no overbought or oversold conditions, indicating a balance between bullish and bearish forces; MACD: The daily MACD lines are converging above the zero axis, with the red bars almost disappearing, indicating a continued weakening of bullish momentum and a lack of upward momentum; Regarding volume: Monday's trading volume contracted, with narrow-range oscillations accompanied by reduced volume, and no trend confirmation signal before a breakout. Overall Technical Conclusion: Neutral oscillation, mainly range trading, with no unilateral buy/sell signals, awaiting data catalysts to break through the 8650 or 8900 range boundaries.
Trading Strategy:
The following are technical trading ideas only and do not constitute investment advice. Leveraged trading may result in losses exceeding the principal.
Long Position Conditions:
Enter when the price retraces to the 8760-8770 range and stabilizes, followed by a 4-hour bullish candle.
Target: 8835 (first take-profit), add to the position if it breaks through, targeting 8880.
Stop Loss: Exit if it breaks below 8740. Single trade risk control ≤ 30 points.
Short Position Conditions:
Enter when the price rebounds to 8830 and encounters resistance, followed by a 4-hour bearish candle.
Target: 8762 (first take-profit), target 8720 if it breaks below.
Stop Loss: Exit if it closes above 8850.
Key Risk Warnings:
US Inflation Data: Higher-than-expected CPI will strengthen expectations of a hawkish Fed stance, causing rising US Treasury yields to suppress global risk assets. The ASX200 is likely to open lower and weaken; cooling inflation will benefit risk appetite.
China's June trade and Q2 GDP data: Weak domestic demand in China directly pressured iron ore and copper prices, with declines in heavyweight mining companies like BHP and Rio dragging down the index; better-than-expected data led to a rebound in the resource sector, supporting the market.
Australia: Consumer/business confidence indices will be released this week. If confidence remains weak, the market will price in the Reserve Bank of Australia maintaining high interest rates, suppressing the financial and real estate sectors.
Japan's Stock Market Index (JP225)
Basic Market Overview:
The Nikkei 225 fell 1.5% to around 67,500 points, while the broader Topix index fell 0.2% to 4,026 points, as Japanese stocks were pressured by escalating tensions in the Middle East, with inflationary pressures and interest rate hike expectations remaining a focus. The US and Iran exchanged new missile launches over the weekend, and the ongoing shipping dispute in the Strait of Hormuz pushed up oil prices. Investors are also awaiting a wave of corporate earnings reports from Wall Street this week, a key test of whether the AI-driven market rally can be supported by strong corporate results.
In terms of individual stocks, Kioxia Holdings fell 1.8%, Taiyo Yuden fell 4.8%, and Yaskawa Electric fell 14.2%, while SUMCO rose 7.9%, SoftBank Group rose 2%, and Mitsubishi UFJ rose 2.4%.
Sector Performance:
Leading Gains:
Today's Leading Sectors (Risk-Averse Inflows)
1. Large Banks & Financials (Strongest Theme of the Day)
• Mitsubishi UFJ MUFG +2.31%, Sumitomo Mitsui Financial +1.63%, Mizuho Financial +2%
• Logic: Middle East-driven oil prices, rising inflation and interest rate expectations, improved bank net interest margin expectations, and funds flocking to value safe-haven assets.
2. Semiconductor Silicon Wafers/Equipment Sub-sectors (Structural Divergence)
• SUMCO silicon wafers surged 7.9%, Lasertec lithography inspection equipment +4%
• Decoupled from memory chip performance, benefiting from global wafer capacity expansion orders.
3. Consumer Retail (Earnings Catalyst)
• Ryohin Keikaku, the parent company of MUJI, surged over 15%, raising its full-year profit guidance, attracting defensive consumer funds.
4. Automobile Manufacturing
Mitsubishi Motors rose over 4%, with export resilience offsetting oil price cost pressures.
Today's Leading Declining Sectors (Main Drag on the Index)
1. Semiconductors/AI Storage (Most Hit Area)
• Storage: Kioxia plunged 6%~9%, dragged down by the sharp drop in SK Hynix, leading to profit-taking in AI storage.
• Passive Components: Taiyo Yuden, Murata, and TDK all fell 4%~11%.
• Semiconductor Equipment: Advantest and Tokyo Electron weakened across the board, with technology growth stocks experiencing a collective pullback.
2. Industrial Automation/Robotics (Leading Decliner)
Yaskawa Electric plunged 14.34% in a single day, with its Q1 net profit declining 21.7% year-on-year. This disappointing performance dragged down the entire industrial equipment sector.
3. Electronics Manufacturing & Consumer Electronics Exports
Sony, Canon, Panasonic, and Mitsubishi Electric generally fell 1% to 3%, as rising oil prices suppressed profit expectations for export-oriented companies.
4. Precision Electromechanical & Components
Omron, Minebea, and Ibid., among others, generally fell by more than 3%, with selling pressure spreading through the technology supply chain.
Technical Analysis:
Today, the Nikkei 225 exhibited a large-volume, long bearish reversal pattern, closing at 67,242.73 points (-1.92%). The trading volume was significantly higher than the previous trading day, indicating concentrated selling pressure and increased willingness to exit the market. The breach of key support levels has shifted the short-term technical outlook to bearish. In terms of trading strategy, it is recommended to focus on shorting on intraday rebounds, and to observe or try shorting with a small position over a 3-5 day period; strict risk control is essential to guard against the risk of transmission from geopolitical conflicts and fluctuations in the Korean stock market. Technical indicators: RSI (14) falls below the 50 neutral line, short-term momentum turns from strong to weak, entering a weak zone; MACD red bars shorten, showing signs of crossing the signal line. Upward momentum weakens, while bearish forces strengthen. The moving average system breaks below the 5-day and 10-day moving averages, testing the 20-day moving average (approximately 66,800 points). The short-term trend line is broken, turning support into resistance.
Trading Strategy:
Intraday Trading Strategy (Short-term)
• Core Idea: Focus on shorting on rebounds, be cautious about chasing long positions.
• Shorting Opportunities:
◦ Entry Point: Enter when the price rebounds to the 67,800-68,200 point range (38.2% Fibonacci retracement level of today's decline), when there is a top divergence or a decrease in volume.
◦ Stop Loss: Above 68,500 points (above today's opening price, to prevent false breakouts).
◦ Target: 66,600 Point (near today's low), a break below this level could lead to 66,000 points
• Long Opportunities (Very Short-Term Only):
◦ Entry Point: Consider a small long position when a pullback to the 66,500-66,700 point range shows clear stabilization signals (e.g., long lower shadow, high-volume rebound).
◦ Stop Loss: Below 66,300 points (below key support level)
◦ Target: 67,200-67,500 points (mid-day trading range)
Risk Warnings:
Geopolitical Risk (High Risk): Escalating tensions in the Middle East, a US strike on Iran, and disruptions to shipping in the Strait of Hormuz have led to a surge in oil prices exceeding 3%. Japan relies on this strait for over 90% of its oil; rising energy costs will severely squeeze corporate profits and drag down economic growth.
Korean Stock Market Volatility Transmission Risk (High Risk): The South Korean KOSPI index fell sharply by 8.97% today, triggering market volatility limits. The Nikkei 225 is strongly correlated with South Korean stocks, especially in the semiconductor sector (such as Kioxia and SK Hynix). Continued declines in South Korean stocks will continue to drag down the Nikkei's performance.
Technical Breakdown Risk (Medium-High Risk): If the index breaks below the key support level of 66,366 points, it could trigger a surge of technical stop-loss orders, accelerating the decline to 65,000 points or even lower.
Disclaimer: The information contained herein (1) is proprietary to BCR and/or its content providers; (2) may not be copied or distributed; (3) is not warranted to be accurate, complete or timely; and, (4) does not constitute advice or a recommendation by BCR or its content providers in respect of the investment in financial instruments. Neither BCR or its content providers are responsible for any damages or losses arising from any use of this information. Past performance is no guarantee of future results.
More Coverage






Risk Disclosure:Derivatives are traded over-the-counter on margin, which means they carry a high level of risk and there is a possibility you could lose all of your investment. These products are not suitable for all investors. Please ensure you fully understand the risks and carefully consider your financial situation and trading experience before trading. Seek independent financial advice if necessary before opening an account with BCR.
BCR Co Pty Ltd (Company No. 1975046) is a company incorporated under the laws of the British Virgin Islands, with its registered office at Trident Chambers, Wickham’s Cay 1, Road Town, Tortola, British Virgin Islands, and is licensed and regulated by the British Virgin Islands Financial Services Commission under License No. SIBA/L/19/1122.
Open Bridge Limited (Company No. 16701394) is a company incorporated under the Companies Act 2006 and registered in England and Wales, with its registered address at Kemp House, 160 City Road, London, England, EC1V 2NX. Open Bridge Limited acts solely as a payment processor for BCR Co Pty Ltd and does not provide any financial, trading, or investment services on its behalf. Open Bridge Limited's role is limited to payment processing.


 English
 简体中文
简体中文
 繁體中文
繁體中文
 Bahasa
Melayu
Bahasa
Melayu
 Tiếng
Việt
Tiếng
Việt
 ไทย
ไทย
 日本語
日本語
 한국어
한국어
 ភាសាខ្មែរ
 español