


0
US Dollar Index
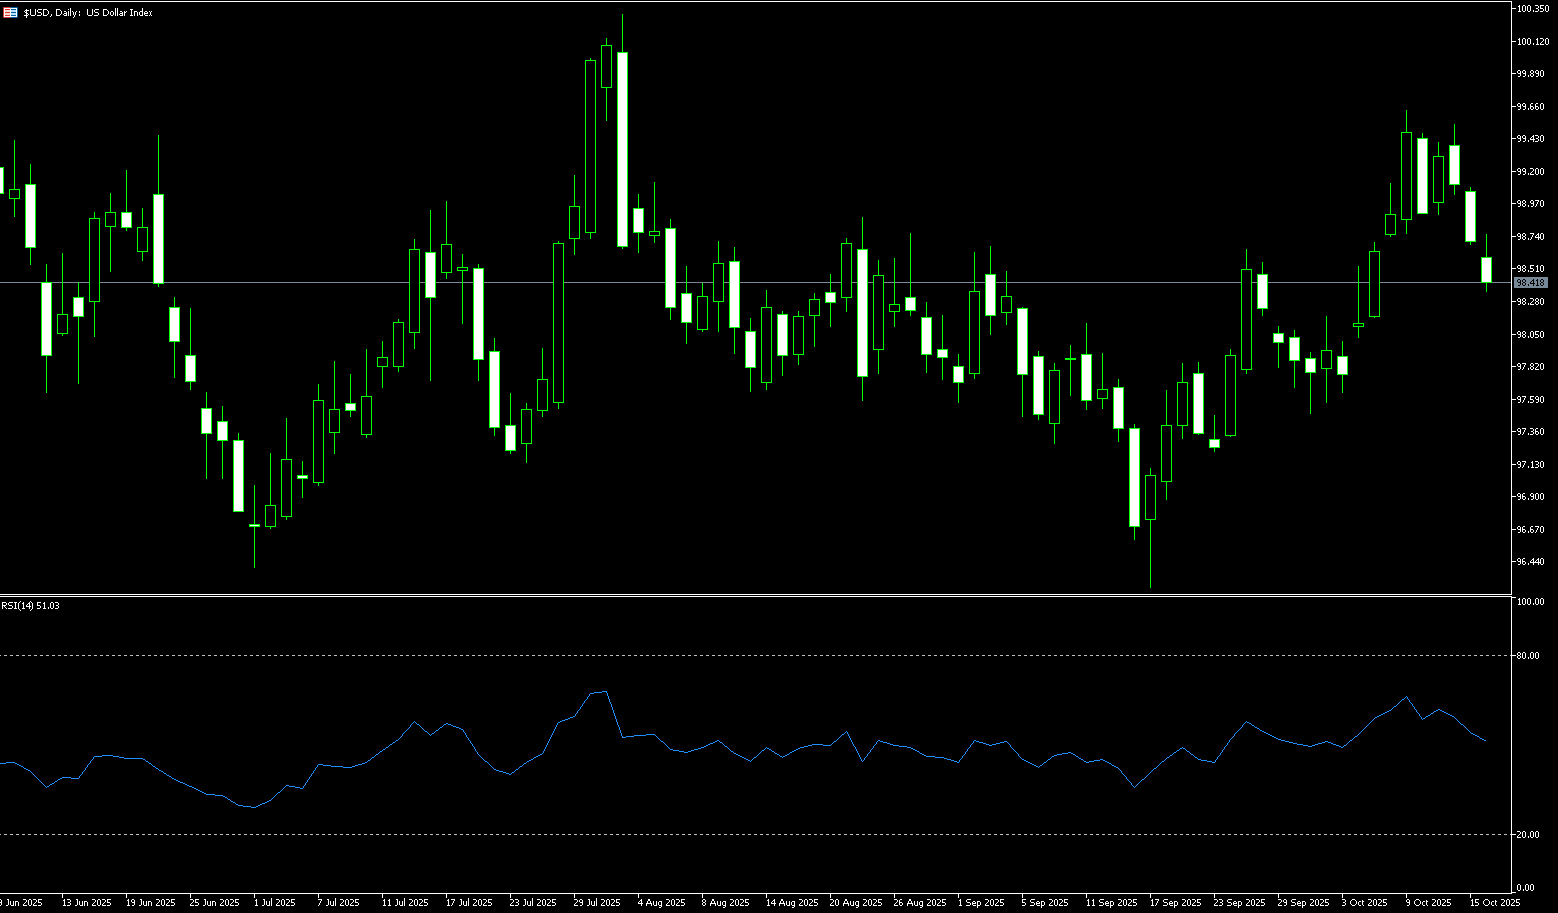
On Thursday, the US dollar index continued its decline, breaking below key support at 98.71 (the 61.8% Fibonacci retracement level from 100.26 to 96.22). This decline was driven by two factors: first, traders' expectations for a Fed rate cut continued to strengthen, and second, a rebound in global risk sentiment boosted demand for riskier currencies. The primary reason for the dollar's pressure came from Fed Chairman Jerome Powell. In his Tuesday speech, he reiterated his dovish stance, citing continued stagnation in the US labor market and weak hiring momentum. Meanwhile, a rebound in risk assets, a decline in the dollar's safe-haven appeal, and positive sentiment in European and US stock markets also led to capital outflows from the dollar. With the prolonged US government shutdown preventing the release of official economic data, Powell's comments reassured the market that the Fed is likely to continue its easing policy.
The daily chart shows that after breaking below its four-day consolidation range, the US dollar index faces further downward pressure. Traders are currently eyeing two key support levels: 98.24 (50.0% Fibonacci retracement level) and the 98.00 mark. The US dollar index is currently testing key retracement levels, with no immediate support before the 50-day moving average at 98.04, signaling a clear shift in market sentiment towards the negative. Unless the dollar finds support and rebounds between 98.00 and 98.04, a further pullback to 97.76 (38.2% Fibonacci retracement level) remains a possibility. This pullback is particularly likely to occur amidst continued consolidation of rate cut expectations and elevated risk appetite. As for the upside, watch for 98.71 (61.8% Fibonacci retracement level) and the 99.00 mark.
Consider shorting the US Dollar Index at 98.50 today. Stop-loss: 98.62, target: 98.05, 98.00.
WTI Spot Crude Oil
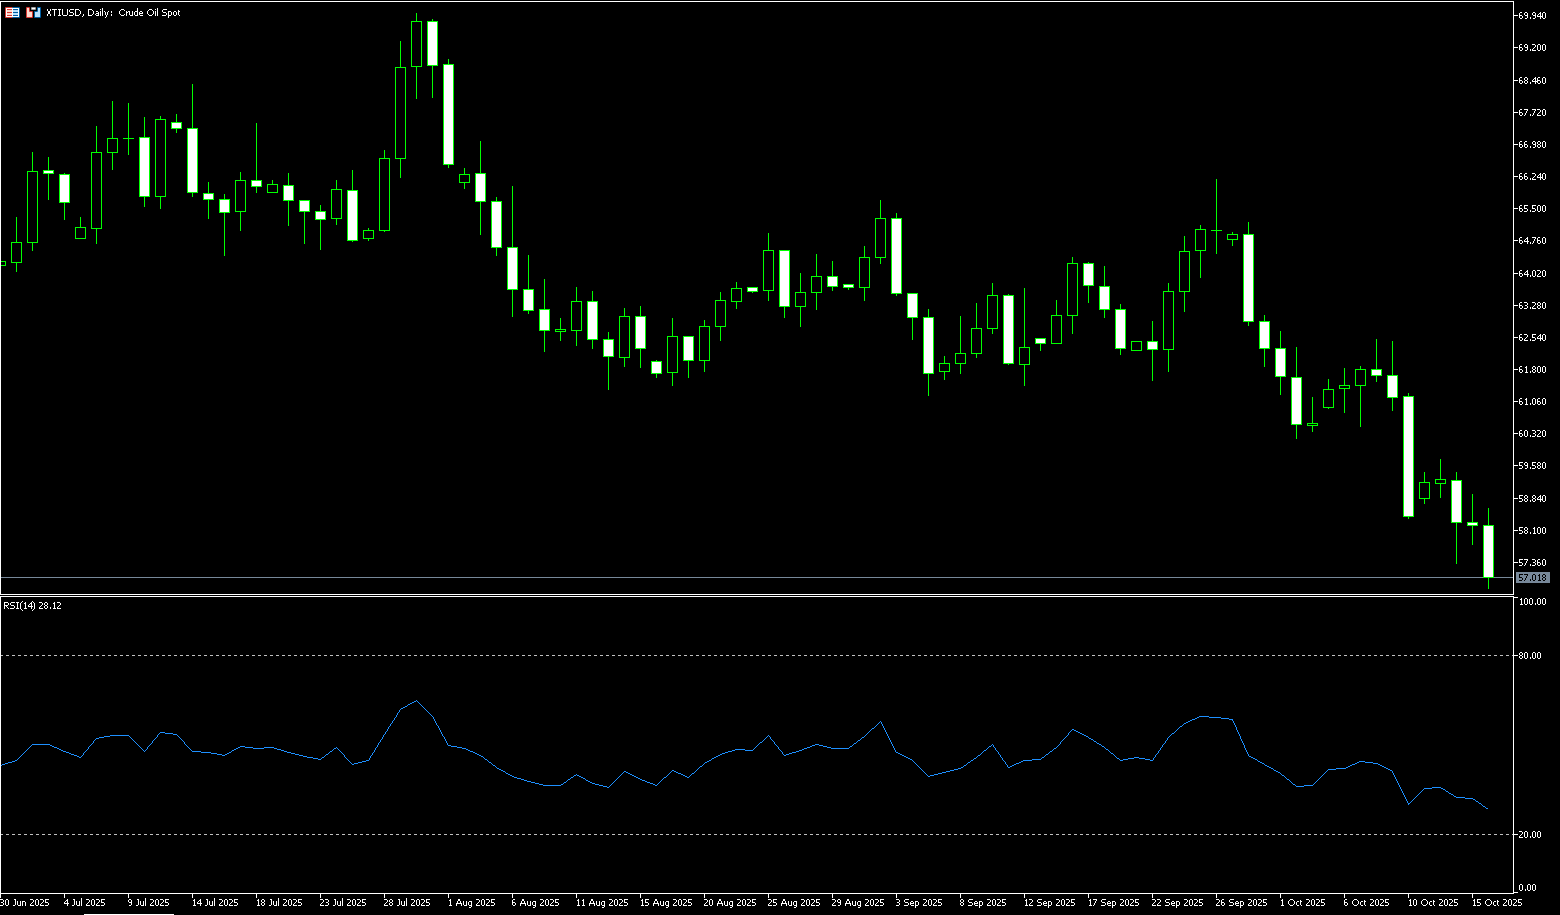
WTI crude oil fell to $56.78 per barrel on Thursday, its lowest since May, due to a mixed bag of signals from an unexpected build in US crude oil inventories and India buying Russian oil. The US Energy Information Administration said energy companies stored 3.524 million barrels of crude oil in storage in the week ending October 10, raising concerns about weak demand amid ongoing US-China trade tensions. Prices fluctuated after US President Donald Trump said Indian Prime Minister Narendra Modi agreed to halt Russian crude oil imports, a move that could tighten global supply. However, India's Ministry of External Affairs quickly denied any such conversation, stating it was unaware of a call between the two leaders. Indian refinery executives also said they had not been notified of the policy change, although some expected a short-term reduction in Russian imports. The disruptions came amid heightened US-India trade tensions following Trump's imposition of a 50% tariff on Indian goods.
The Middle East ceasefire agreement contains a hidden "fatal flaw"! Crude oil bulls should be wary of retreating. A softening of market sentiment would be bearish for oil prices. The direction of oil prices will be highly dependent on the progress of subsequent negotiations. Any signs of derailment by either side could push prices back up. At the beginning of the week, WTI fell over 2%, breaking below last week's low of $58.22 and testing levels not seen since early June. Heavy selling pushed prices below $57.00, with the May 30th bottom of $55.74 and $55.00 now acting as the next key support levels. This move extends the sharp bearish trend and solidifies the downward momentum. On the upside, a break above the $59.80 (9-day moving average) and the psychologically important $60.00 level could slow the sell-off, with the next level at $61.45 (20-day moving average).
Consider going long on crude oil at 56.80 today. Stop-loss: 56.62. Target: 58.50, 58.70.
Spot Gold
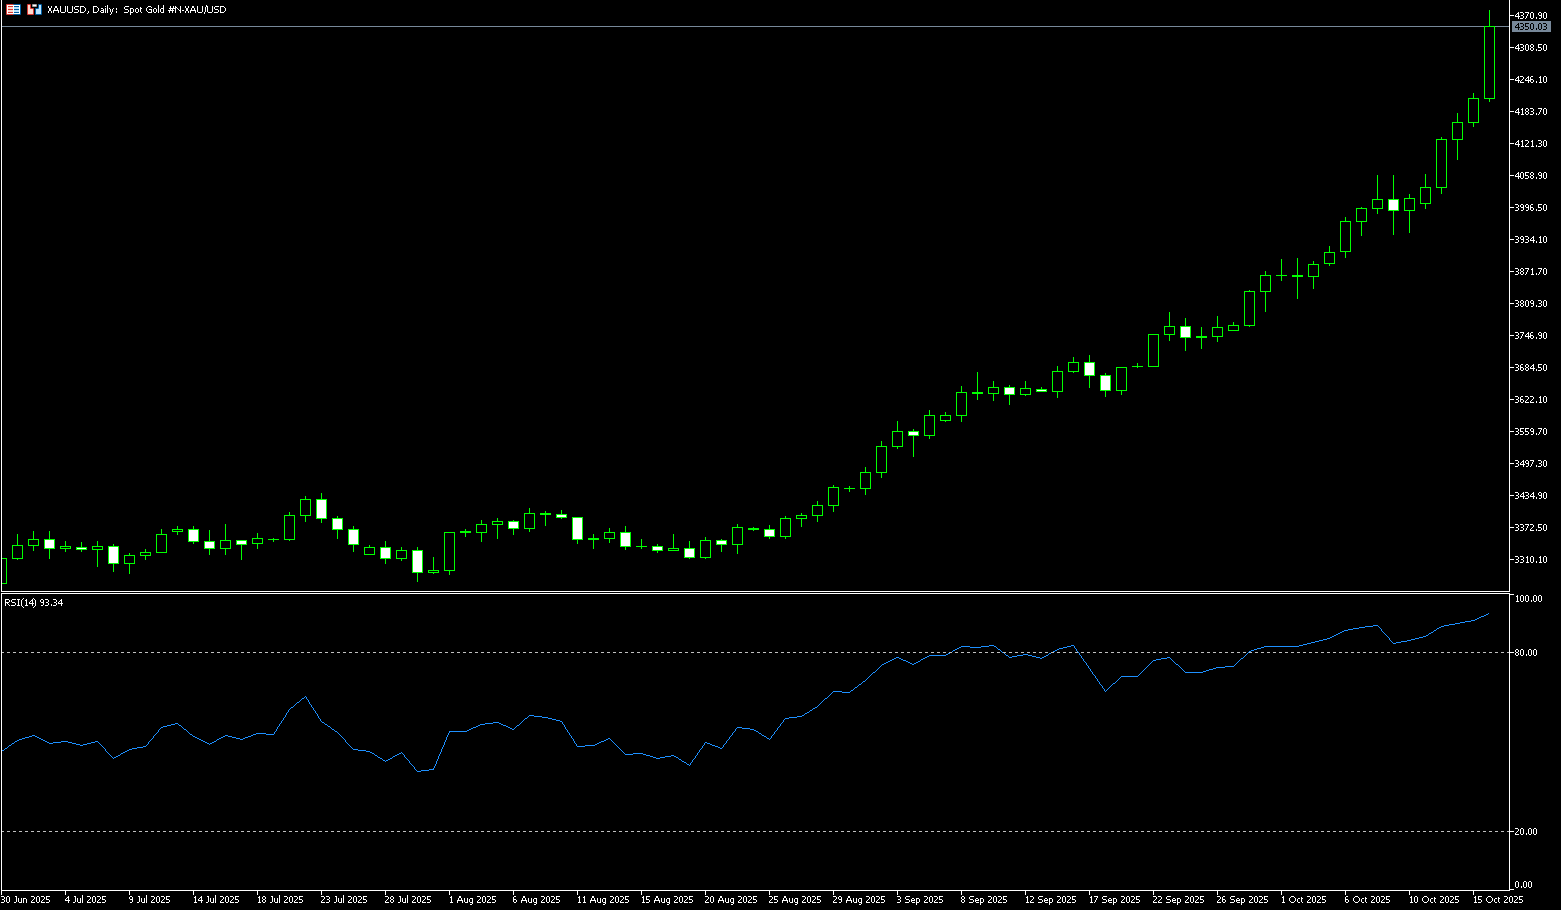
Gold prices hit a record high for the fourth consecutive trading day, breaking through $4,300 per ounce on Thursday, as investors sought safety amid escalating US-China trade tensions and the ongoing US government shutdown. The precious metal has risen over 60% year-to-date, supported by strong central bank buying, expectations of aggressive interest rate cuts, and heightened geopolitical risks. Federal Reserve Chairman Powell's recent comments on signs of labor market weakness have led investors to almost fully price in a 25 basis point rate cut at this month's meeting, with another cut possible in December, boosting gold's appeal in a low-interest rate environment. On the trade front, US officials on Wednesday condemned China's tightening rare earth export restrictions, warning of threats to global supply chains and hinting at potential US countermeasures.
In the short term, gold bulls hold a significant technical advantage overall, having surged over 63%. However, short-term fatigue may be showing. The 14-day Relative Strength Index (RSI) on the daily chart is showing a severe overbought signal (currently at 87.30), suggesting that gold prices may need a period of consolidation before further gains. The next bullish target is to push gold prices above $4,400. The next level of resistance is the key resistance level of $4,500.00. The next short-term bearish target is to push gold prices below the key support level of $4,000.00. The first support level is Thursday's low of $4,199.00, followed by the $4,100.00 level (round number).
Consider going long on gold at 4,325 today, with a stop loss at 4,320 and targets at 4,400 or 4.410.
AUD/USD
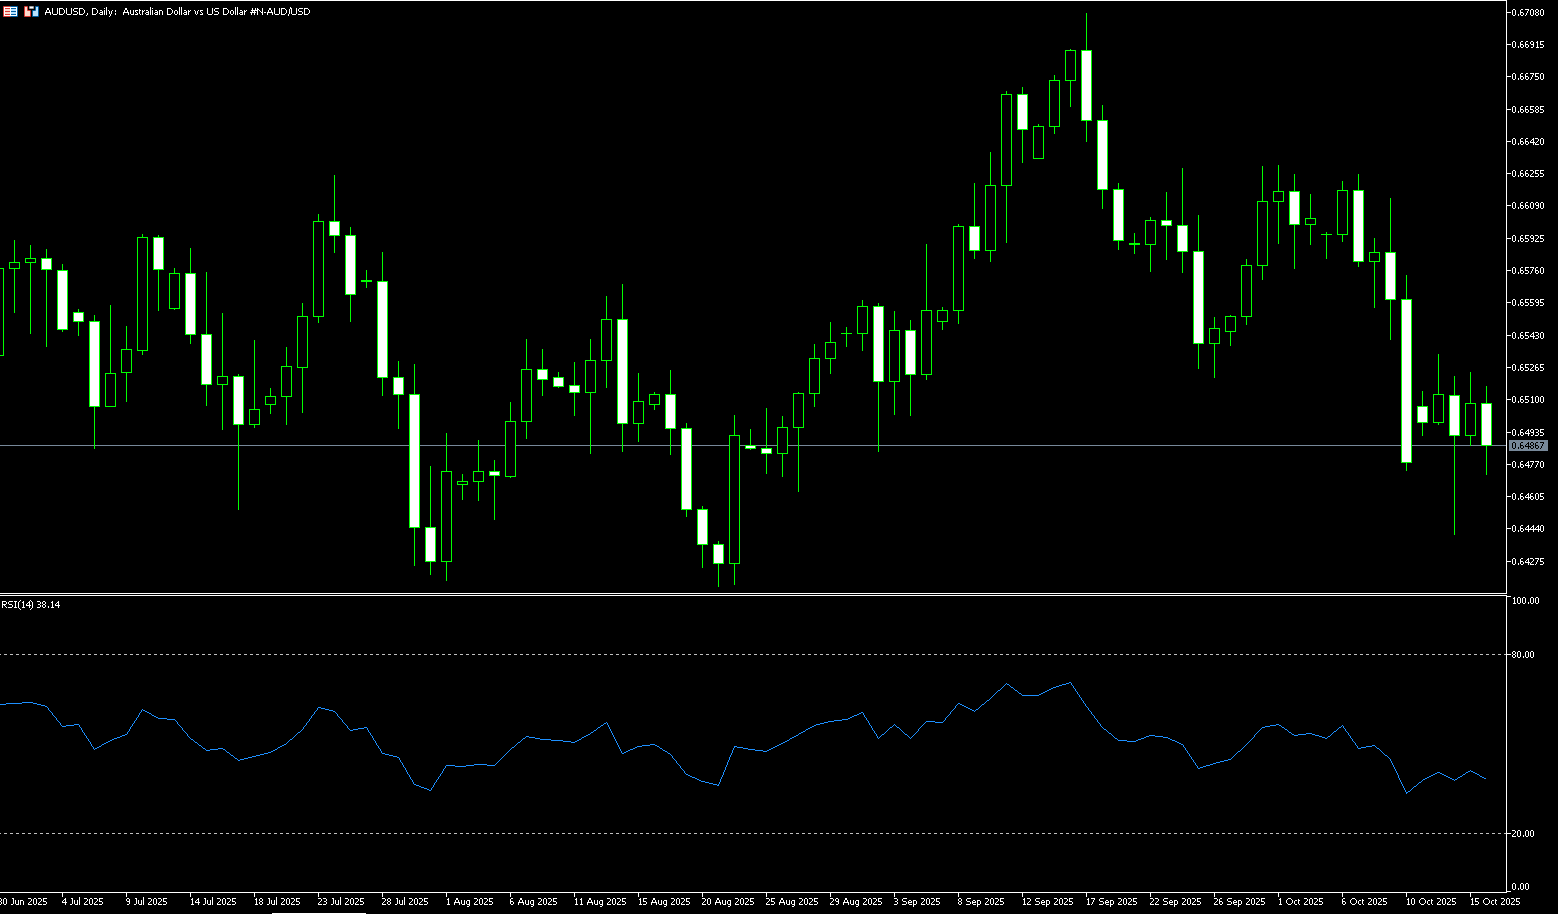
The Australian dollar fell below $0.6500 on Thursday, reversing the previous session's gains after a weak jobs report reignited market expectations of a Reserve Bank of Australia rate cut. The Australian Bureau of Statistics reported that the unemployment rate rose to 4.5%, exceeding expectations and reaching its highest level in nearly four years. Employment increased by just 14,900, falling short of expectations for a 20,000 increase. These data suggest further easing in the labor market, fueling market expectations that the Reserve Bank of Australia may resume interest rate cuts next month. Investors currently price in a 71% probability of a rate cut, up from 40% before the release. Attention now turns to third-quarter inflation data, due in less than two weeks, which will have a key impact on expectations for the November policy meeting.
The Australian Dollar (AUD) exchange rate traded slightly below 0.6500 on Thursday. Technical analysis on the daily chart suggests the pair remains in a persistent bearish bias. Furthermore, the 14-day Relative Strength Index (RSI) remains below 50, further reinforcing the bearish bias. On the downside, AUD/USD could target Tuesday's near two-month low of around 0.6440. A breakout of this channel would reinforce the bearish bias and prompt the pair to test the four-month low of 0.6414 set on August 21, followed by the 0.6400 round-figure mark. On the other hand, AUD/USD could test initial resistance at the 9-day simple moving average of 0.6535, followed by the 14-day simple moving average near 0.6558. The psychologically important 0.6600 level is next.
Consider a long AUD at 0.6472 today, with a stop-loss at 0.6460 and targets at 0.6520 and 0.6530.
GBP/USD
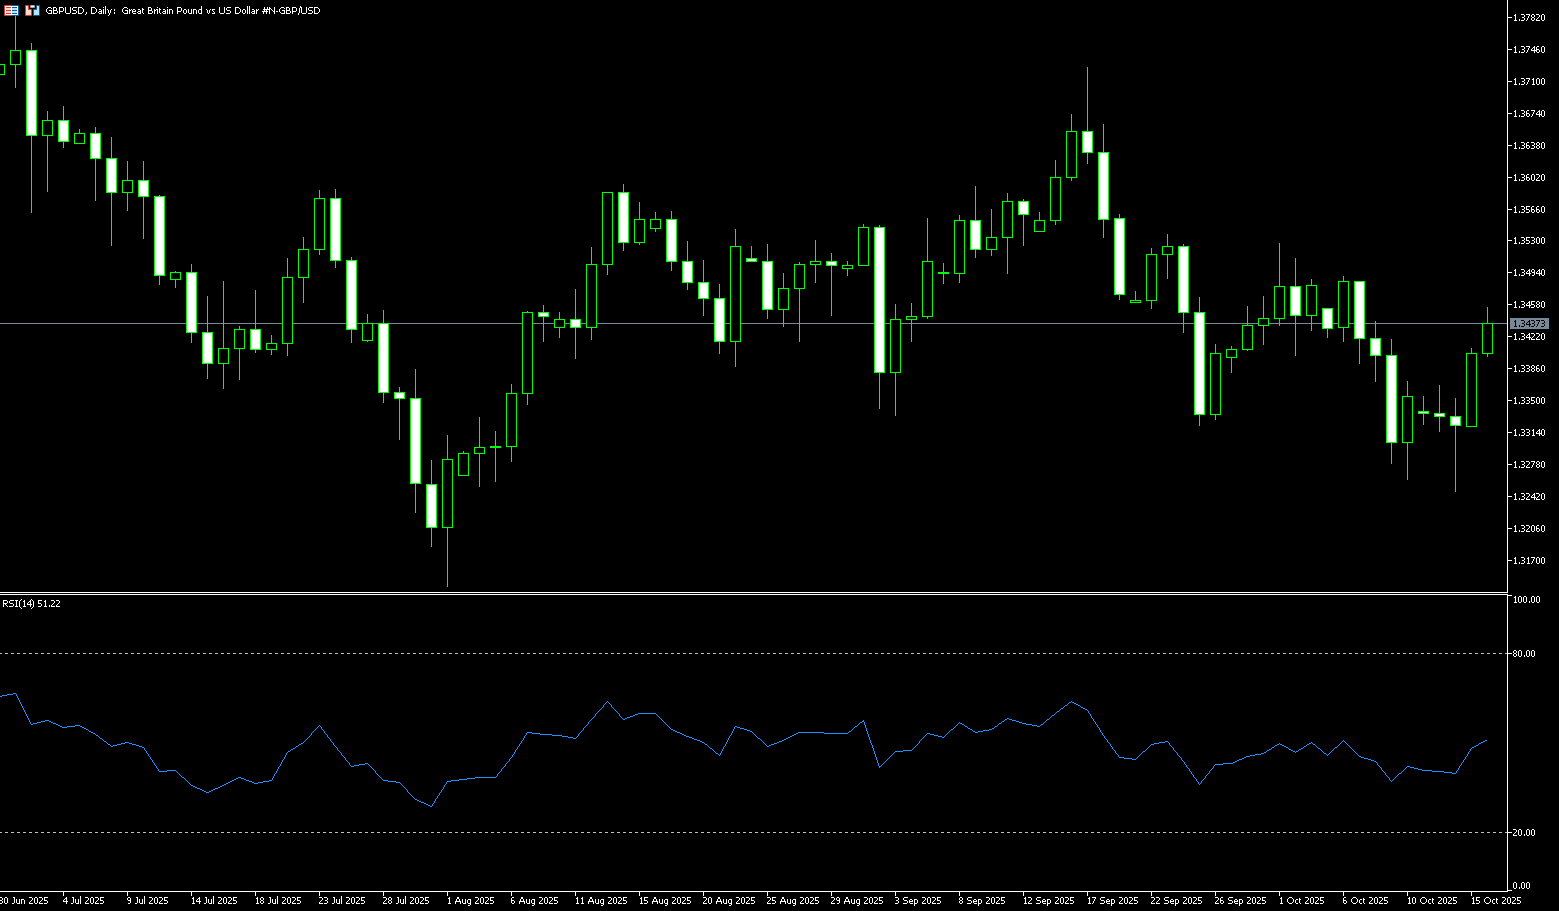
The UK economy grew in August, with gross domestic product (GDP) reporting 0.1%, following a 0.1% contraction in July (revised from 0%), according to the latest data released by the Office for National Statistics (ONS) on Thursday. The consensus was for a 0.1% increase during the reporting period. Meanwhile, the services index (August) was 0.4% 3M/3M, unchanged from 0.4% in July. Other data from the UK showed that industrial and manufacturing production grew by 0.4% and 0.7%, respectively, in August. Both figures exceeded market expectations. GBP/USD reacted to the UK data with a slight rise, trading just above 1.3400. GBP/USD found room at higher levels, climbing back towards 1.3400 after a brief dip, where it briefly challenged its 200-day moving average near 1.3290. Meanwhile, the US data schedule remained weak due to the US government shutdown, which limited the flow of key data releases.
GBP/USD stabilized at midweek highs, recovering to 1.3400 after a brief dip, where it briefly challenged its 185-day simple moving average near 1.3262. GBP/USD's technical outlook suggests that the current rally could be short-lived unless buyers break through and sustain above the 1.3400 (round number) and 1.3420 (20-day SMA) areas on a daily basis. This would pave the way for a test of the 50-day SMA at 1.3476, followed by a potential challenge of the psychological 1.3500 level. As the 14-day Relative Strength Index (RSI) indicates, the RSI is trading below the neutral 50 level. If GBP/USD continues to depreciate below the 1.3400 level, further downside targets would be the 160-day SMA at 1.3368, as well as the 1.3300 round number.
Consider going long on the British pound at 1.3422 today. Stop-loss: 1.3410. Target: 1.3465, 1.3475.
USD/JPY
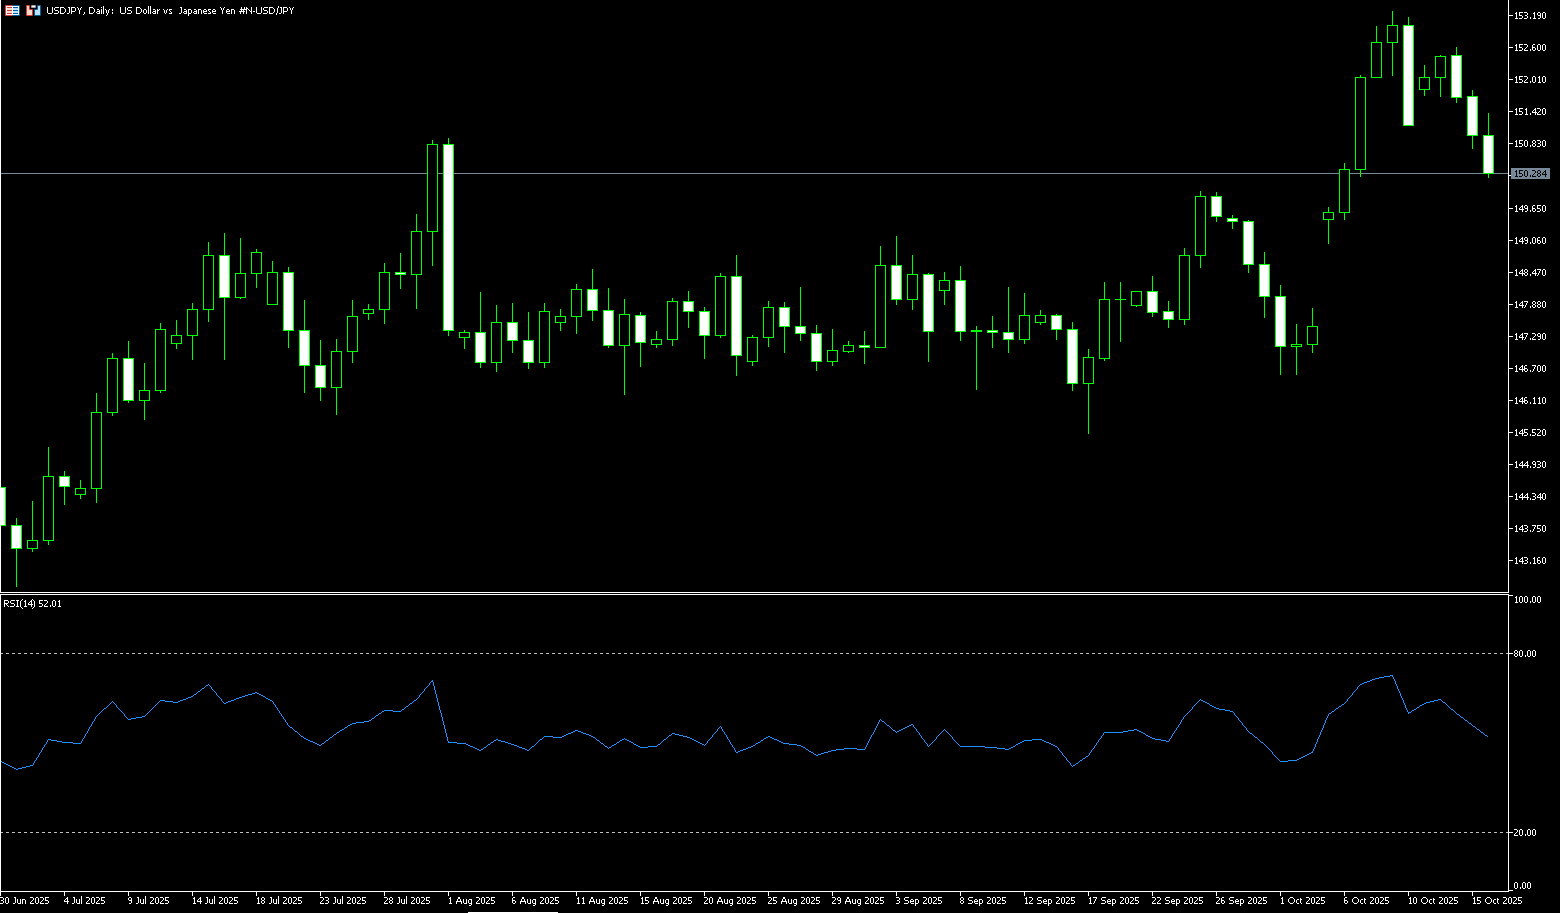
The yen rose to around 150.20 per dollar on Thursday, strengthening for the third consecutive session as Liberal Democratic Party leader Sanae Takaichi's path to becoming the next prime minister remained highly uncertain following the collapse of her coalition with Komeito last week. The ruling party proposed a leadership election on October 21, although the opposition has yet to agree on that date. Traders who had previously bet on Takaichi pursuing aggressive fiscal spending and continued monetary easing have reversed course and increased their positions as political uncertainty intensified. Meanwhile, Bank of Japan Governor Naoki Tamura warned against premature policy tightening, emphasizing the need to avoid stagnant prices and wages. Safe-haven inflows and a weaker dollar provided additional support, driven by escalating US-China trade tensions, a prolonged US government shutdown, and dovish signals from the Federal Reserve.
On Thursday, USD/JPY slipped below its 5-day simple moving average of 151.40. The subsequent decline below 151.00 to a near-week low of 150.20 could be seen as a key trigger for bearish traders. However, oscillators on the daily chart remain in positive territory, suggesting that the spot price could find some support around the psychological 150.00 level. This level coincides with the 17-day simple moving average at 150.10, and a decisive breakout could expose the 25-day simple moving average, around the 149.26 area. On the other hand, any rebound attempt may now face immediate resistance around 151.00. A sustained breakout could further boost the USD/JPY pair, although it is more likely to be capped near confluence resistance at 151.65. However, some sustained buying would negate any short-term negative bias and allow the spot price to revisit the 152.00 round-figure level.
Consider shorting the US dollar at 150.65 today. Stop-loss: 150.85, target: 149.70, 149.50.
EUR/USD
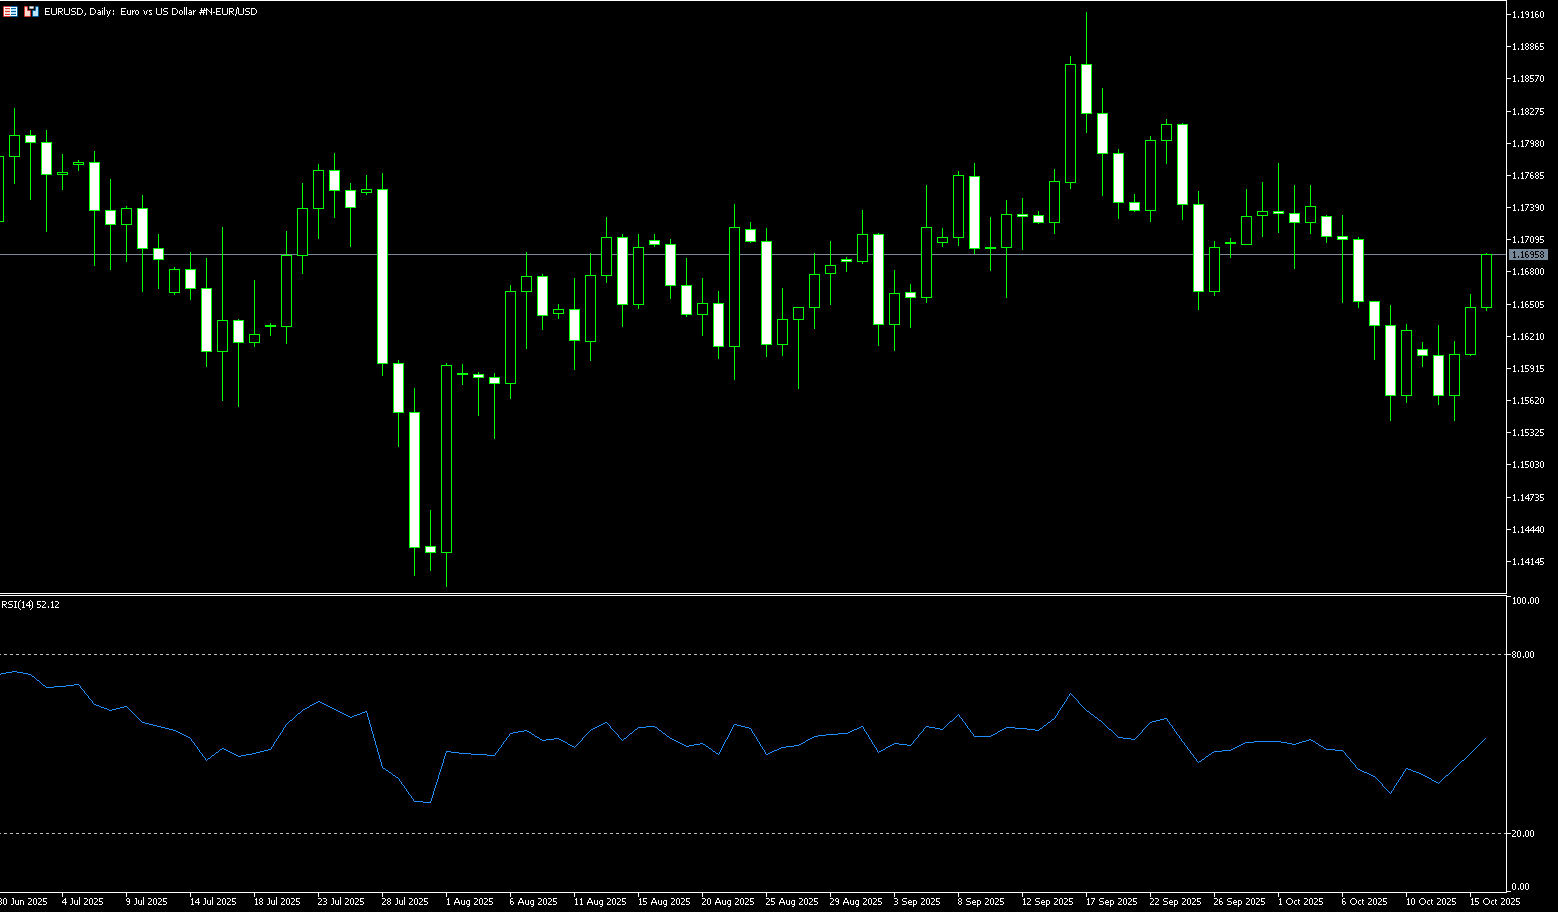
EUR/USD continued its two-day rally during Thursday's Asian trading session, approaching 1.1680. Major currency pairs rallied on firm dovish Federal Reserve expectations and ongoing trade tensions between the US and China. Traders expect a 94.6% probability of a 50 basis point rate cut by the Fed to a range of 3.50%-3.75% in the remaining period. Fed Chairman Powell also acknowledged labor market risks at a conference on Tuesday, stating, "Downside risks to the US job market have increased." Powell did not comment on potential monetary policy actions in the remaining period. In the eurozone, French Prime Minister Sebastien Lecornu's chances of surviving a no-confidence vote in his cabinet have improved after he suspended controversial pension reforms until at least after the 2027 presidential election.
The technical outlook for EUR/USD improved somewhat in late this week, but the pair remains neutral to bearish, continuing to fluctuate between the 5-day simple moving average of 1.1620 and the 1.1700 round-number mark. The 14-day Relative Strength Index (RSI) on the daily chart fell below the neutral 50 level last Friday, suggesting growing downward momentum. Immediate support lies at 1.1600, a psychologically important level. A breakout would expose 1.1542, the October 9 low, and further towards the round-number mark of 1.1500. On the upside, resistance lies at 1.1700, a break of which would open the path to 1.1800 and the July 1 high of 1.1830.
Consider a long EUR at 1.1675 today, with a stop-loss at 1.1662 and targets at 1.1720 and 1.1730.
Disclaimer: The information contained herein (1) is proprietary to BCR and/or its content providers; (2) may not be copied or distributed; (3) is not warranted to be accurate, complete or timely; and, (4) does not constitute advice or a recommendation by BCR or its content providers in respect of the investment in financial instruments. Neither BCR or its content providers are responsible for any damages or losses arising from any use of this information. Past performance is no guarantee of future results.
More Coverage


Risk Disclosure:Derivatives are traded over-the-counter on margin, which means they carry a high level of risk and there is a possibility you could lose all of your investment. These products are not suitable for all investors. Please ensure you fully understand the risks and carefully consider your financial situation and trading experience before trading. Seek independent financial advice if necessary before opening an account with BCR.

 English
 简体中文
简体中文
 繁體中文
繁體中文
 Bahasa
Melayu
Bahasa
Melayu
 Tiếng
Việt
Tiếng
Việt
 ไทย
ไทย
 日本語
日本語
 한국어
한국어
 ភាសាខ្មែរ
 español