


0
Currency & Commodity Analysis:
US Dollar Index
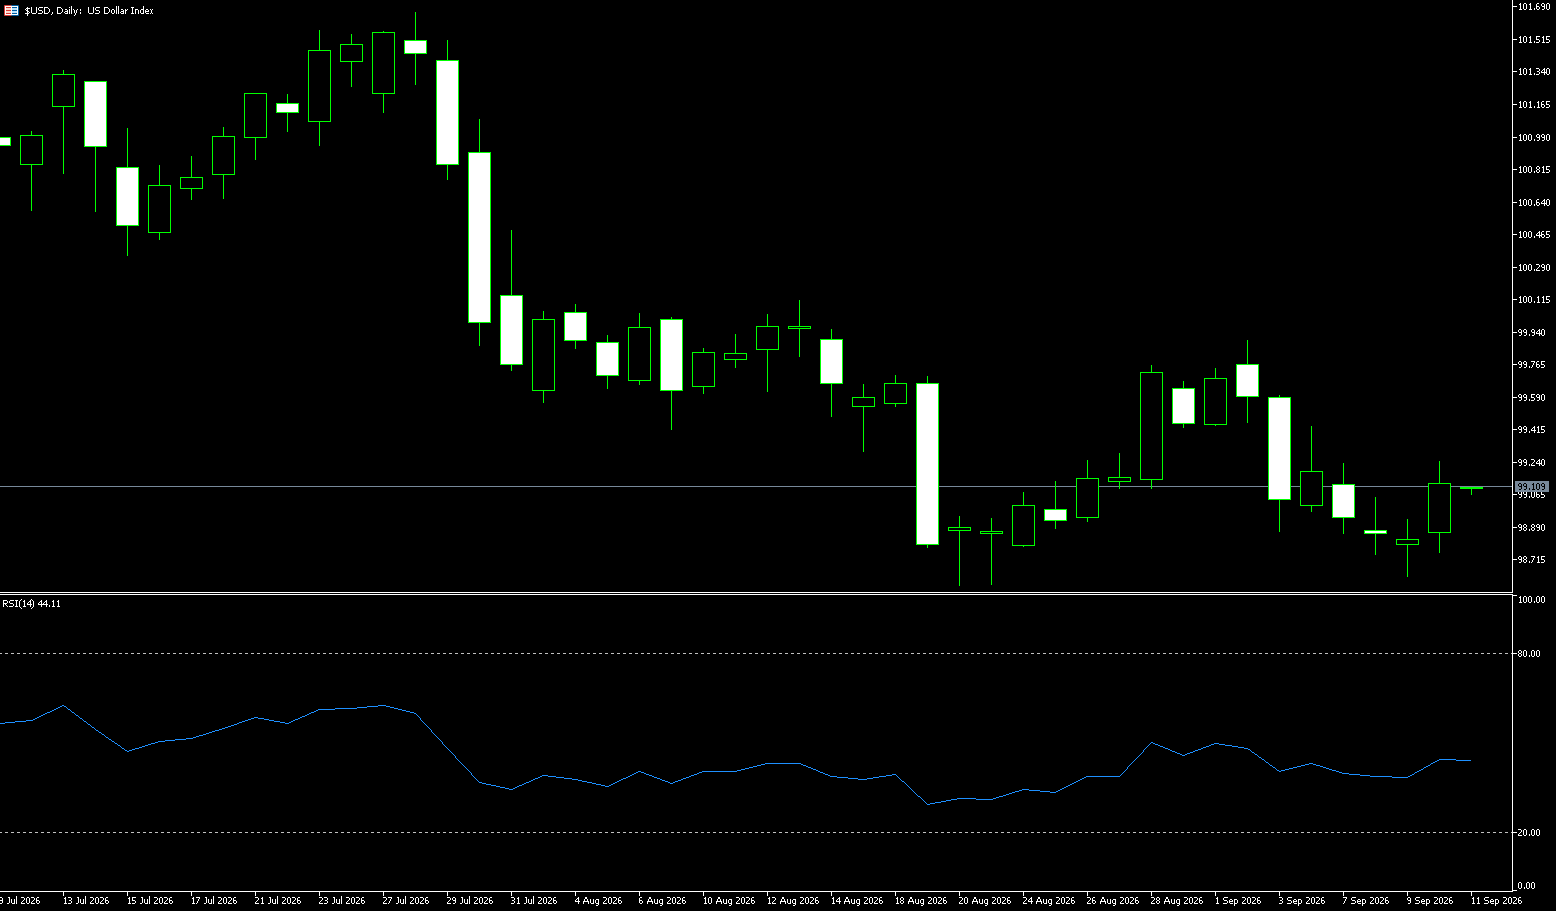
The US Dollar Index held above the 101 level on Thursday, hovering near a two-month high, as stronger-than-expected economic data fueled inflation concerns and reinforced expectations for further policy tightening. Data from S&P Global showed that US private-sector activity expanded in September at its fastest pace in over five years, with improvements in both the services and manufacturing sectors despite mounting inflationary pressures. Several Federal Reserve officials reiterated their support for last week's rate hike while warning of persistent inflation risks. Markets currently price in a roughly 70% probability of a Federal Reserve rate hike in October, up from 55% the previous day. Meanwhile, uncertainty surrounding US-Iran negotiations kept oil prices elevated, further adding upward pressure on inflation expectations.
From a daily chart perspective, the US Dollar Index is currently trading just above the 101 level. Having reclaimed the 5-day (100.69) and 50-day (99.90) exponential moving averages (EMAs), the index maintains a bullish short-term trend. These two moving averages now form a key support zone below. The 14-day RSI has risen to 71.91—entering overbought territory—indicating a significant surge in bullish momentum; however, this also suggests an increasing likelihood of consolidation or a technical pullback following further short-term gains. In the short term, the area around the 5-day EMA (100.69) has become a critical price level after the bulls regained control. If the dollar holds firm above 100.69 and extends its advance, the market will focus on resistance near the previous high of 101.50 (July 29 high) and the 102.00 psychological level. Conversely, should the dollar pull back, the initial focus will be on support at the 5-day EMA (100.69); a break below this level would shift the focus toward the 50-day EMA (99.90).
Consider shorting the US Dollar Index at 101.35 today; stop-loss: 101.45; targets: 100.80, 100.90.
WTI Spot Crude Oil
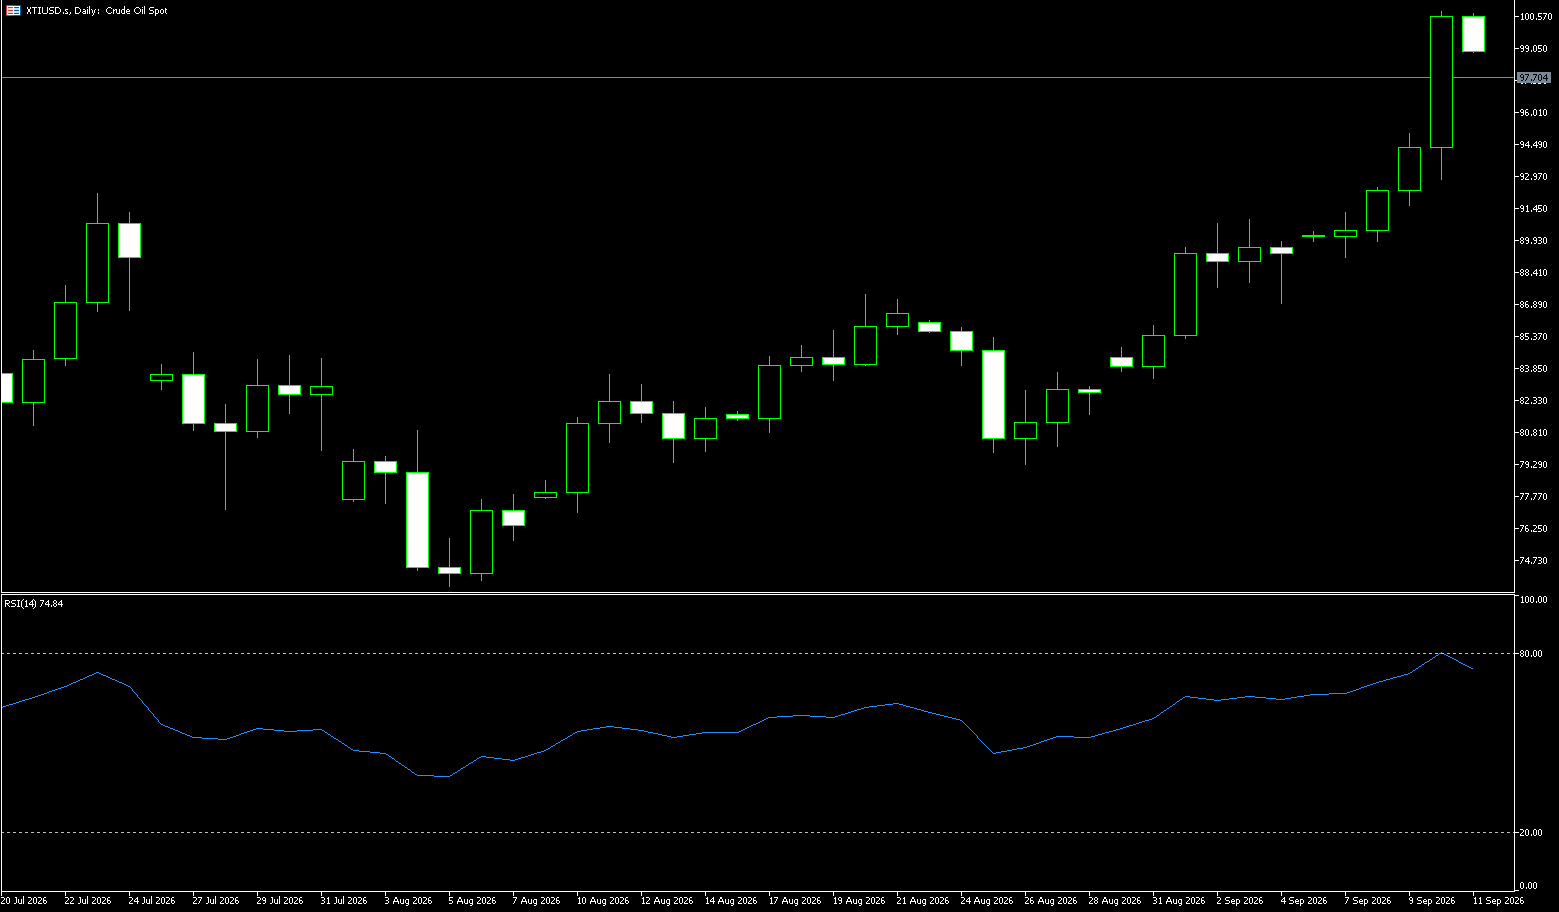
US crude oil is trading near $94.00 per barrel. Prices rose on Wednesday as the market weighed two factors: Iranian President Pezeshkian’s statement at the UN General Assembly—affirming that Tehran would never yield to the US while still believing in diplomacy—and US President Trump’s threat from the previous day to potentially "totally destroy" Iran. Iran's core demand is the lifting of the crude oil blockade to urgently export stockpiled oil and avoid permanent damage to oilfield production capacity; issues regarding assets and the "Axis of Resistance" serve primarily as additional bargaining chips. Current price trends reflect market expectations for a potential agreement allowing passage. If positive news materializes, prices might briefly dip before rebounding; whether they continue to fall thereafter depends on potential tail risks—such as Iran proposing strait transit fees or the US increasing pressure over the nuclear issue (noting that WTI prices once dropped to around $70 after the strait was previously opened).
On the WTI daily chart, the Bollinger Bands show a middle band at $92.64/bbl, an upper band at $101.95/bbl, and a lower band at $83.32/bbl. After pulling back from near the upper band, the price is currently trading just above the middle band ($92.64). MACD parameters show DIFF at 3.08 and DEA at 3.77, with the MACD histogram at -1.38; the fast line has crossed below the slow line, and the histogram has shifted from positive to negative. These readings regarding volatility bandwidth and momentum indicate that the bandwidth remains wide, suggesting that the volatility resulting from the earlier price surge has not yet subsided. Volatility lows at $88.40/bbl and $88.30/bbl—observed earlier—reflect price action from late August. The 52-week trading range spans from $58.72 to $126.41 per barrel, highlighting that crude oil pricing this year has consistently occurred within a framework of high volatility. From a technical perspective, oil prices show a need to rebound toward the $95.00 round-number mark and the $96.57 level (Monday's high); however, as the upward structure has been broken, there remains a possibility of further decline following any rebound. Target levels are $90.00 (round-number mark) and $88.30 (September 23 low).
Consider going long on crude oil at $93.70 today; stop-loss: $93.55; targets: $95.00, $96.00.
Spot Gold
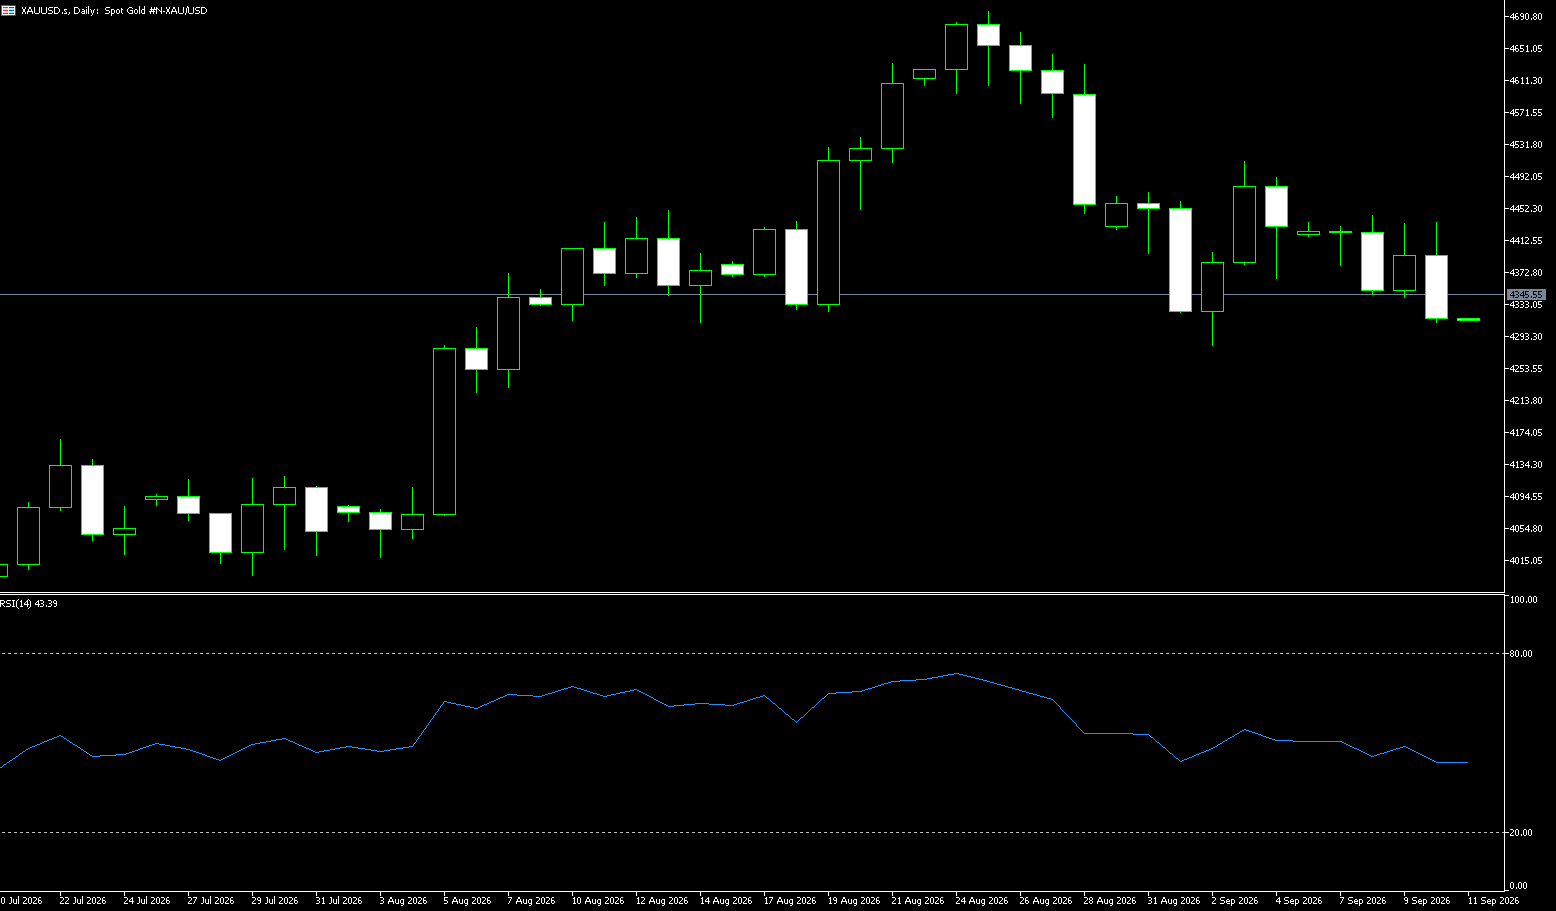
In early trading on Thursday, spot gold traded near $4,280.00 per ounce. Gold prices hit a one-week low on Wednesday as Federal Reserve policymakers signaled a hawkish stance, reinforcing expectations for interest rate hikes and pushing the US dollar to a two-month high. Meanwhile, WTI crude oil has fallen more than 10% since the close last Tuesday, driven by news of easing US-Iran tensions and reports that Saudi Arabia is preparing to restart the East-West Pipeline—an oil transport route that bypasses the Strait of Hormuz. Every one-dollar drop in crude oil prices undermines a core logic supporting expectations for higher global interest rates. This interrelationship is currently the primary driver of short-term gold price fluctuations. Rising energy prices directly fuel inflation, and gold has become increasingly sensitive to whether inflationary pressures are persistent or transitory. While gold prices sometimes surge on news of geopolitical tension, they may weaken the following day even if negative geopolitical news persists. The market no longer trades gold merely as an indicator of panic; instead, it is trading the chain reactions resulting from oil price movements.
The pullback in crude oil prices has weakened the short-term inflationary momentum that previously supported gold during geopolitical conflicts. However, unresolved tensions between the US and Iran continue to generate geopolitical safe-haven buying for precious metals, and energy price risks remain a factor in the Federal Reserve's policy deliberations. For spot gold bulls, the next upside target is to push the price back into the resistance zone at $4,342 (5-day Simple Moving Average); a decisive break above this level would target $4,376.00 (5-day SMA), followed by the $4,400 psychological level. For bears, the short-term downside target is a break below the $4,291.00 support level, with subsequent targets at $4,222.00 (lower Bollinger Band) and then $4,200 (psychological level). The first resistance level is $4,342 (5-day SMA), followed by $4,376.00 (5-day SMA).
Consider going long on gold at $4,270 today; stop-loss at $4,260; targets: $4,330 and $4,340.
AUD/USD
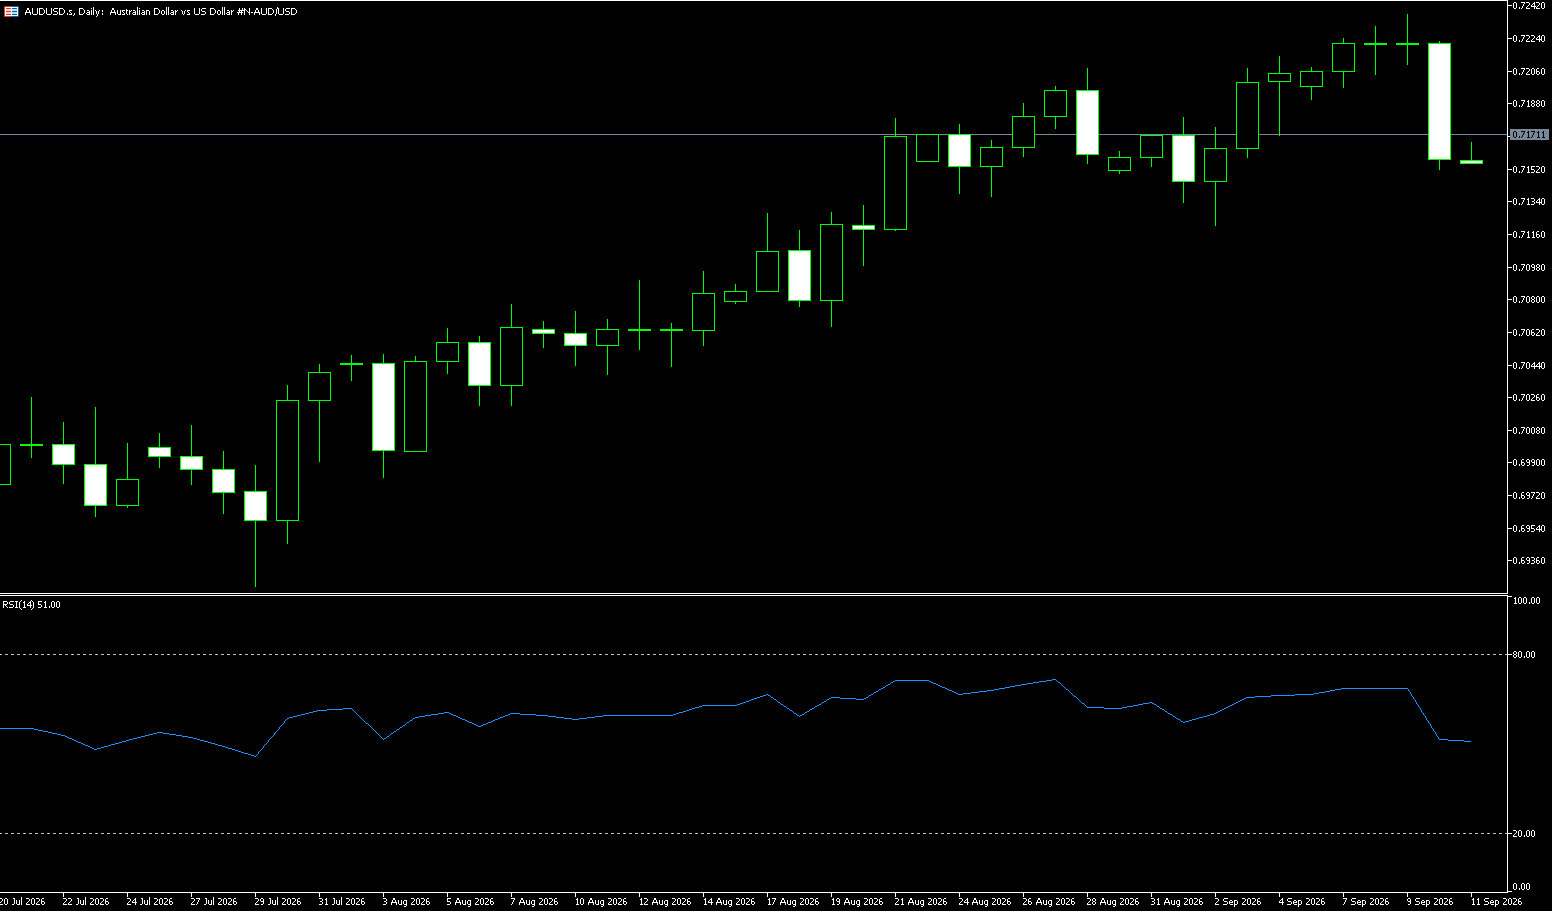
The Australian dollar fell to a seven-week low near $0.70, as a strengthening US dollar and a renewed sell-off in global bond markets pressured risk-sensitive currencies. This decline occurred despite Australia adding 39,500 jobs in August—well above the forecast of 20,000. However, the unemployment rate ticked up to 4.6%—a five-year high—highlighting the complexities of labor market conditions. While this report was the last major economic data release before the Reserve Bank of Australia's September 28–29 meeting, persistent inflation risks keep the possibility of further rate hikes on the table. Markets price in a 95% probability of a 25-basis-point hike to 4.60% in September, with rates potentially peaking around 5.10%. Meanwhile, uncertainty surrounding US-Iran negotiations has kept oil prices elevated, fueling inflation fears and the global bond market sell-off; simultaneously, robust US business activity has boosted bets on further Federal Reserve rate hikes, driving the US dollar higher.
On the daily chart, AUD/USD is trading at 0.7020. The pair maintains a short-term bearish tone as the price has retreated below the 55-day and 100-day simple moving averages (SMAs), which are currently clustered just above 0.7080. The pair is barely holding above the 200-day SMA at 0.7021; however, the Relative Strength Index (RSI) sits at 35, indicating waning bullish momentum following the recent pullback, while the Average Directional Index (ADX) is around 24, suggesting a downtrend is forming but has not yet gained significant strength. On the upside, initial resistance lies at the 100-day SMA near 0.7073 and the 50-day SMA around 0.7092. On the downside, immediate support coincides with the 200-day simple moving average (SMA) at 0.7021; lower structural support is found at 0.7000 (a psychological level), followed by deeper historical support at 0.6946 (the July 30 low).
Consider going long on the AUD at 0.7010 today; stop-loss: 0.7000; targets: 0.7050, 0.7060.
GBP/USD
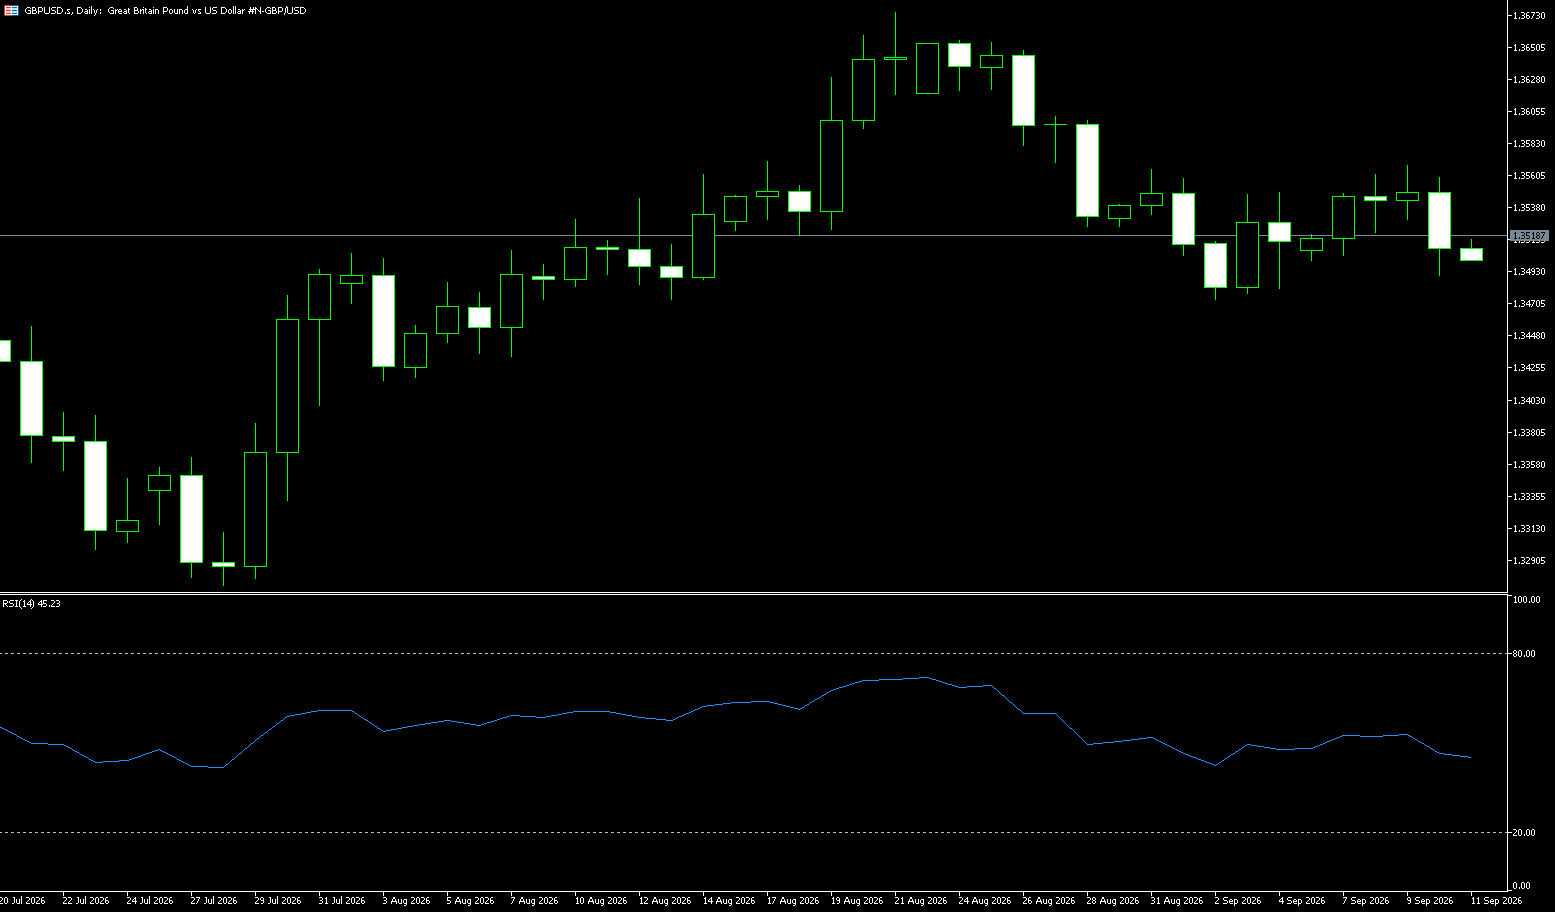
The British pound depreciated sharply to around 1.3220 USD—its lowest level since late June—as the US dollar strengthened following better-than-expected Purchasing Managers' Index (PMI) data and a series of hawkish remarks from Federal Reserve policymakers. These developments heightened expectations for further monetary tightening in the US, putting pressure on the pound. Rising oil prices, amidst ongoing uncertainty regarding US-Iran negotiations, also weighed on risk-sensitive assets. In the UK, the latest PMI survey indicated that business activity continued to expand in September, albeit at a slightly slower pace that fell short of market expectations. Despite the softer data, the market continues to price in a significant probability of a 25-basis-point rate hike by the Bank of England in November.
On the daily chart, GBP/USD maintains a bearish tone, with the spot price remaining below all key reference levels. The exchange rate has even dipped below the lower Bollinger Band, while the 9-day (1.1367) and 14-day (1.1426) SMAs reinforce the downward bias, as the pair trades well below these structural markers. The Relative Strength Index (RSI) stands at 25.44—deep in oversold territory—suggesting that while selling pressure remains dominant, the pace of the decline may be starting to slow. On the upside, initial resistance appears at the 1.3300 round-number level, which now serves as the first hurdle for any corrective rebound. Above, the 14-day Simple Moving Average (SMA) forms a strong resistance zone; the price needs to reclaim this area to alleviate current bearish pressure. On the downside, initial support lies at 1.3200 (a psychological level), followed by the June 24 low of 1.3140. If further selling pushes the price below this level, the 1.3000 psychological mark could come into play.
Consider going long on GBP at 1.3210 today; Stop Loss: 1.3200; Targets: 1.3260, 1.3270.
USD/JPY
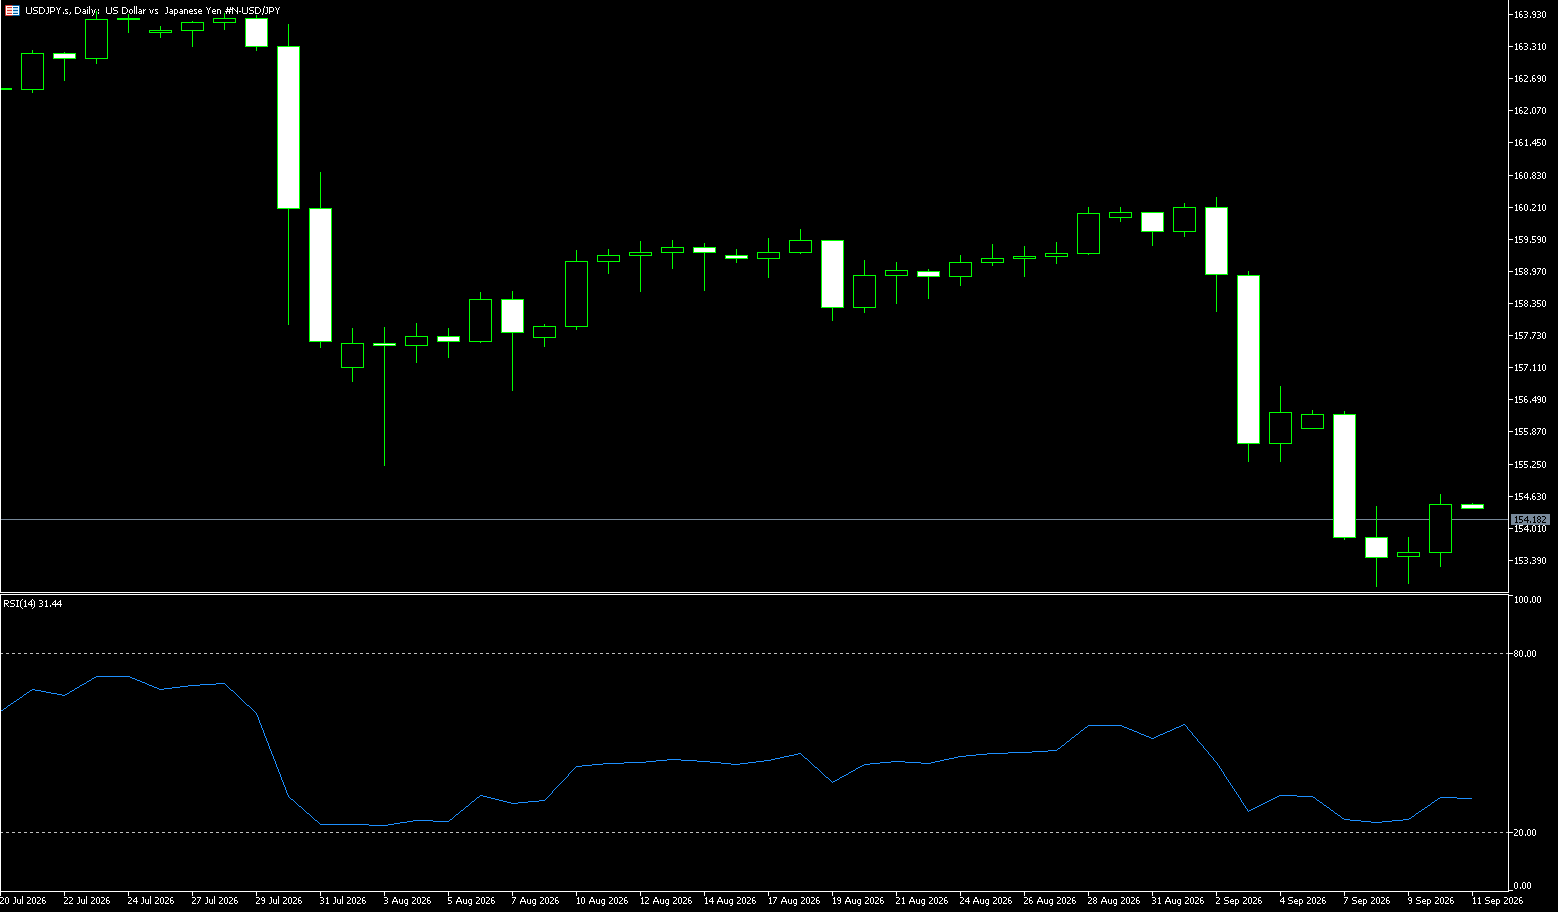
The Japanese yen depreciated to beyond 158.60 per dollar on Thursday, hovering near a three-week low, as the greenback strengthened following robust US private-sector activity data that fueled expectations of further Federal Reserve rate hikes. Rising Treasury yields and elevated oil prices also highlighted growing inflation risks, placing further pressure on the yen. Meanwhile, traders remain wary of potential intervention as the currency approaches the closely watched 160 level, with reports indicating the Bank of Japan conducted a rate check with market participants last Friday. The Bank of Japan's rate hike last week was perceived as insufficiently hawkish, with two officials dissenting from the decision. Separately, S&P Global data showed Japan's manufacturing growth slowed to a seven-month low in September, with decelerating growth in output and new orders.
On the daily chart, USD/JPY trades near 158.60, maintaining a short-term bearish bias as the spot price remains below the 50-day exponential moving average (EMA) at 157.70. Trading below this short-term trend indicator suggests that upside attempts will likely be limited amidst weak momentum; the 14-day Relative Strength Index (RSI) hovers around 54, indicating weak demand without yet entering oversold territory. On the upside, immediate resistance lies at Thursday's high of 158.90—the first hurdle for any rebound—reinforcing the bearish tone as long as prices remain below it. With no clear immediate support level in the data, market focus remains on whether sellers can sustain pressure below 159.56, as a decisive break above the psychological 160.00 level would be required to alleviate the current downward bias; regarding support, attention is focused on the 30-day EMA at 157.39—which has capped daily closing prices since September 2—with the 157.00 mark serving as the next level to the downside.
Consider shorting the US Dollar at 158.95 today; stop-loss: 159.10; targets: 157.90, 158.00.
EUR/USD
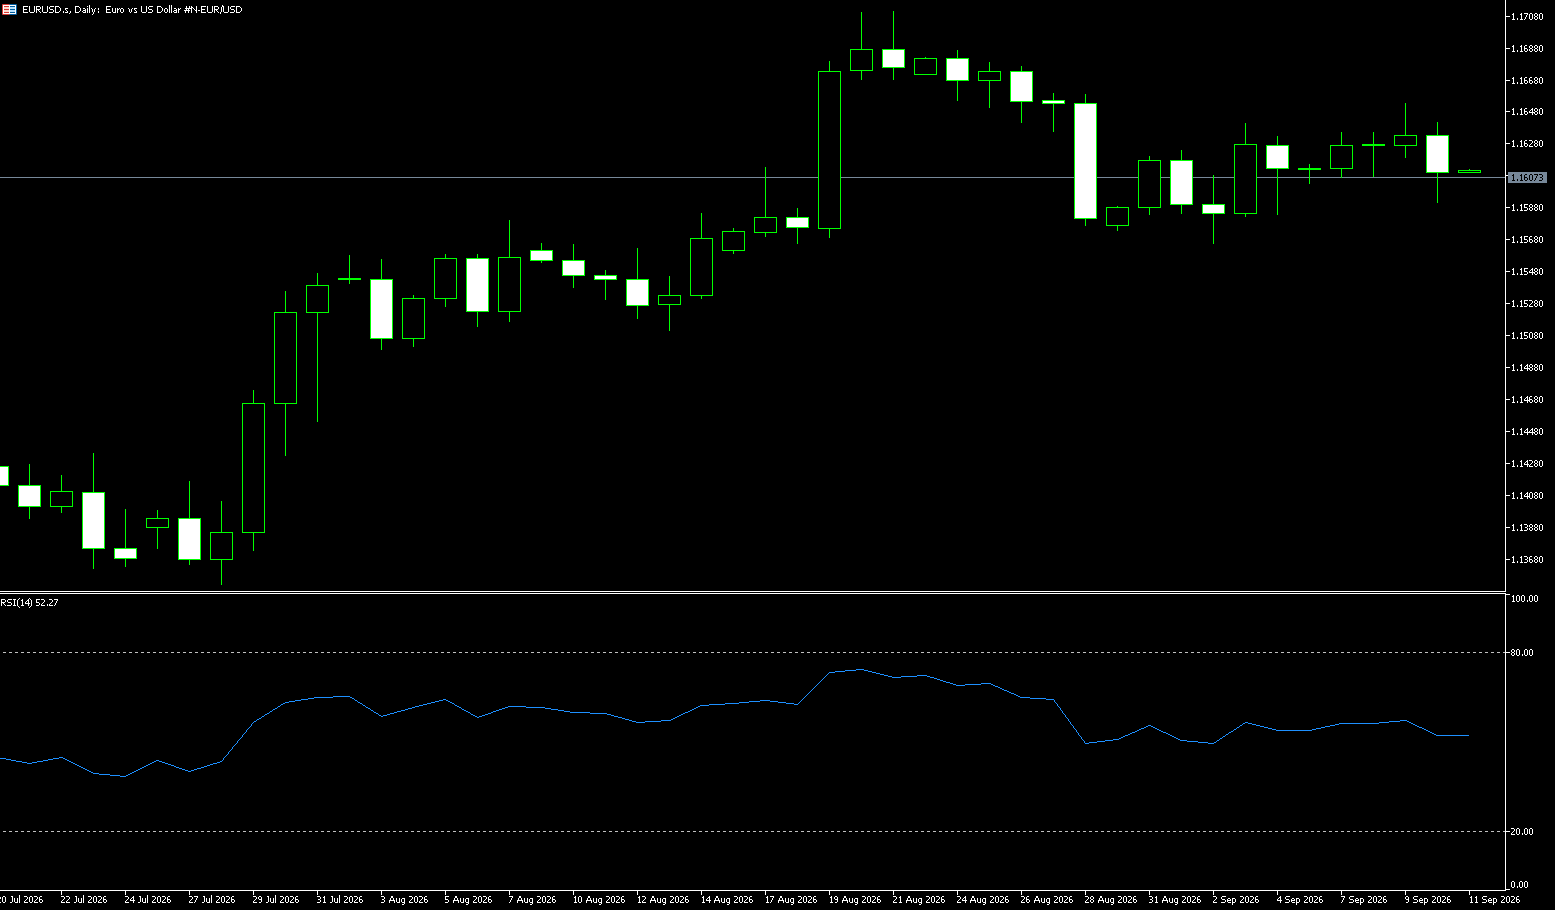
The Euro continued to slide after breaking below $1.14, hitting a fresh low in nearly two months. This decline was driven by a strengthening US Dollar—fueled by better-than-expected US PMI data and a series of hawkish remarks from Federal Reserve policymakers—which heightened expectations for further monetary tightening. A rebound in oil prices, coupled with ongoing uncertainty regarding US-Iran negotiations, also weighed on risk-sensitive assets. Meanwhile, investors digested PMI data showing Eurozone private-sector activity expanding at its fastest pace in nearly three and a half years in September, reinforcing expectations that the European Central Bank (ECB) might raise interest rates further this year. ECB official Joachim Nagel stated on Tuesday that oil prices are becoming an increasingly important factor in monetary policy decisions, leaving room for further rate hikes.
The daily Relative Strength Index (RSI-14) has fallen to 25.59, indicating oversold conditions; while this may slow further downside, it does not yet signal a lasting bottom for the EUR/USD pair. Additionally, the Moving Average Convergence Divergence (MACD) remains below the zero line with a negative value near -0.0025, suggesting that bearish momentum persists despite the risk of short-term technical rebounds—which would likely fade quickly near the 1.1420 supply zone. On the downside, the area around 1.1325—a one-year low hit in June—may offer some support, followed by the 1.1300 level; a break below this could see the pair test the 61.8% Fibonacci extension at 1.1244. At the same time, the oversold RSI reading and negative MACD structure may act as momentum-based support rather than marking a precise price floor. Furthermore, traders are likely to view any rallies toward 1.1425 and 1.1465 (the 9-day moving average) as opportunities to reassess the strength of the broader downtrend.
Consider going long on the Euro at 1.1370 today; stop-loss: 1.1360; targets: 1.1420, 1.1430.
Stock Analysis:
Australia ASX 200 Index
Market Overview:
The ASX 200 index fell 63 points (0.7%) to close at 8,702 on Thursday, snapping a recent rally. This decline followed a drop in US stock index futures driven by concerns over further Federal Reserve policy tightening—following the first rate hike since 2023 last week. Domestically, traders weighed the risk of a hawkish move by the Reserve Bank of Australia (RBA) at next week's meeting, given persistent inflation. However, the market pared earlier losses after data showed the unemployment rate rose to 4.6% in August—slightly above expectations. Governor Bullock had previously noted that an unemployment rate in the 4.5%–5.0% range could help curb inflation. Weak performance in manufacturing, non-energy mining, and business services was partially offset by strength in energy and logistics.
A stronger US dollar and softer copper prices weighed on resource stocks; BHP and Rio Tinto fell 1.8% and 1.2%, respectively. The "Big Four" banks dropped between 1.0% and 1.9%, while other notable decliners included Pilbara Minerals (-6.1%) and HUB24 (-3.5%). Energy stocks bucked the trend, supported by gains in Santos (2.1%) and Woodside Energy (1.5%).
Sector Performance:
Top-performing sectors: Utilities and Healthcare (defensive sectors attracting safe-haven inflows); some tech stocks recovered late in the session; Soul Patts hit an all-time high.
Worst-performing sectors: Financials (Big Four banks under pressure), heavyweight mining stocks, and the energy sector, all of which dragged the index lower.
Technical Analysis:
The ASX 200 closed at 8,702 points, down 63.3 points (0.72%). After hitting an intraday low, the index staged a late-session rebound to avoid a three-month low, ultimately closing in the lower-middle range of the day's trading. Intraday Market Action: The index plunged sharply in early trading following Australian employment data (unemployment rate rose to 4.6%). Capital inflows into defensive and technology sectors subsequently drove a recovery from the lows, narrowing the intraday decline; however, bullish momentum remained weak, preventing a return to positive territory, and the daily candle closed bearish. Daily Chart: Closed bearish; price retested the key support zone around 8700. Short-term moving averages have turned downward to act as resistance, creating an overhead resistance band. RSI: Retreated to the lower-neutral range without entering oversold territory, indicating that bearish momentum has not yet been fully exhausted. Volume: High volume on the decline and low volume on the rebound—a classic structure of a weak rebound.
Friday (Sept 25) Technical Outlook: The daily chart currently shows a weak, range-bound pattern. On Friday, the priority is to assess the validity of support levels; any rebound is likely corrective in nature, with questionable sustainability. Friday Scenario Analysis: Bearish Scenario (Higher Probability): Opening continues Thursday's weakness, testing the 8675 support level; if 8675 is decisively broken, the index will seek support near 8600. Rebound/Correction Scenario: Support at 8675 holds; bulls attempt a counter-attack, challenging 8775. Only by establishing a firm position above 8800 on high volume would the short-term bearish structure be temporarily broken; otherwise, it remains merely a weak rebound. If the market opens with narrow fluctuations between 8675 and 8775 lacking clear directional signals, a "wait-and-see" approach is advised—entering the market only after a breakout to avoid losses from whipsaw volatility.
Trading Strategy (Short-term Perspective)
Bullish Strategy: Consider long positions only if the price stabilizes near 8675 and clear signs of a bottoming-out appear on the intraday chart. Target: 8750–8775; Stop-loss: Below 8660. Strictly avoid chasing highs; if the rebound stalls at the 8775/8800 resistance zone, bulls should consider reducing positions or exiting. Bearish Strategy: If the price rebounds to the 8775 resistance zone but faces rejection and fails to break through on high volume, consider opening a small short position. Initial target is 8675, with a secondary target of 8600 if the level breaks; place the stop-loss above 8810.
Key Risk Warnings:
1. Macro Data Risks: RBA interest rate expectations, overnight US stock/bond yield movements, and AUD exchange rate fluctuations directly impact major banks and resource stocks, potentially causing price gaps in the index.
2. Sector Risks: The mining sector tracks iron ore and copper prices; the "Big Four" banks are index heavyweights, and changes in net interest margin expectations can trigger significant volatility.
3. Trading Timing Risks: As Friday is the final trading day of the week, capital flows driven by weekend risk-aversion and position-closing often amplify late-session volatility and increase the risk of slippage.
4. Technical Breakdown Risks: If the strong support level at 8600 fails, the short-term trend will shift toward a deep decline; avoid blindly "buying the dip."
New Zealand Stock Index (NZX 50)
Market Overview:
The NZX 50 closed slightly changed at 13,825 points on Thursday, following a decline in the previous session and an initial rise in early trading. Gains in the energy, industrial, and financial sectors were offset by losses in technology, communication services, and real estate. Traders remained cautious amidst rising oil prices and uncertainty regarding US-Iran negotiations. Recently, Reserve Bank of New Zealand Governor Anna Bremner warned that inflation could rise further if high oil prices persist. Traders are also exercising caution while awaiting the outcome of the summit between Trump and Xi Jinping, where artificial intelligence and tariffs are expected to be discussed. In the US, Wall Street closed lower overnight as a surge in Treasury yields triggered a market sell-off and heightened expectations for Federal Reserve interest rate hikes.
Briscoe Group fell 4.2%, Gentrack Group dropped 3.7%, ANZ Group declined 2.5%, and Mainfreight fell 0.7%; meanwhile, Colonial Motor, Delegat Group, and Freightways Group rose 3.7%, 1.4%, and 0.7%, respectively. Sector Performance:
Top Gainers: Utilities, Infrastructure, Banking & Finance (ANZ, Westpac)
Top Losers: Selected Healthcare, Consumer Retail
Technical Analysis:
The NZX 50 index closed at 13,825 on Thursday. After an intraday rally followed by a pullback, it finished almost flat, recovering from the previous session's decline. The 52-week high stands at 14,069.22. As a small-cap offshore market, the NZX 50 is characterized by relatively high volatility and liquidity risk. Regarding price structure, the index surged early in the session but gradually surrendered its intraday gains, closing at 13,825 and forming a pattern resembling a "Doji" (indicating indecision). The candlestick reflects a tug-of-war between bulls and bears at a high level: bulls attempted a rebound but were suppressed by selling pressure, failing to hold higher ground; meanwhile, buying support underneath was decent, preventing a further breakdown. Divergence across sectors was evident: Energy, Industrials, and Financials strengthened, while Technology, Communication Services, and Real Estate weakened; this sectoral offsetting resulted in the index trading sideways overall. This consolidation represents a stabilization and recovery following the previous day's drop, with no clear reversal signal yet established.
Technical Outlook for Friday (Sept 25): Overnight, US stocks fell and Treasury yields rose, dampening global risk appetite. Oil prices climbed, and the Reserve Bank of New Zealand (RBNZ) Governor warned that sustained high oil prices could drive up inflation, raising market concerns that the central bank might maintain high interest rates. Coupled with uncertainties regarding geopolitics and trade talks, capital remains cautious. Trading volume has not surged significantly; the market is largely in a "wait-and-see" mode with no signs of fresh capital entering to drive a breakout. Scenario analysis for Friday: Bullish scenario (upside breakout)—the index opens and holds above 13,850, bulls gain momentum and test the 13,930 level; upon establishing a position above 13,930 on increased volume, the target shifts toward the 14,000 mark, testing the previous high of 14,069. Bearish Scenario (Breakdown): If the price falls below the 13,740 support level and fails to recover quickly, the trend shifts from consolidation to weakness, with the next target at 13,650; if 13,650 is breached, it opens up room for a deeper correction from recent highs.
Trading Strategy:
Operational Strategy (Short-term perspective; suitable for Hang Seng Index / HSI Futures traders)
Bullish Approach
• If the price pulls back to the 13,740 area, stabilizes, and closes with a bullish candle, initiate a small long position; place the stop-loss below 13,640.
• If the price breaks above 13,930 on high volume, add to the long position; targets are 14,000/14,069. Take profits in stages once the price approaches the previous high.
Bearish Approach
• If the price rebounds to the 13,930–14,000 resistance zone but faces rejection and closes with a bearish candle, initiate a small short position; place the stop-loss above 14,080.
• If the price decisively breaks below 13,740, add to the short position following the trend; the target is 13,650.
Key Risk Warnings:
1. Market Structure Risk: The NZX50 is a small market with the index highly concentrated in a few heavyweight stocks; unusual movement in a single heavyweight stock can drive significant index volatility. Liquidity is low, and the risk of slippage is higher compared to US or Hong Kong markets.
2. External Transmission Risk: High dependence on overnight US stock performance, US Treasury yields, and commodity prices. Sudden volatility in external markets can easily lead to gap openings, potentially preventing stop-loss orders from executing at the preset price.
3. Local Macroeconomic Risk: Factors include New Zealand inflation, central bank interest rate hike expectations, and NZD exchange rate fluctuations. The market has a high proportion of export-oriented companies, and a strengthening NZD can suppress corporate earnings.
4. Geopolitical and Event Risk: Factors such as oil prices, international trade negotiations, and the situation in the Middle East can easily trigger rapid shifts in market sentiment, causing established trading ranges to break at any time.
Disclaimer: The information contained herein (1) is proprietary to BCR and/or its content providers; (2) may not be copied or distributed; (3) is not warranted to be accurate, complete or timely; and, (4) does not constitute advice or a recommendation by BCR or its content providers in respect of the investment in financial instruments. Neither BCR or its content providers are responsible for any damages or losses arising from any use of this information. Past performance is no guarantee of future results.
Lebih Liputan






2026 © - All Rights Reserved by BCR Co Pty Ltd
Pendedahan Risiko:Instrumen derivatif diniagakan di luar bursa dengan margin, yang bermakna ia membawa tahap risiko yang tinggi dan terdapat kemungkinan anda boleh kehilangan seluruh pelaburan anda. Produk-produk ini tidak sesuai untuk semua pelabur. Pastikan anda memahami sepenuhnya risiko dan pertimbangkan dengan teliti keadaan kewangan dan pengalaman dagangan anda sebelum berdagang. Cari nasihat kewangan bebas jika perlu sebelum membuka akaun dengan BCR.
BCR Co Pty Ltd (No. Syarikat 1975046) ialah syarikat yang diperbadankan di bawah undang-undang British Virgin Islands, dengan pejabat berdaftar di Trident Chambers, Wickham’s Cay 1, Road Town, Tortola, British Virgin Islands, dan dilesenkan serta dikawal selia oleh Suruhanjaya Perkhidmatan Kewangan British Virgin Islands di bawah Lesen No. SIBA/L/19/1122.
Open Bridge Limited (No. Syarikat 16701394) ialah syarikat yang diperbadankan di bawah Akta Syarikat 2006 dan berdaftar di England dan Wales, dengan alamat berdaftar di Kemp House, 160 City Road, London, England, EC1V 2NX. Open Bridge Limited bertindak semata-mata sebagai pemproses pembayaran untuk BCR Co Pty Ltd dan tidak menyediakan sebarang perkhidmatan kewangan, perdagangan atau pelaburan bagi pihaknya. Peranan Open Bridge Limited adalah terhad kepada pemprosesan pembayaran.


 English
 简体中文
简体中文
 繁體中文
繁體中文
 Bahasa
Melayu
Bahasa
Melayu
 Tiếng
Việt
Tiếng
Việt
 ไทย
ไทย
 日本語
日本語
 한국어
한국어
 ភាសាខ្មែរ
 español