


0
Currency & Commodity Analysis:
US Dollar Index (DXY)
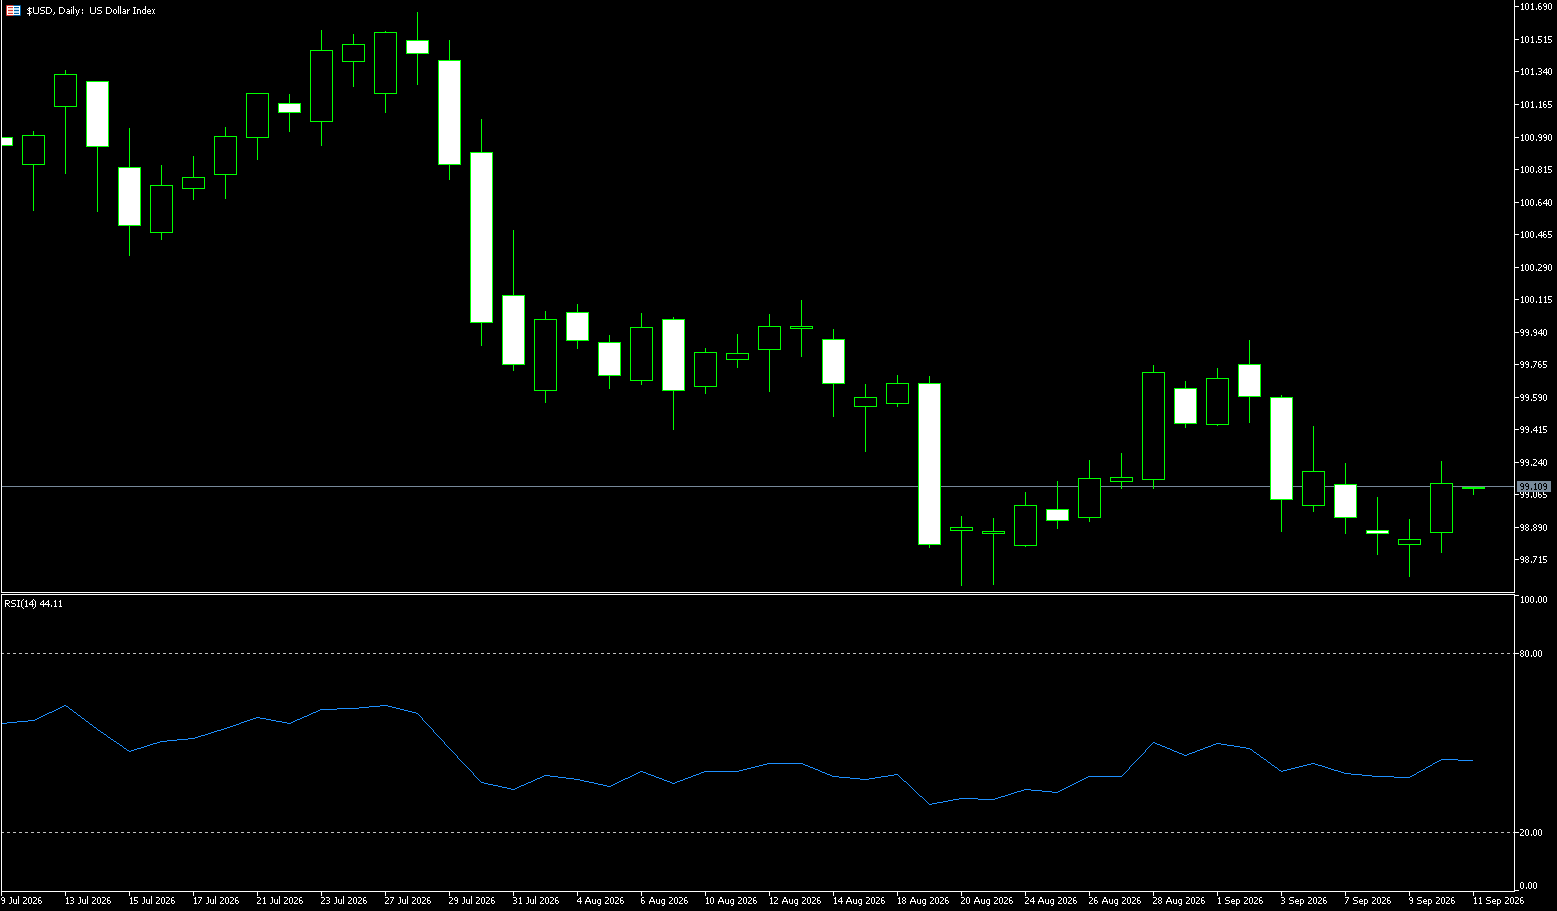
The US Dollar Index held steady around 100.40 on Monday following a sharp rise last week. Investors are awaiting speeches from multiple Federal Reserve officials this week for further clues regarding the monetary policy outlook. On Sunday, Minneapolis Fed President Neel Kashkari stated that inflation remains too high and that price pressures have extended beyond the initial oil price shock associated with the conflict involving Iran. Chicago Fed President Austan Goolsbee is scheduled to speak later on Monday, followed by an address from New York Fed President John Williams on Tuesday. Last week, the US Dollar Index rose more than 1% after the Federal Reserve raised interest rates and signaled at least one more hike this year, with Chair Powell reiterating the central bank's commitment to controlling inflation. The Bank of Japan also raised rates as expected—albeit with two policymakers dissenting—suggesting the central bank may be more cautious about further hikes than previously anticipated, thereby putting pressure on the yen.
The US Dollar Index is currently trading near 100.35 on the daily chart, remaining above both the 9-day (99.69) and 55-day (99.99) moving averages. The short-term moving average sits above the long-term one and maintains an upward slope, indicating a continued bullish short-term structure. The 14-day RSI is around 64; while in positive territory, it has not yet entered the typical overbought zone, suggesting bulls retain the initiative. However, the risk of chasing the rally is increasing as the index approaches previous highs. Key support levels to watch are 99.69 (near the 9-day moving average) followed by 99.43 (near the 20-day moving average). As long as the index holds above this area, the current pullback can be viewed as a technical consolidation following a strong rally; a decisive break below the 20-day moving average (99.43) would significantly weaken the short-term bullish structure and likely lead to a test of the 200-day moving average at 100.17. On the upside, focus lies on 100.50 and the recent high near 100.45; a decisive breakout and stabilization above these levels could see the market test the 101.00 psychological mark.
Consider shorting the US Dollar Index today at 100.52; Stop Loss: 100.63; Targets: 100.00, 100.10.
WTI Spot Crude Oil
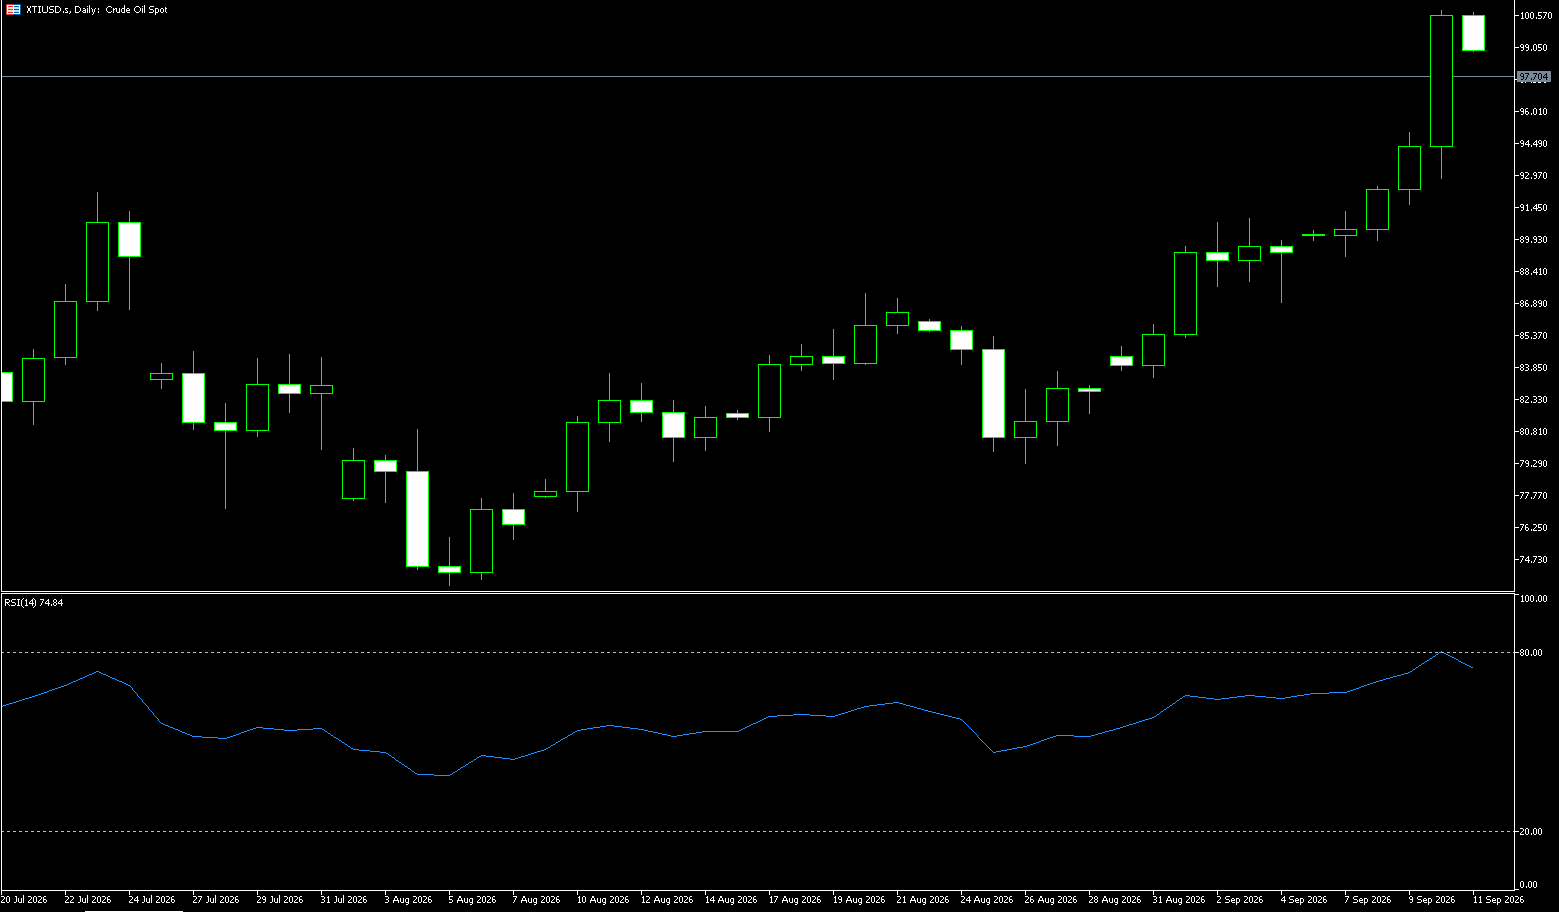
WTI crude oil prices fell below $92 per barrel on Monday—marking a fourth consecutive day of declines—after US President Trump reportedly decided against immediate airstrikes on Yemen and expressed a willingness to engage diplomatically with Iran. Trump allegedly rejected a request from Saudi Arabia to strike Houthi forces and indicated he might be open to meeting Iranian President Masoud Pezeshkian during this week's UN General Assembly. Meanwhile, despite Saudi Arabia shutting down the East-West Pipeline following the attacks, crude oil exports from the Middle East have remained resilient. Over the past six days, Saudi Arabia has shipped 2.9 million barrels of crude oil per day through the Strait of Hormuz. Satellite imagery indicates that, over the weekend, the number of supertankers (each with a capacity of 140,000 barrels) at Saudi Arabia's Gulf export terminals reached its highest level since at least June. Nevertheless, overall traffic volume through the Strait of Hormuz continues to decline.
The primary trigger for this recent pullback was China—at Saudi Arabia's request—asking Iran to curb Houthi attacks on Saudi oil infrastructure. Prior to this, oil prices had been steadily rising amidst escalating tit-for-tat attacks between the U.S. and Iran and intensified military operations by the Houthis. Diplomatic efforts have eased geopolitical tensions; meanwhile, U.S. refining capacity is expected to drop by 371,000 barrels per day next week, and retail diesel prices have hit a record high of $6.45 per gallon. Last week, the WTI daily chart displayed a "large bullish candle—medium bearish candle—small bullish candle—medium bearish candle—large bearish candle" pattern, signaling a rally followed by a retreat, with the short-term downward trend persisting. Although WTI fell 1.45% for the week, it held firm above the $90 mark, suggesting the decline is a pullback from high levels rather than a reversal of the overall trend. Consequently, support lies below at $90.01 (25-day Simple Moving Average) and $90.00 (psychological level), while resistance sits above at $94.44 (14-day Simple Moving Average) and $95.00 (round-number high).
Consider going long on crude oil at $91.30 today; stop-loss: $91.15; targets: $93.00, $94.00.
Spot Gold
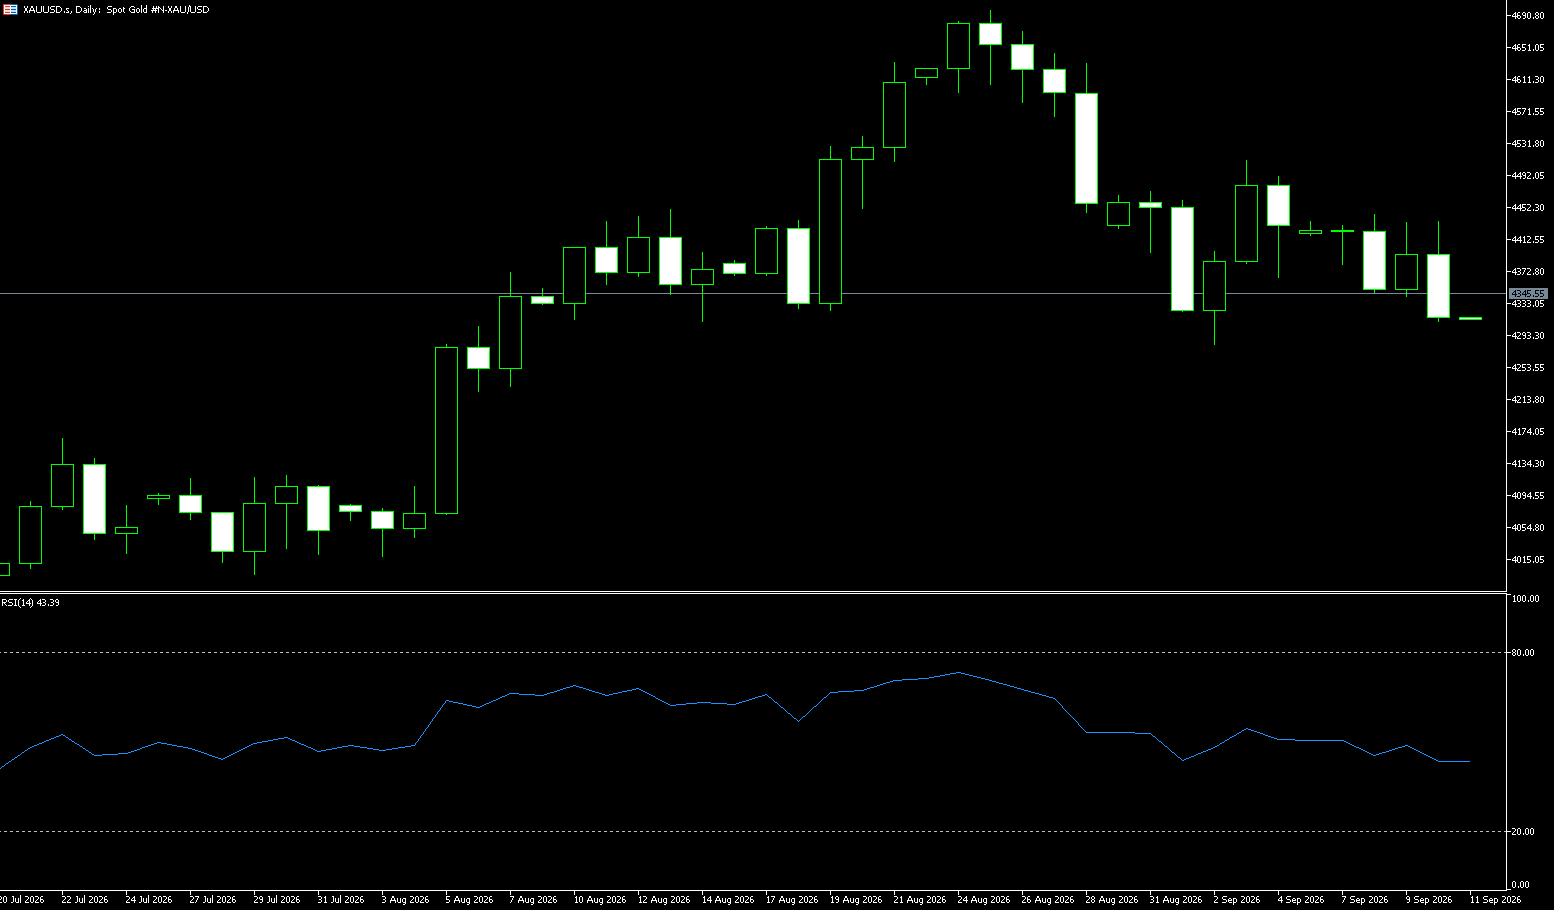
In early Monday trading, spot gold traded near $4,350 per ounce. Prices benefited as lower oil prices eased concerns regarding persistent inflation, potentially setting the stage for another test of the $4,400/oz level during the session. Last week saw a rare dynamic in the battle between bulls and bears in the precious metals market: despite headwinds from a 1.16% rise in the US Dollar Index and a 1.67% increase in 2-year US Treasury yields, spot gold still managed a weekly gain of 1.11%, rebounding after testing lows on the daily chart. Of particular interest are the results of a gold survey covering Wall Street institutions. With a subtle disconnect between the macro backdrop and market sentiment, just how robust is this rally? Reviewing the week's performance, precious metals showed surprising strength despite the traditionally bearish combination of a strong dollar and rising Treasury yields: spot gold rose 1.11% for the week, with the last five daily candlesticks forming a pattern of "bearish—small bearish—small bearish—medium bullish—small bullish," signaling a rebound from lows and a shift toward higher price levels; silver closed lower on a weekly basis but also saw a rebound on the daily chart.
Spot gold faced resistance near the 20-day Simple Moving Average of $4,407; while it remains above key Fibonacci midpoint support, the short-term bias remains bearish. The metal is hovering just above the 50% retracement level of $4,320, a point acting as a fragile floor following the recent pullback. Meanwhile, the Relative Strength Index (RSI) stands at 49.62, near neutral territory, while the Moving Average Convergence Divergence (MACD) reads -19.60, remaining in negative territory and suggesting that downward pressure persists. Consequently, initial resistance for the gold price is likely located at the 38.2% Fibonacci retracement level of $4,408, followed by the 20-day simple moving average at $4,407; stronger resistance lies at the 23.6% retracement level of $4,516 and the swing high of $4,692. On the downside, immediate support is found at the 50.0% retracement level of $4,320, with deeper Fibonacci support levels located further down at $4,232 and $4,107.
Consider going long on gold today at $4,347, with a stop-loss at $4,342 and targets at $4,380 and $4,390.
AUD/USD
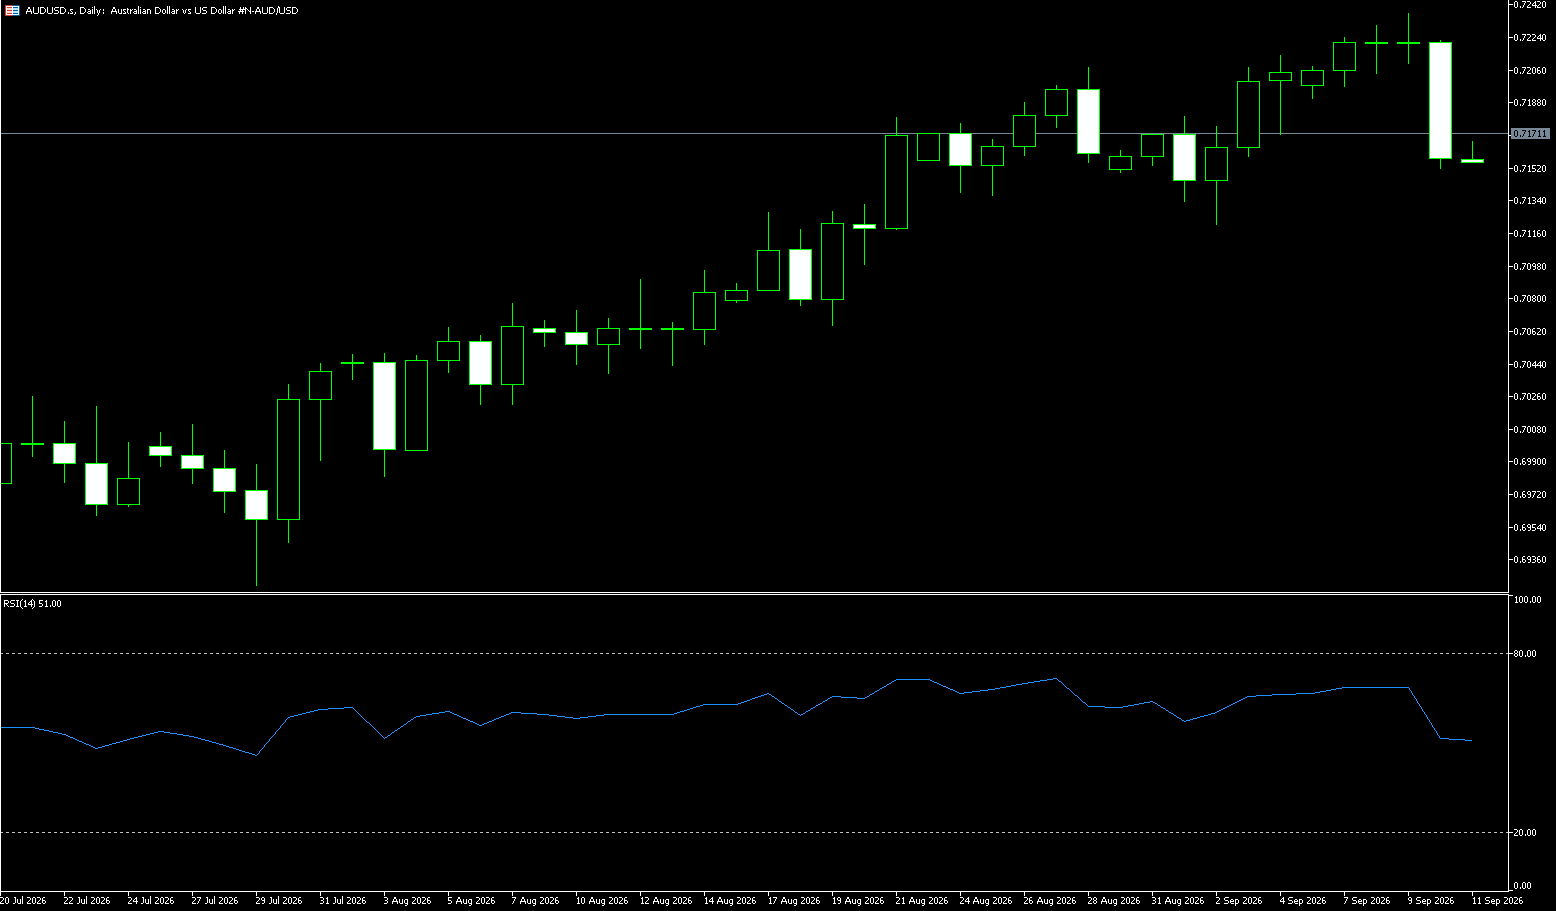
The Australian dollar rose above $0.7100, attempting to rebound from a recent four-week low, as hawkish comments from a top Reserve Bank of Australia official bolstered expectations for further policy tightening. Governor Michele Bullock stated that upside risks to inflation are emerging and warned that higher costs could make inflation more persistent, citing rising energy prices and ongoing capacity pressures within the domestic economy. Her remarks follow statements from senior Reserve Bank of Australia (RBA) officials over the past month noting that inflation remains high and requires further easing. Swap markets now anticipate at least two rate hikes by the February meeting, with an approximately 87% probability of the first hike occurring on September 29. Markets are now awaiting employment data due later this week for further clues regarding the policy outlook. Meanwhile, the risk-sensitive Australian dollar has also benefited from a pullback in oil prices, driven by signs of intensifying diplomatic efforts to resolve the Middle East conflict and restore energy flows in the region.
On the daily chart, the AUD/USD pair is trading at 0.7120, maintaining a short-term bullish bias as the price remains above the 55-day, 100-day, and 200-day simple moving averages (SMAs), which are clustered between 0.7068 and 0.7010. The 14-day Relative Strength Index (RSI) stands at 47.82, having retreated toward neutral territory, while the Average Directional Index (ADX)—near 22—indicates a trend that is directional but not strong; this suggests that any upward movement is likely to be gradual rather than a sharp surge. On the downside, initial support lies at the 100-day SMA and the nearby 0.7077 level, followed by the 65-day SMA at 0.7049 and the psychological support level at 0.7000. On the upside, AUD/USD faces initial resistance at 0.7164 (20-day SMA) and 0.7200 (a round-number level); a breakout above these would pave the way for a broader bullish extension.
Consider going long on the AUD at 0.7110 today; stop-loss: 0.7100; targets: 0.7150, 0.7160.
GBP/USD
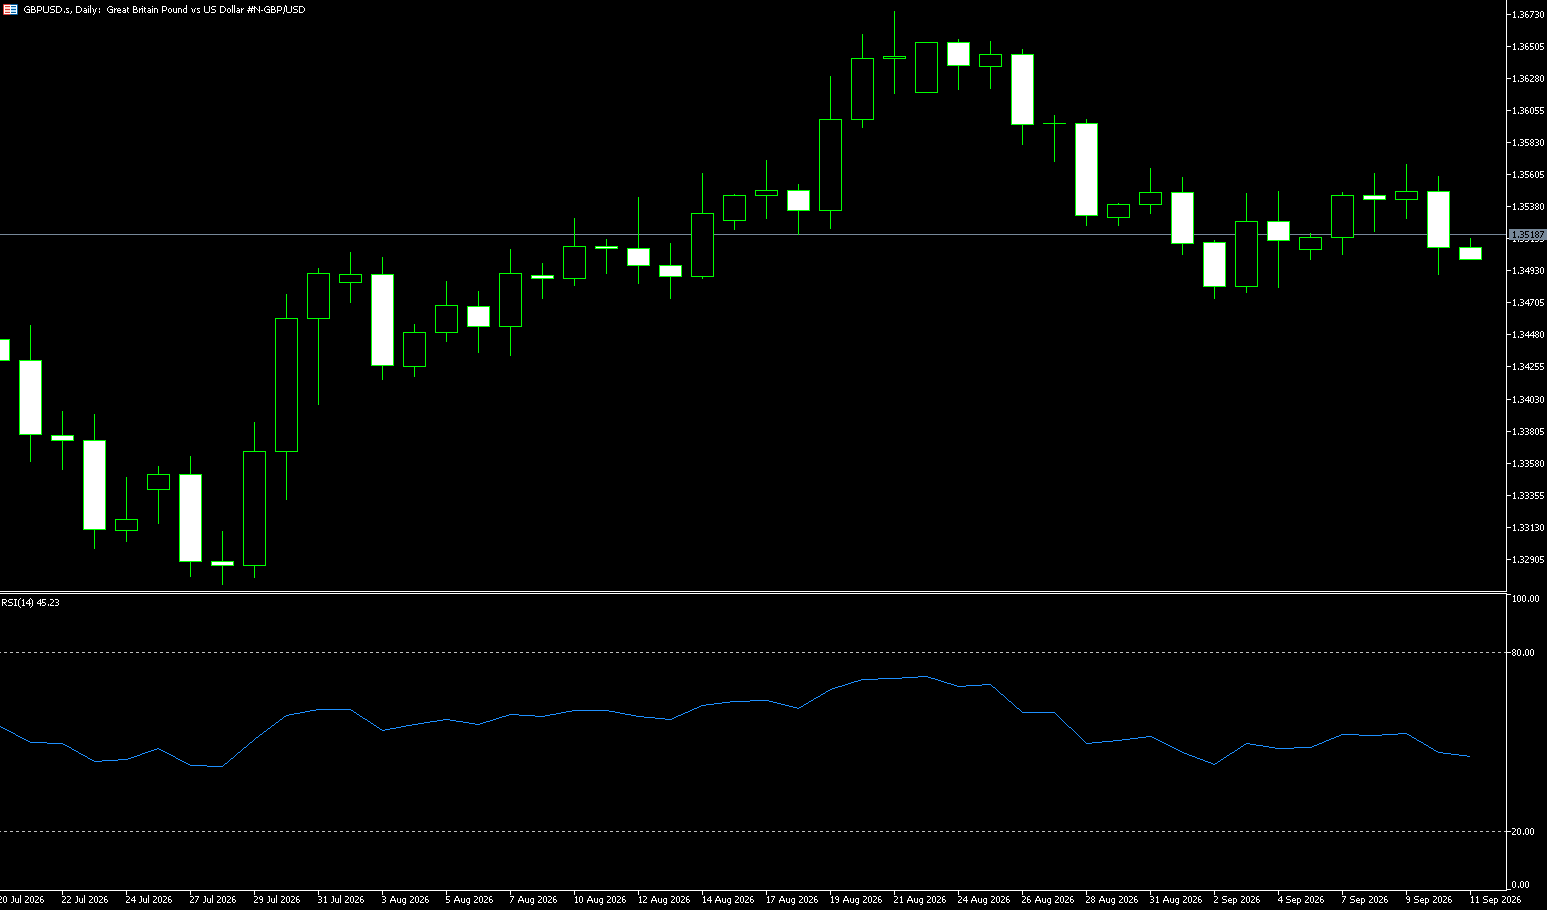
At its September policy meeting, the US central bank decided to raise the benchmark interest rate by 25 basis points to a range of 3.75%–4.00%. The Federal Reserve anticipates another rate hike later this year as part of efforts to curb inflation; traders currently estimate a 56.5% probability of another US rate hike when central bank officials meet next in October. Meanwhile, the Bank of England kept interest rates unchanged at 3.75% last week but forecast that inflation could exceed 4% early next year. The UK's political backdrop continues to support the British pound; market participants and the media maintain confidence in the government's commitment to fiscal responsibility, a narrative that remains constructive. This sustained confidence in fiscal discipline is viewed as a key pillar supporting overall sentiment toward UK assets.
On the daily chart, the GBP/USD pair retains a short-term bearish bias, trading below both the 100-day moving average and the middle Bollinger Band. Prices are hovering just above the lower Bollinger Band, indicating persistent downward pressure, while the 14-day Relative Strength Index (RSI) sits near 35—suggesting weak momentum; while not yet deeply oversold, this level aligns with current selling pressure.
To the upside, initial resistance lies at the 100-day moving average (1.3435), followed by the 1.3505 level near the middle Bollinger Band. The next hurdle is the upper Bollinger Band near 1.3655; a breakout above this level would be required to alleviate the broader bearish bias. On the downside, the lower Bollinger Band at 1.3355 provides immediate support. A decisive break below this area would open the way for further declines, targeting the September 18 low of 1.3335, followed by the July 28 low of 1.3273.
Consider going long on GBP at 1.3360 today; Stop Loss: 1.3350; Target: 1.3400. 1.3410
USD/JPY
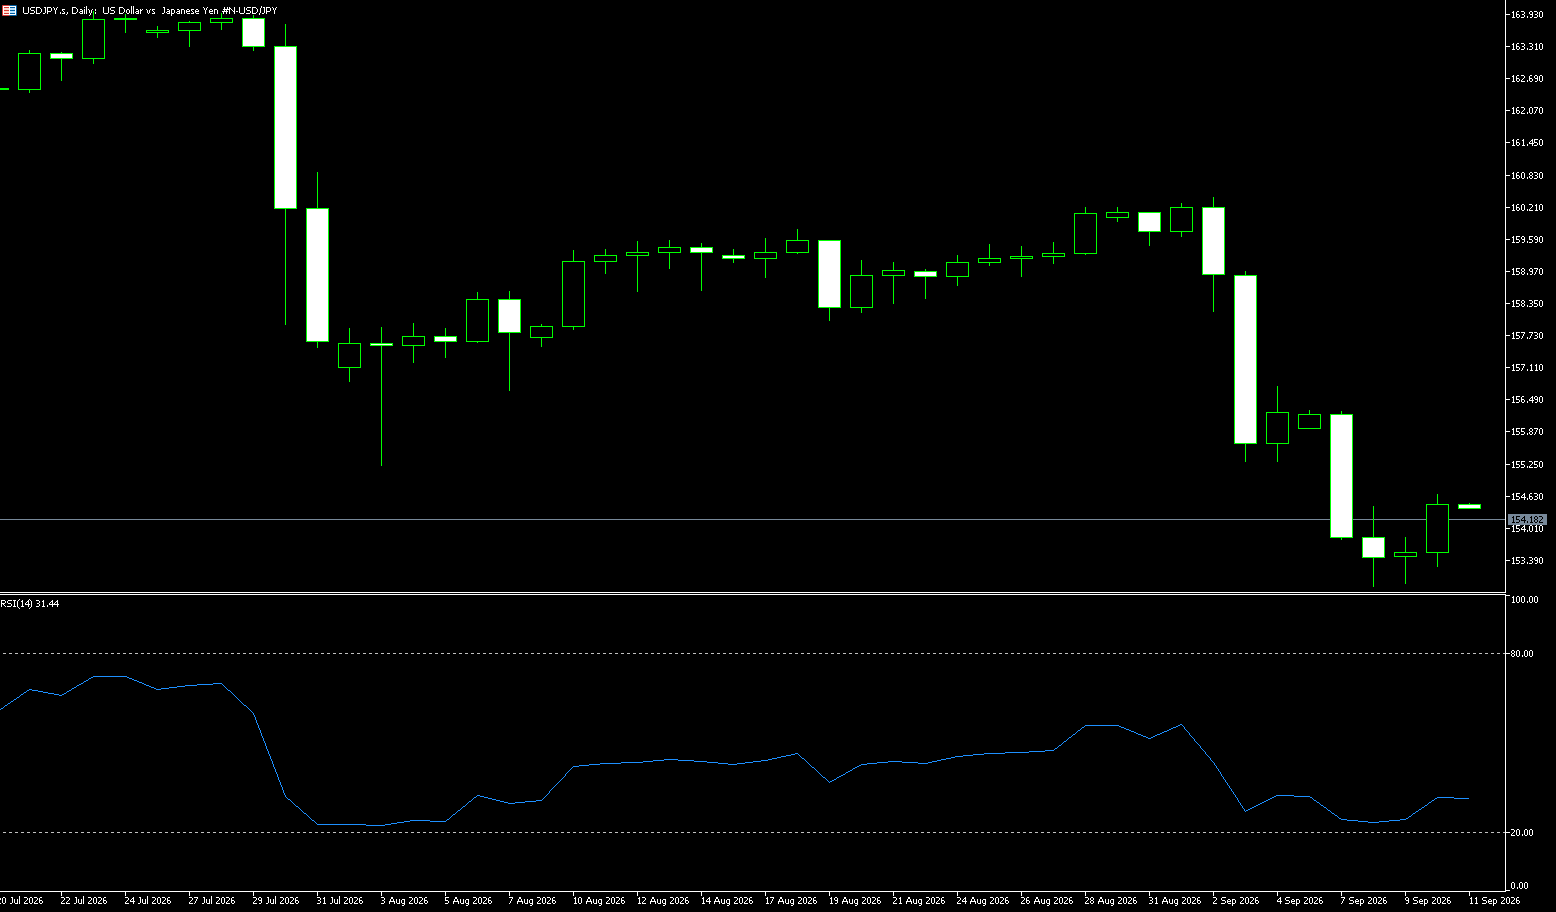
The Japanese yen held steady near 157.20 per dollar on Monday after falling more than 2% last week, as traders remained alert to the possibility of intervention during Japan's three-day holiday. Tokyo has previously intervened in the foreign exchange market during periods of thin holiday liquidity, and concerns were heightened by reports that the Bank of Japan conducted a rate check with market participants late last Friday. The yen depreciated sharply last week after the Bank of Japan raised interest rates—a widely expected move—amidst dissent from two policymakers regarding the decision. Governor Kazuo Ueda stated that the Bank of Japan remains committed to raising rates and adjusting the degree of monetary easing in response to changing economic conditions, while noting that accommodative conditions are expected to persist to support economic growth. The yen also faced pressure from market expectations that Japan's rate-hiking cycle might progress more slowly than that of the Federal Reserve.
The Japanese yen fell by more than 1% at one point last Friday before paring some losses in late New York trading, ultimately hovering around the 157.20 level. Meanwhile, the US dollar recorded its largest weekly gain in three months, further intensifying pressure on the yen. New long positions on the yen had been established just prior to a week of unfavorable market movements. Overall market sentiment remains likely to be weighed down. The yen is highly susceptible to sharp volatility and further weakening in the coming week. A holiday in Japan extending through Wednesday will result in thin market liquidity; should official intervention occur, its impact would be amplified. A similar situation unfolded during the "Golden Week" holidays in late April and early May, when Japan intervened in the currency market after the yen breached the 160 mark. With another three-day holiday approaching in Japan, liquidity will remain low; additionally, investors were disappointed by the Bank of Japan's failure to provide clearer guidance on the pace of future interest rate hikes. On Monday, the yen stabilized near the 157 level against the dollar; key levels to watch include the 34-day moving average at 157.63 and the 158 mark to the upside, while the 156 level and the 14-day moving average at 155.46 are key levels to the downside.
Consider shorting the USD/JPY pair at 157.50 today; stop-loss: 157.70; targets: 156.50, 156.60.
EUR/USD
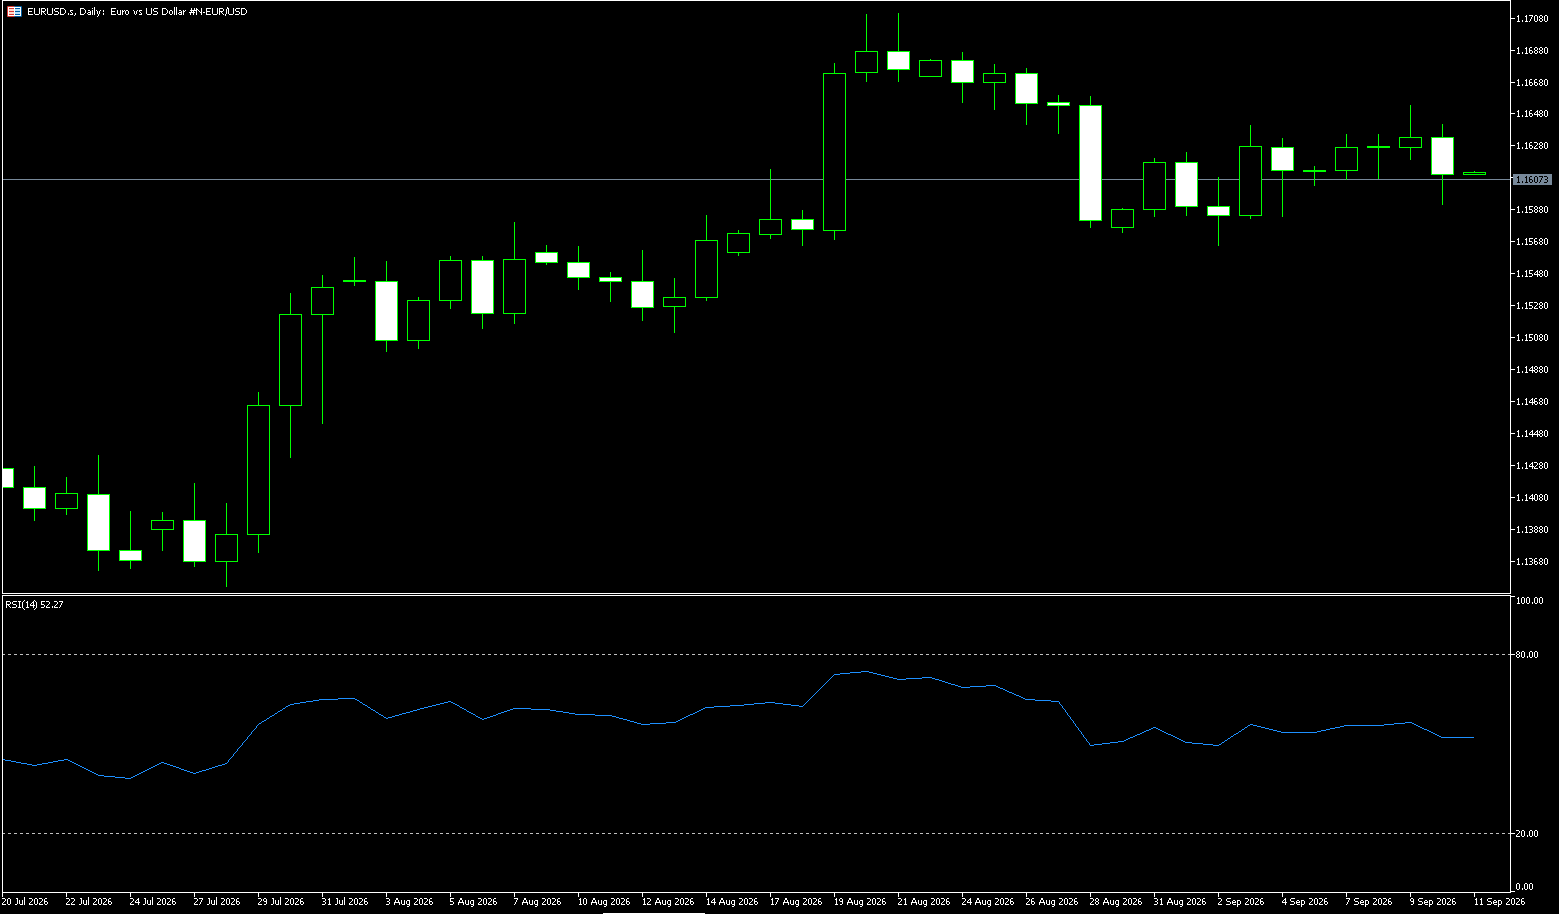
The EUR/USD pair struggled to sustain the modest rebound seen last Friday from the mid-1.1400s—its lowest level since late July—and resumed its decline at the start of the new week. Spot prices are currently trading near the 1.1480 area, appearing vulnerable amidst rising geopolitical tensions. European officials have warned that Russia is poised to launch drone, missile, sabotage, and cyber operations against NATO nations supporting Ukraine in the coming months. The latest warning came from French President Emmanuel Macron, who stated on Friday that the hybrid threat posed by Russia to Europe and France has intensified. This is viewed as unfavorable for the Euro, while escalating tensions in the Middle East provide a tailwind for the US Dollar. European Central Bank President Christine Lagarde is scheduled to speak later this Monday, an event expected to provide some impetus for the common currency; this, in turn, will influence the US Dollar and determine the short-term trajectory of the EUR/USD pair.
The EUR/USD pair maintains a short-term bearish bias, trading below the 100-day Simple Moving Average (SMA) at 1.1546 and the 61.8% Fibonacci retracement level at 1.1486. The exchange rate continues to trade below short-term moving averages, which are exerting significant downward pressure. The RSI (14) has retreated into the weak zone below 35; after briefly entering oversold territory, it has recovered slightly but shows no clear signs of a bullish reversal. Immediate support aligns with the 61.8% retracement level at 1.1486, with stronger support located at the 1.1400 psychological level. On the upside, bulls must first reclaim the 1.1500 level to alleviate current pressure; subsequent resistance lies near the 100-day SMA (1.1546) and the 50.0% retracement level (1.1529). A sustained breakout past these hurdles would be required to validate a more enduring rebound toward the 20-day SMA (1.1584) and the 1.1600 psychological level.
Consider going long on the Euro at 1.1455 today; Stop Loss: 1.1445; Targets: 1.1490, 1.1500.
Stock Analysis:
Australia ASX 200 Stock Index
Market Overview:
The ASX 200 index closed flat at 8,732 points on Monday, recovering from earlier weakness as gains in US stock index futures boosted sentiment. Markets are anticipating the bilateral summit between President Trump and Chinese leader Xi Jinping on September 24, where discussions are expected to cover tariffs, minerals, and broader economic relations. Meanwhile, Treasurer Bessent described his weekend talks with Chinese Vice Premier He Lifeng as "successful." The consumer goods, financial, and utility sectors rose, while healthcare, non-energy minerals, and logistics sectors declined. This marked a second sluggish trading day locally as traders continued to weigh Reserve Bank Governor Bullock's warning that inflation remains stubbornly high, keeping the risk of interest rate hikes alive.
Investors are now awaiting Australia's September flash PMI and August labor data. Ramelius Resources rose 6.2%, followed by Paladin Energy (3.4%) and Viva Energy (1.9%), while the "Big Four" banks saw gains ranging from 0.4% to 0.9%. On the other hand, BHP Group (-0.4%), Xero Ltd (-4.3%), and Lynas Rare Earths (-2.6%) underperformed.
Sector Performance:
Top Gainers: Utilities, consumer staples, and financials (Big Four banks saw modest gains); individual stocks Ramelius Resources (RMS) +6.15% and cochlear implant manufacturer Cochlear (COH) +5.27% led the index.
Top Decliners: Mining/resources and healthcare sectors weighed on the broader market; BHP retreated slightly, and resource stocks faced pressure. Technical Analysis:
The ASX 200 index closed at 8,731.90 on Monday (+0.01% or +0.7 points), characterized by an intraday dip-and-recovery and narrow-range fluctuation; the price structure showed sideways consolidation for the second consecutive trading session. It opened lower due to weak offshore market sentiment, hitting an intraday low, but buying interest subsequently stepped in to recoup most of the losses. It closed nearly flat, forming a small "Doji" candle with a lower shadow—a classic pattern for range-bound consolidation. The trading range has compressed, indicating a temporary balance between bulls and bears with no clear directional bias. The index holds above short-term moving averages, which have flattened out (shifting from a slight upward slope to sideways movement), signaling a slowdown in upward momentum. RSI: Remains in the neutral zone near 50, showing neither overbought nor oversold conditions and no clear advantage for either bulls or bears.
Technical Outlook for Tuesday (Sept 22): Market characteristics include significant sector divergence and index stabilization via the offsetting effects of heavyweight stocks; overall capital remains in a "wait-and-see" mode pending upcoming Australian PMI and employment data, as well as potential external catalysts. Scenario projections for Tuesday: Bullish scenario (optimistic): Open and hold above 8,730, break through and stabilize above 8,750 → test resistance at 8,780–8,800 (requires synchronized gains in the financial and resource sectors). Neutral scenario (most likely): Continue narrow-range fluctuation between 8,690 and 8,750, with Doji-like patterns persisting; wait for news-driven triggers for a breakout while bulls and bears remain deadlocked. Bearish scenario: Lose the 8,690 level without recovering intraday → downside test of 8,650, shifting the pattern from consolidation to a pullback.
Trading Strategy (Short-term perspective)
Short-term strategy (Technical trading approach only; not a buy/sell recommendation)
Bullish approach
• Long entry conditions: Establish a firm position above 8,750 with confirmed high trading volume; consider a test long position upon a pullback to the 8,740 area; target 8,780, with a stop-loss placed below 8,710.
• Blindly "buying the dip" near the current 8730 level is not recommended, as the sideways consolidation phase is prone to false breakouts.
Bearish Strategy
• Short-selling criteria: If the index falls below 8690 and consistently closes beneath it, look to initiate a short position upon a rebound to the 8700 area; target 8650, with a stop-loss above 8735.
Key Risk Warnings:
1. Macro Risks: Hawkish rhetoric from the RBA has led the market to reprice interest rate hike expectations; stronger-than-expected inflation or PMI data could weigh on the stock market. Fluctuations in the AUD exchange rate directly impact the weighting of resource stocks.
2. External Risks: Overnight US stock futures and events related to US-China relations may cause disruptions; volatility in external risk assets can trigger a gap opening in the ASX200, potentially breaching established technical support and resistance levels.
3. Technical Risks: Narrow sideways consolidation is highly susceptible to false breakouts—where the price briefly pierces support or resistance before sharply reversing—making stop-loss orders vulnerable to being triggered.
4. Sector Risks: Volatility in major mining stocks (such as BHP) and fluctuations in commodity prices can rapidly impact the index.
Japanese Stock Market Index (JP225)
Market Overview:
Important Note: The Japanese cash equity market is closed for consecutive holidays on Monday (Sept 21), Tuesday (Sept 22), and Wednesday (Sept 23, Autumnal Equinox); the next cash trading session is Thursday, Sept 24. Only JPX/SGX Nikkei futures are tradable during the holiday, characterized by lower liquidity and heightened volatility. SGX/JPX Nikkei futures: Thin holiday liquidity and minor price fluctuations, driven primarily by the USD/JPY exchange rate. USD/JPY remains near 156.8 as the market weighs the risk of Bank of Japan intervention; futures have retraced some of last Friday's gains and are consolidating in the 64,800 range. The Bank of Japan's rate hike has materialized in line with expectations; the index rebounded from lows to close with a strong bullish candle, reclaiming the 65,000 psychological level. Heavyweight semiconductor equipment stocks (Tokyo Electron, Advantest) led the gains, while banking stocks weighed on the index due to expectations of weaker momentum following opposition to the rate hike from some committee members.
Sector Performance:
Trading in the Japanese cash market was unavailable on Monday and Tuesday; only offshore Nikkei futures were tradable.
Technical Analysis:
Tuesday was a bridge holiday, keeping the Japanese cash market closed; with only overseas futures trading and extremely low liquidity, "spike" false breakouts are likely. Opening new cash positions is not recommended; for futures, light-position trading is advised. Projected Range: Support 64,400 / Strong Support 63,770; Resistance 65,430 / Strong Resistance 66,000. Scenario Analysis: 1) Base Case (Highest Probability): Narrow-range fluctuation between 64,400 and 65,430, driven by US Treasury yields and the USD/JPY exchange rate; no clear directional trend—awaiting the market open on Thursday. Bullish Scenario: Rapid yen depreciation and falling US Treasury yields drive futures to test the 65,430 resistance level; holding above this level opens the path to 66,000. Bearish Scenario: Rapid yen appreciation (fueled by intervention rumors) causes futures to break below the 64,400 support level, targeting 63,770.
Trading Strategy:
Note: Trading in the Japanese cash market was unavailable on Monday and Tuesday; only offshore Nikkei futures were tradable.
1. Bullish Strategy (Betting on the continuation of the rebound)
• Entry: Go long if the price stabilizes near 64,400 and forms a small candlestick.
• Stop-loss: Below 64,100 (exit if it breaks below last Friday's low).
• Take-profit 1: 65,400; Take-profit 2: 66,000.
2. Bearish Strategy (Betting on profit-taking)
• Entry: Go short if the price faces resistance near 65,400 and shows a bearish divergence or a long upper shadow.
• Stop-loss: Above 65,700.
• Take-profit 1: 64,400; Take-profit 2: 63,770.
Key Risk Warnings:
1. Liquidity Risk: Markets in Japan are closed on Tuesday, resulting in shallow futures market depth. This increases the likelihood of slippage and sudden price spikes/drops; stop-loss orders may not execute at preset prices. Heavy position sizing is strictly discouraged.
2. Exchange Rate "Black Swan": USD/JPY is the primary variable affecting the Nikkei 225. Verbal or actual intervention by the Bank of Japan could rapidly appreciate the yen, exerting strong downward pressure on export-heavy Japanese stocks and potentially causing a short-term crash.
3. Fundamental Expectation Volatility: There is significant internal disagreement within the Bank of Japan regarding interest rate hikes. The market will likely speculate repeatedly on the future rate-hike path, and fluctuating expectations will amplify volatility.
4. External Market Correlation Risk: Significant overnight volatility in US stocks and Treasury yields will directly drive gap moves in Nikkei futures, likely resulting in a substantial opening gap for the cash index on Thursday.
Disclaimer: The information contained herein (1) is proprietary to BCR and/or its content providers; (2) may not be copied or distributed; (3) is not warranted to be accurate, complete or timely; and, (4) does not constitute advice or a recommendation by BCR or its content providers in respect of the investment in financial instruments. Neither BCR or its content providers are responsible for any damages or losses arising from any use of this information. Past performance is no guarantee of future results.
Lebih Liputan






2026 © - All Rights Reserved by BCR Co Pty Ltd
Pendedahan Risiko:Instrumen derivatif diniagakan di luar bursa dengan margin, yang bermakna ia membawa tahap risiko yang tinggi dan terdapat kemungkinan anda boleh kehilangan seluruh pelaburan anda. Produk-produk ini tidak sesuai untuk semua pelabur. Pastikan anda memahami sepenuhnya risiko dan pertimbangkan dengan teliti keadaan kewangan dan pengalaman dagangan anda sebelum berdagang. Cari nasihat kewangan bebas jika perlu sebelum membuka akaun dengan BCR.
BCR Co Pty Ltd (No. Syarikat 1975046) ialah syarikat yang diperbadankan di bawah undang-undang British Virgin Islands, dengan pejabat berdaftar di Trident Chambers, Wickham’s Cay 1, Road Town, Tortola, British Virgin Islands, dan dilesenkan serta dikawal selia oleh Suruhanjaya Perkhidmatan Kewangan British Virgin Islands di bawah Lesen No. SIBA/L/19/1122.
Open Bridge Limited (No. Syarikat 16701394) ialah syarikat yang diperbadankan di bawah Akta Syarikat 2006 dan berdaftar di England dan Wales, dengan alamat berdaftar di Kemp House, 160 City Road, London, England, EC1V 2NX. Open Bridge Limited bertindak semata-mata sebagai pemproses pembayaran untuk BCR Co Pty Ltd dan tidak menyediakan sebarang perkhidmatan kewangan, perdagangan atau pelaburan bagi pihaknya. Peranan Open Bridge Limited adalah terhad kepada pemprosesan pembayaran.


 English
 简体中文
简体中文
 繁體中文
繁體中文
 Bahasa
Melayu
Bahasa
Melayu
 Tiếng
Việt
Tiếng
Việt
 ไทย
ไทย
 日本語
日本語
 한국어
한국어
 ភាសាខ្មែរ
 español