


0
Currency & Commodity Analysis:
US Dollar Index
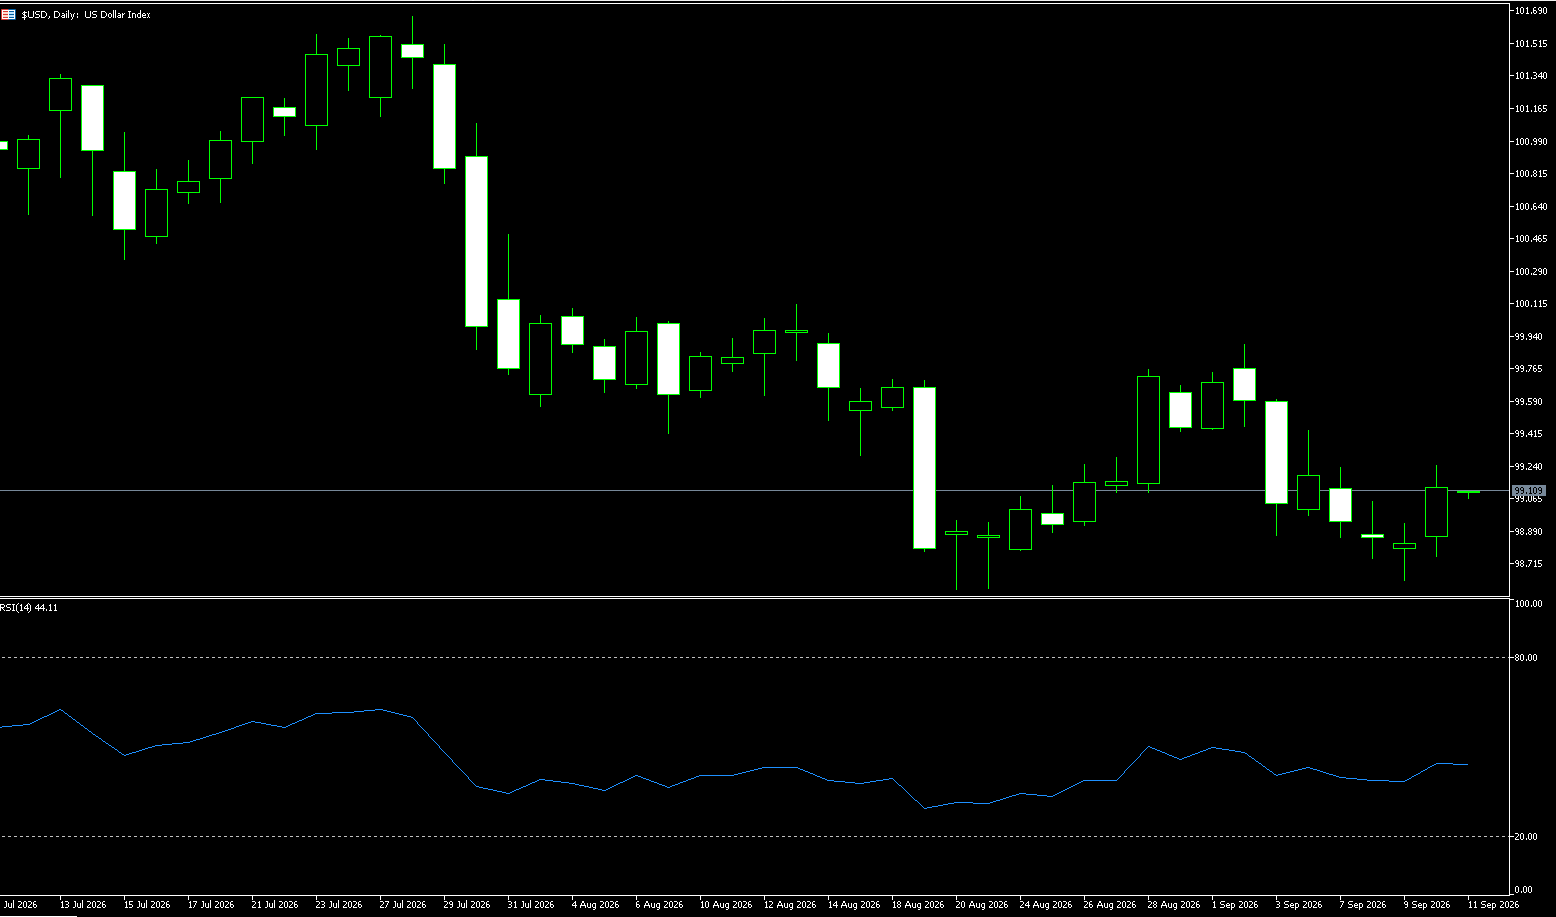
The US dollar rose across the board early in the week; the Dollar Index climbed to close at 99.60, having touched an intraday high of 99.73—its highest level since September 2. Ongoing conflict in the Middle East drove up oil prices, prompting investors to buy the dollar as a safe-haven asset. Meanwhile, markets braced for a potential Federal Reserve rate hike—the first in over two years—while warnings from major AI company executives regarding the technology's potential risks dampened overall risk sentiment, further supporting the dollar. The currency strengthened slightly on heightened expectations of Fed tightening; however, should the Fed leave rates unchanged or deliver a "dovish" hike without explicitly committing to further increases, the dollar could face downward pressure. Bets on global rate hikes pushed government bond yields in the US, Europe, and Japan to multi-year or even multi-decade highs, though the impact on foreign exchange markets remained relatively limited. Markets are nearly certain the Bank of Japan will raise rates on Friday, with speculators shifting to a net-long position on the yen for the first time since February; meanwhile, the Bank of England is expected to hold borrowing costs steady on Thursday, though traders anticipate a hike later this year and further increases in 2027.
Federal funds futures indicate a 93% probability of a Fed rate hike on Wednesday, up significantly from around 60% a week ago. The Fed's upcoming "dot plot" may also reveal that some policymakers anticipate another rate hike later this year. Against this backdrop, the dollar strengthened across the board, hitting a two-week high of 99.73. However, this strength carries risks: if the Fed ultimately chooses to keep rates unchanged or implements a "dovish" hike without a clear commitment to further action, the dollar could quickly come under pressure. As long as the resistance zone between 99.73 (Monday's high) and 99.86 (the September 2 high) remains unbroken, the overall outlook remains bearish; the initial target is 99.13 (the 200-day moving average), with a further move toward the 99.00 round-number level in sight.
Consider shorting the US Dollar Index at 99.70 today; stop-loss: 99.80; targets: 99.20, 99.10.
WTI Spot Crude Oil
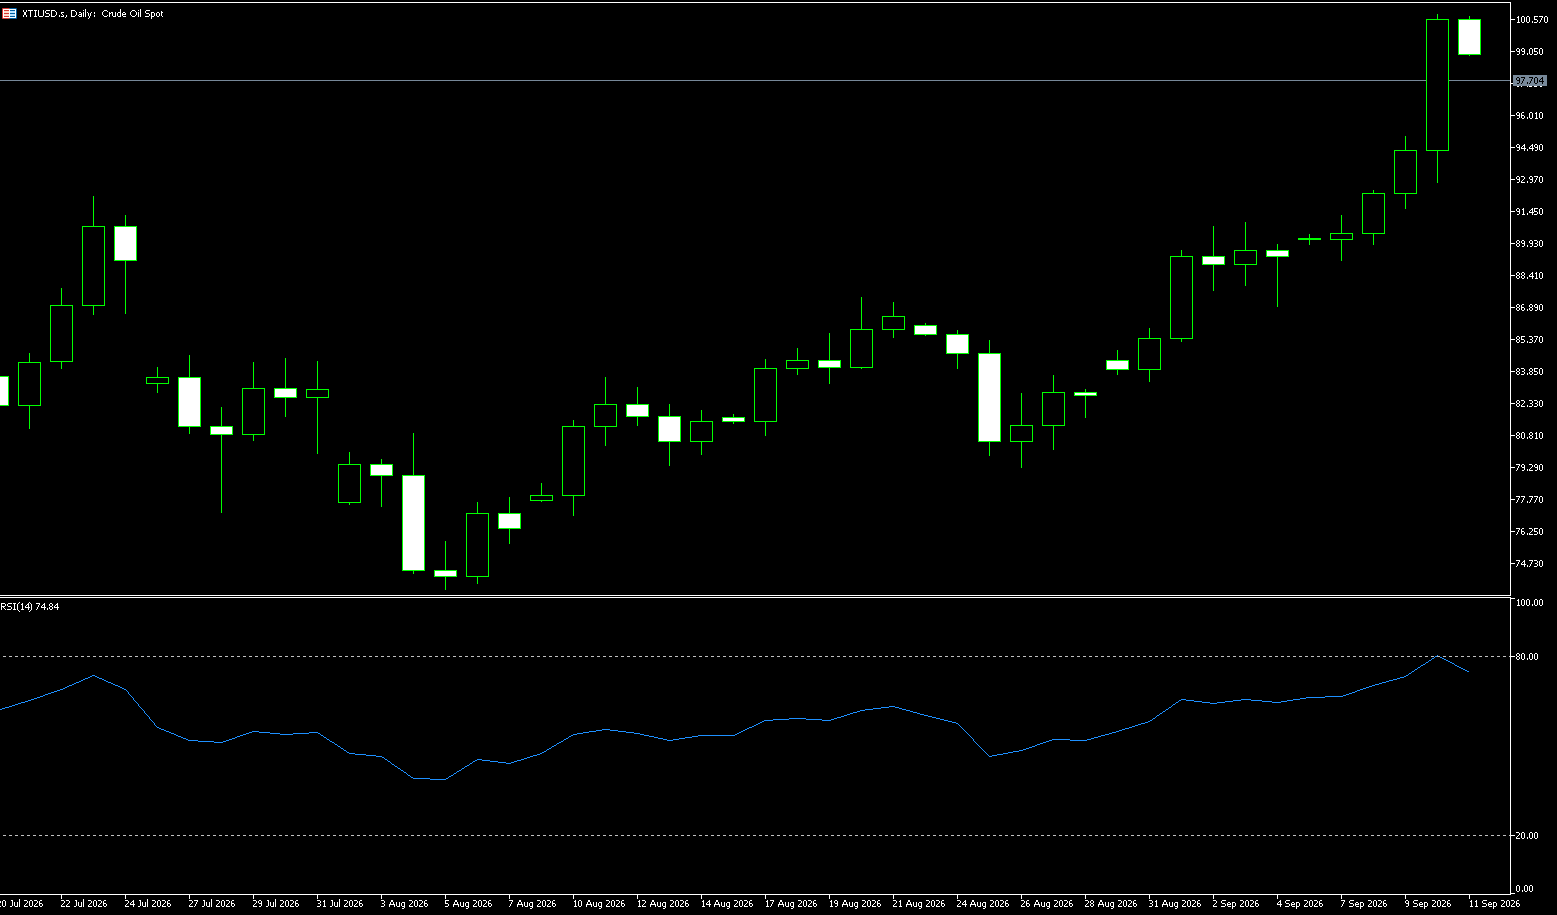
On Tuesday, crude oil prices broke above $100 per barrel—hitting a four-month high—after Saudi Arabia reportedly cancelled some shipments and shut down a key export pipeline following a drone attack. Saudi Arabia allegedly notified European customers of cancellations for some September deliveries and suspended oil loading operations at Yanbu. Meanwhile, Iran-backed Houthi rebels launched fresh attacks on Saudi Arabia this week. The security situation in the Strait of Hormuz remains volatile, with at least two oil tankers attacked since Saturday. Data from Kpler shows that commercial vessel traffic through the strait dropped from 10 ships on Sunday to four on Monday. In Libya, the National Oil Corporation suspended operations at two oil fields and a pumping station due to protests. Despite US President Trump announcing an agreement between the two sides to halt attacks on each other's energy infrastructure, Russia continues to strike fuel depots near Kyiv, while Ukraine has targeted a Russian oil refinery.
The market's key question has shifted from "Can oil prices break $100?" to "Can gains above $100 be sustained by actual supply tightening?" From a daily chart perspective, WTI has established a pattern of higher highs and higher lows since its August lows, and the bullish trend has strengthened further after reclaiming the $100 mark. The $100 level serves as both a significant psychological milestone and a battleground for short-term bulls and bears. Recent technical data indicates a bullish medium-to-long-term moving average structure for WTI; the 100-day and 200-day moving averages remain well below the current price, suggesting the medium-term uptrend remains intact. If oil prices can stabilize above $100 and break through the $100.85 area (last week's high), they could extend toward the $103–$105 range; should supply risks worsen, resistance near previous highs might be retested. Key downside support levels to watch are $97.64 (5-day moving average) and the $95 psychological mark.
Consider going long on crude oil at $100.45 today; stop-loss: $100.30; targets: $102.00, $103.00.
Spot Gold
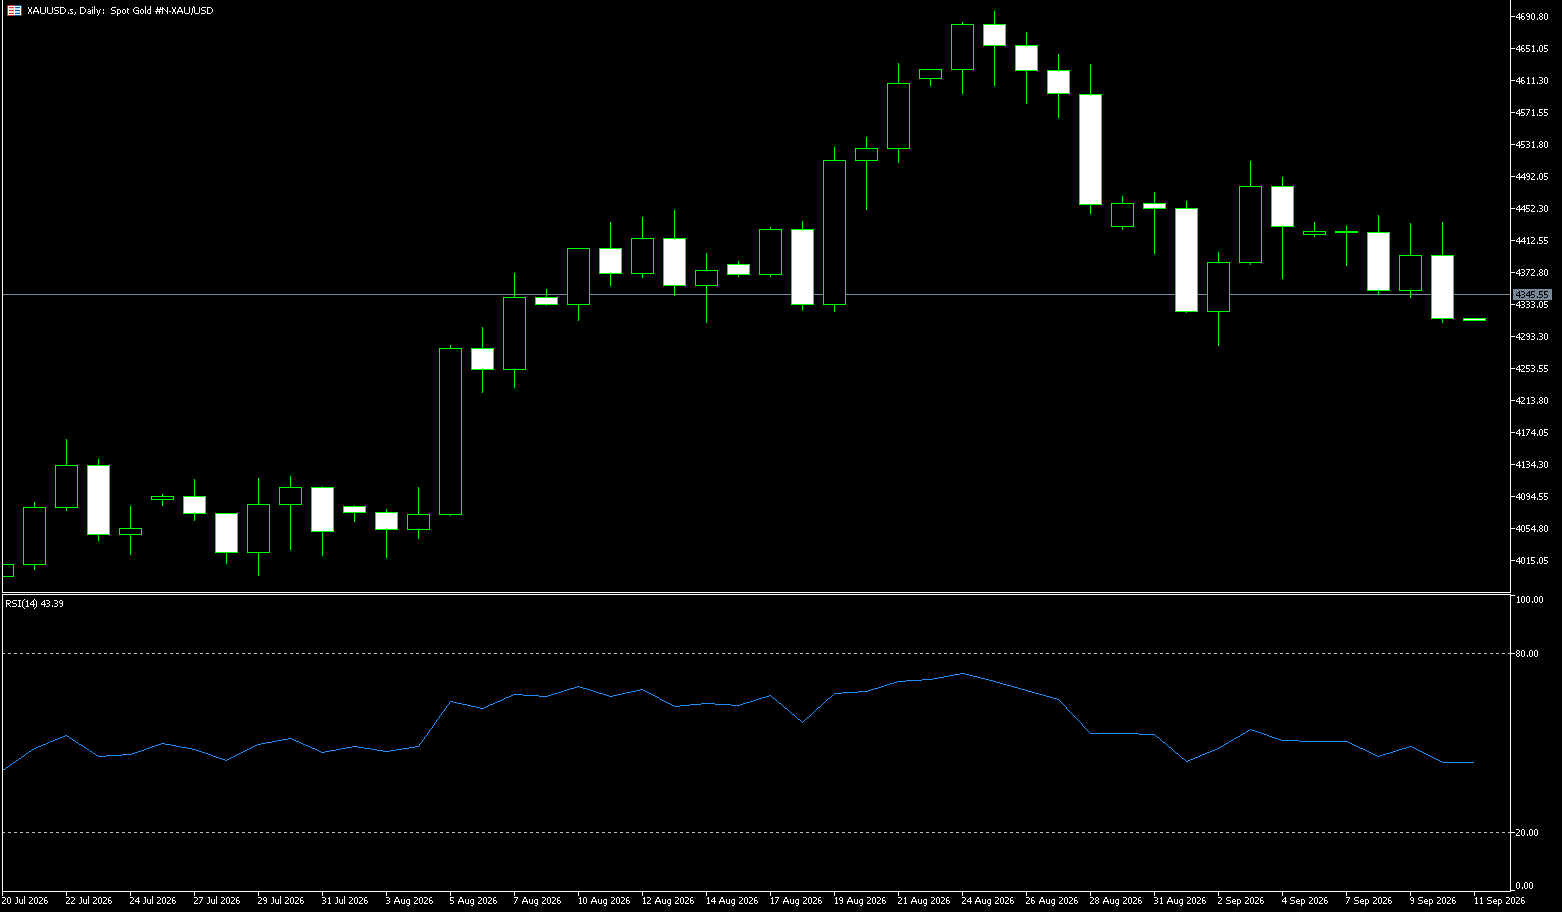
On Tuesday, spot gold traded near $4,295 per ounce. Prices had fallen to a more than one-month low on Monday as rising oil prices and stronger-than-expected inflation data from last Friday boosted bets on a Federal Reserve rate hike at this week's policy meeting. The sharp rise in crude oil prices has pushed up inflation expectations, implying that major global central banks will need to tighten monetary policy to curb inflation—a bearish factor for metal prices. In the short term, gold remains under pressure and volatile due to rising oil prices, the risk of successive rate hikes driven by inflationary pressures, and a strong US dollar; however, the impact of these bearish factors is likely nearing its limit. Meanwhile, market sentiment has been dampened by narratives suggesting AI companies might slow their pace of development, leading to a contraction in risk appetite and putting short-term pressure on buying across various asset classes; however, once concerns regarding capital expenditure imbalances at AI-related companies are resolved, risk appetite is expected to recover quickly. Supported by multiple factors—including geopolitical risks, high inflation, physical demand, and central bank gold purchases—gold presents a strategic opportunity for medium- to long-term positioning following this period of consolidation. After all, while inflation may suppress gold prices in the short term, the long-term decline in currency purchasing power is ultimately bullish for gold.
In the current environment, the forces of inflation and interest rate expectations are temporarily overriding safe-haven demand driven by geopolitics. Gold is no longer merely a "crisis asset" but a financial instrument deeply embedded in global monetary policy expectations. In the coming weeks, the gold market may experience a new round of significant volatility as the Federal Reserve's decision, the Bank of Japan's actions, and diplomatic developments in the Middle East unfold. For investors, closely monitoring the triangular relationship between oil prices, US Treasury yields, and the US dollar will be key to capitalizing on opportunities in the gold market. Gold prices are currently hovering near the neckline of a "head-and-shoulders top" pattern; recent declines have erased the gains accumulated over the previous two days. A confirmed daily close below the neckline is required to officially validate the head-and-shoulders top formation. Given the downward slope of the neckline, the pattern implies a potential downside target below $4,000. On the upside, watch for resistance at $4,370 (9-day moving average) and the psychological level of $4,400; on the downside, monitor the $4,281.60 level (September 2 low). A break below this level would point toward the lower Bollinger Band at approximately $4,223.
Consider going long on gold at $4,290 today, with a stop-loss at $4,285 and targets at $4,350 and $4,340.
AUD/USD
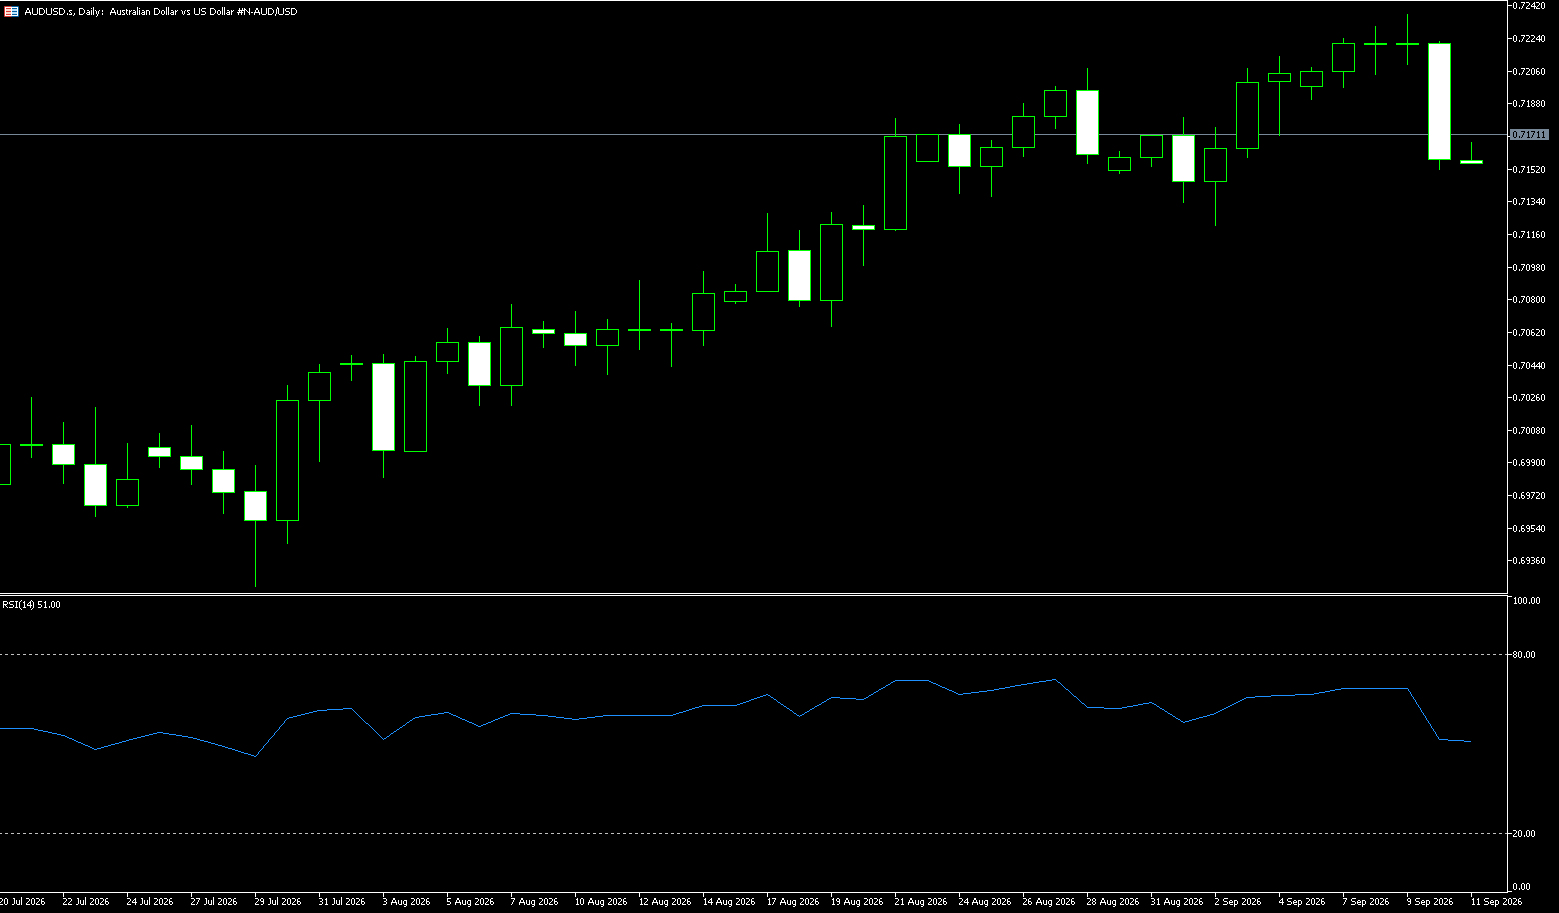
The AUD/USD pair struggled to capitalize on the modest rebound seen the previous day from the 0.7100 level—a low not seen in over three weeks—and maintained a bearish bias for the second consecutive day on Tuesday. The spot price showed little reaction to mixed macroeconomic data from China, remaining subdued and hovering around the 0.7130 area throughout the Asian session. China's National Bureau of Statistics (NBS) reported that retail sales grew by 0.4% year-on-year in August, falling short of the expected 0.8% growth and the 0.6% recorded the previous month. However, these figures failed to provide any meaningful impetus to the Australian dollar—often viewed as a proxy for the Chinese economy—leaving broad US dollar strength as the primary driver of AUD/USD price action. The US Dollar Index, which tracks the greenback against a basket of currencies, is holding near the two-week high reached on Monday, continuing to act as a headwind for the AUD/USD pair ahead of the pivotal two-day FOMC meeting. Expectations that the Reserve Bank of Australia (RBA) will raise interest rates later this month may help limit the downside for AUD/USD.
On the daily chart, AUD/USD is trading near 0.7130, maintaining a constructive bullish tone as the spot price holds above the 50-day and 100-day simple moving averages (SMA) clustered between 0.7074 and 0.7080. A potential demand zone sits just below the price, supported by the Relative Strength Index (RSI-14), while an Average Directional Index (ADX-14) reading of around 25 suggests the trend is strengthening but has not yet entered an aggressive phase. To the upside, initial resistance is seen at the 23.6% Fibonacci retracement level of 0.7147; a break above this level would pave the way for a move toward the recent swing high area of 0.7184 (9-day SMA) and the 0.7200 psychological level, where stronger resistance is expected. Nevertheless, the spot price retains a constructive short-term bias above the 50-day SMA at 0.7080. Should selling pressure intensify, the 50.0% Fibonacci retracement level at 0.7049 could serve as the next relevant support.
Consider going long on AUD at 0.7120 today; Stop Loss: 0.7110; Targets: 0.7180, 0.7170.
GBP/USD
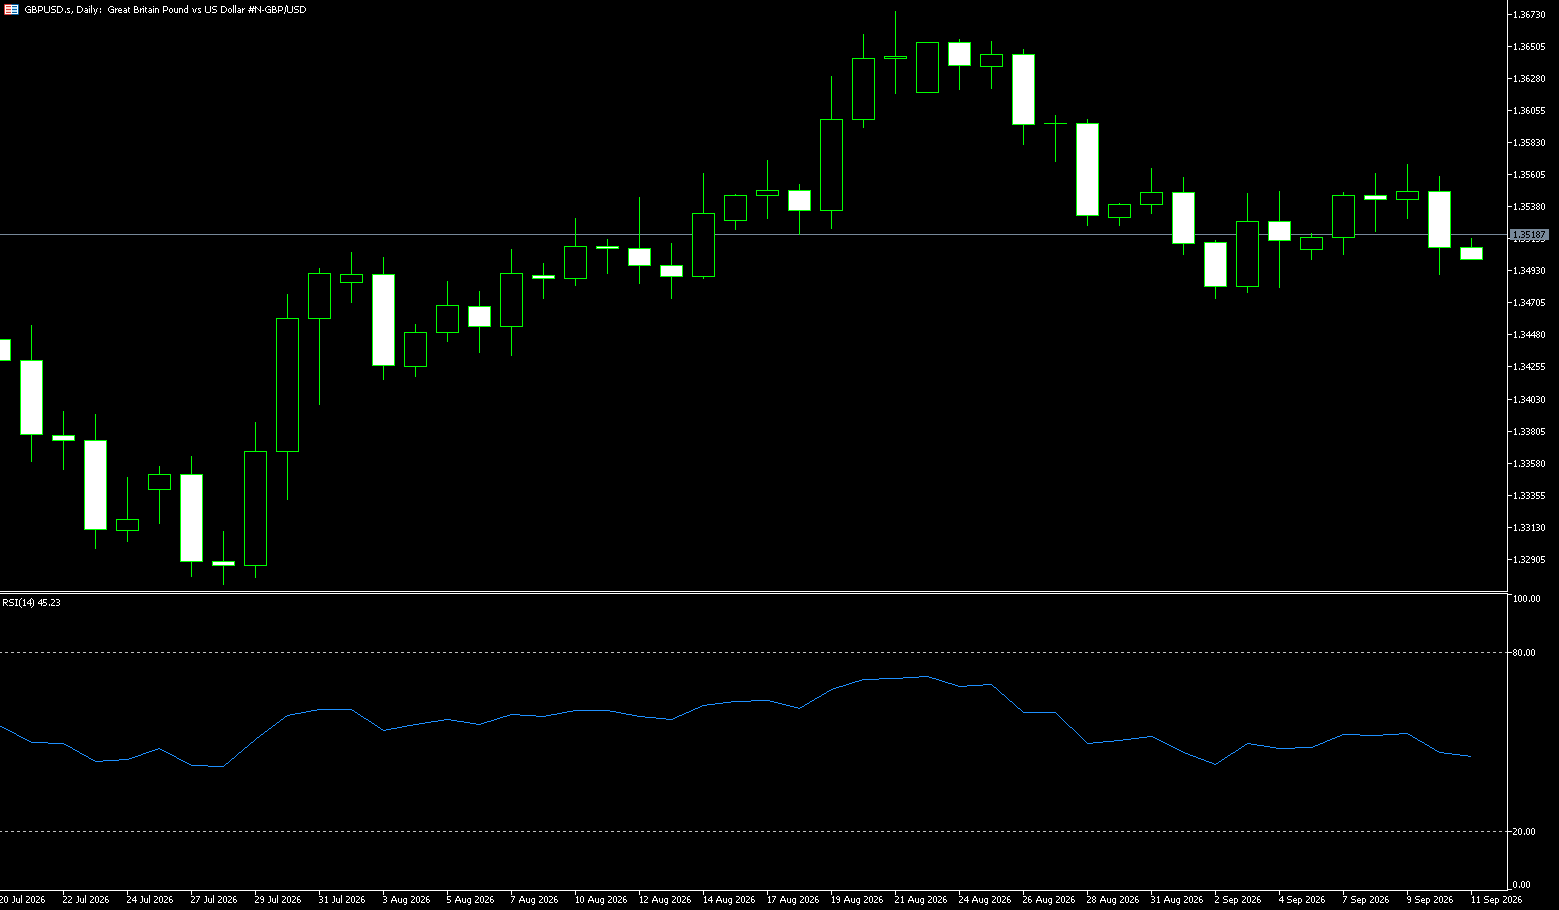
GBP/USD lost momentum on Tuesday, retreating to the 1.3480 area. Market expectations that the Federal Reserve (Fed) will raise interest rates on Wednesday provided some support for the US dollar against the pound. The UK employment report is due on Tuesday, with market attention subsequently shifting to the Bank of England's interest rate decision on Thursday. Following Friday's US inflation report—which showed the core Consumer Price Index (CPI) rising 0.3% month-on-month, exceeding expectations—traders have become more convinced that the Fed will hike rates to combat persistent inflation. Fed Chair Kevin Warsh is scheduled to hold a press conference on Wednesday following the conclusion of the two-day Federal Open Market Committee (FOMC) meeting. Any dovish remarks from policymakers could weigh on the dollar and provide support for the major currency pair, whereas hawkish comments from Fed officials could boost the dollar in the short term. Employment data and Wednesday's CPI figures will be released prior to the central bank decision, followed by retail sales data on Friday. Fundamentals remain supportive, highlighting how the widening interest rate differential continues to underpin the pound's performance.
On the daily chart, the short-term tone for GBP/USD is neutral, with the pair trading between resistance at the 20-day Simple Moving Average (SMA) of 1.3556 and support provided by the 100-day SMA at 1.3443. The 14-day Relative Strength Index (RSI) is hovering just below the 50 level, suggesting mild directional momentum, while the price consolidates within the Bollinger Bands. To the upside, a decisive break above the 20-day SMA at 1.3556 would make the 1.3600 psychological level the next resistance target; a further break would expose the upper Bollinger Band at 1.3660. To the downside, initial support lies at the 1.3500 mark, followed by 1.3452 (lower Bollinger Band) and the 100-day SMA at 1.3443; a drop below this zone would shift the bias back to bearish.
Consider going long on GBP at 1.3470 today; stop-loss: 1.3460; targets: 1.3530, 1.3520.
USD/JPY
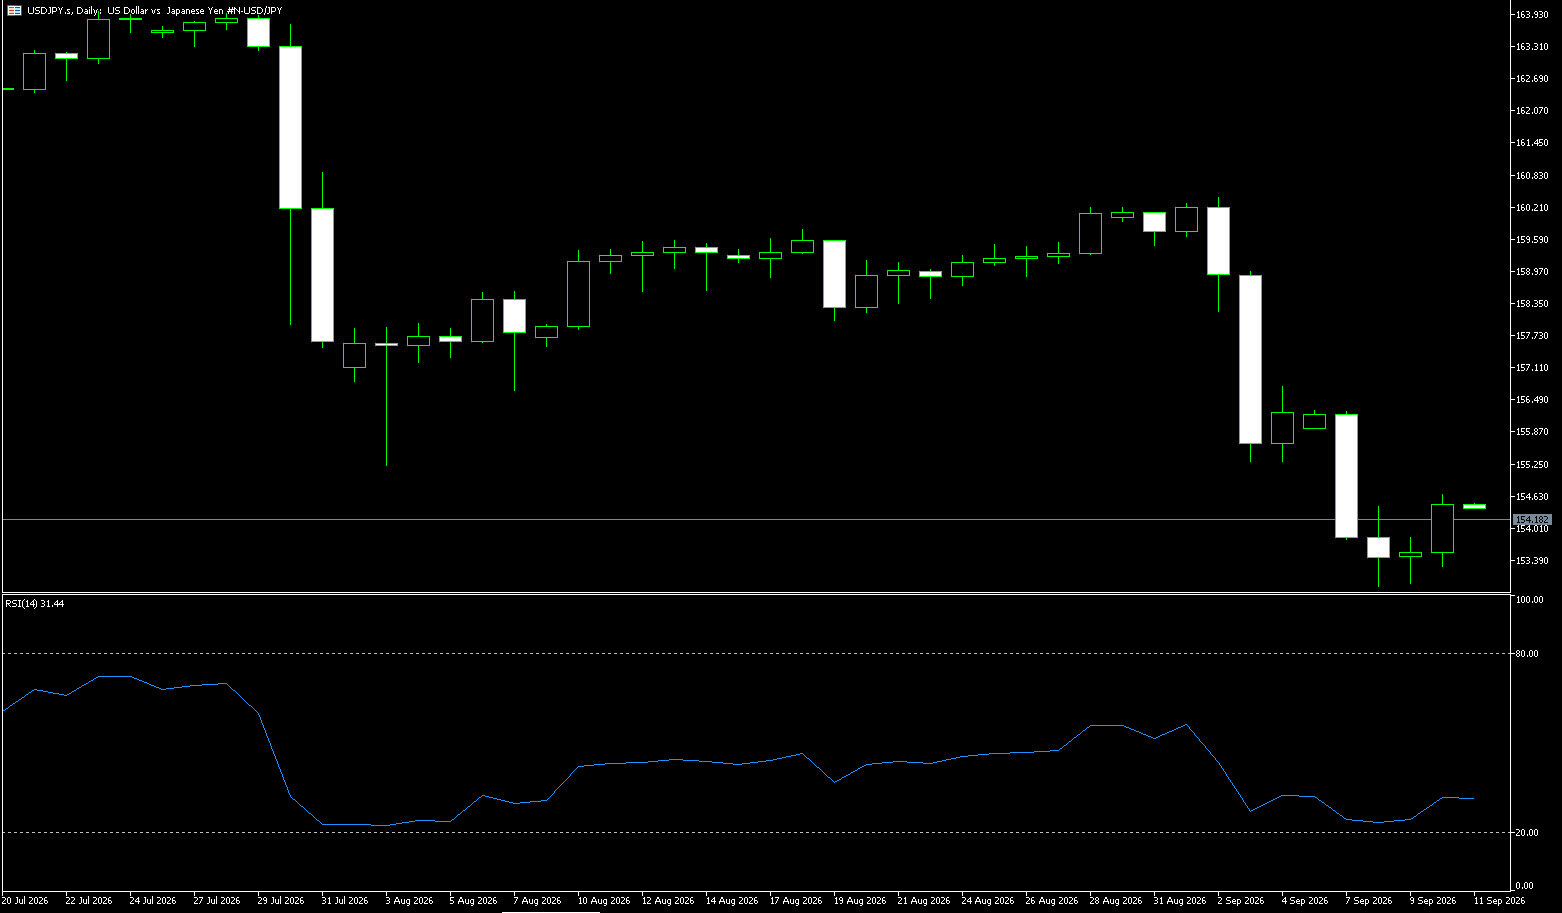
USD/JPY rose to around 154.90 on Tuesday. The US dollar strengthened against the yen as traders increased bets on a US rate hike in September. The Federal Reserve's interest rate decision, due later on Wednesday, will be the focus of attention. Data released last Friday showed an increase in the US Consumer Price Index (CPI) for August, with a key measure of underlying inflation recording its largest rise in four months; this report reinforced expectations of US rate hikes and pushed the dollar higher against the yen. Earlier this week, the dollar strengthened slightly, buoyed by growing market expectations that the Fed would begin tightening monetary policy. Markets also anticipate that the Bank of Japan (BOJ) will raise interest rates at its September policy meeting this Friday. A 25-basis-point hike has been almost fully priced in; for the yen to strengthen further, the BOJ would need to signal plans to maintain a faster pace of rate hikes.
On the daily chart, USD/JPY remains clearly below both the 20-day and 100-day simple moving averages (SMAs); despite a modest rebound from recent lows, the short-term bias remains bearish. The 14-day Relative Strength Index (RSI) has recovered from oversold territory to around 36, indicating a moderation in downward momentum, though it has not yet challenged the broader bearish structure. To the upside, initial resistance lies at the middle Bollinger Band near 157.15, followed by stronger resistance at the 100-day SMA near 158.41, and then the psychological level near 160. To the downside, the 154.00 level acts as the next key support zone; a decisive break below this level would open the way for further yen strengthening toward 153.37 (early-week low) and 153.00 (psychological level).
Consider shorting the USD at 155.20 today; Stop-loss: 155.40; Targets: 154.40, 154.50.
EUR/USD
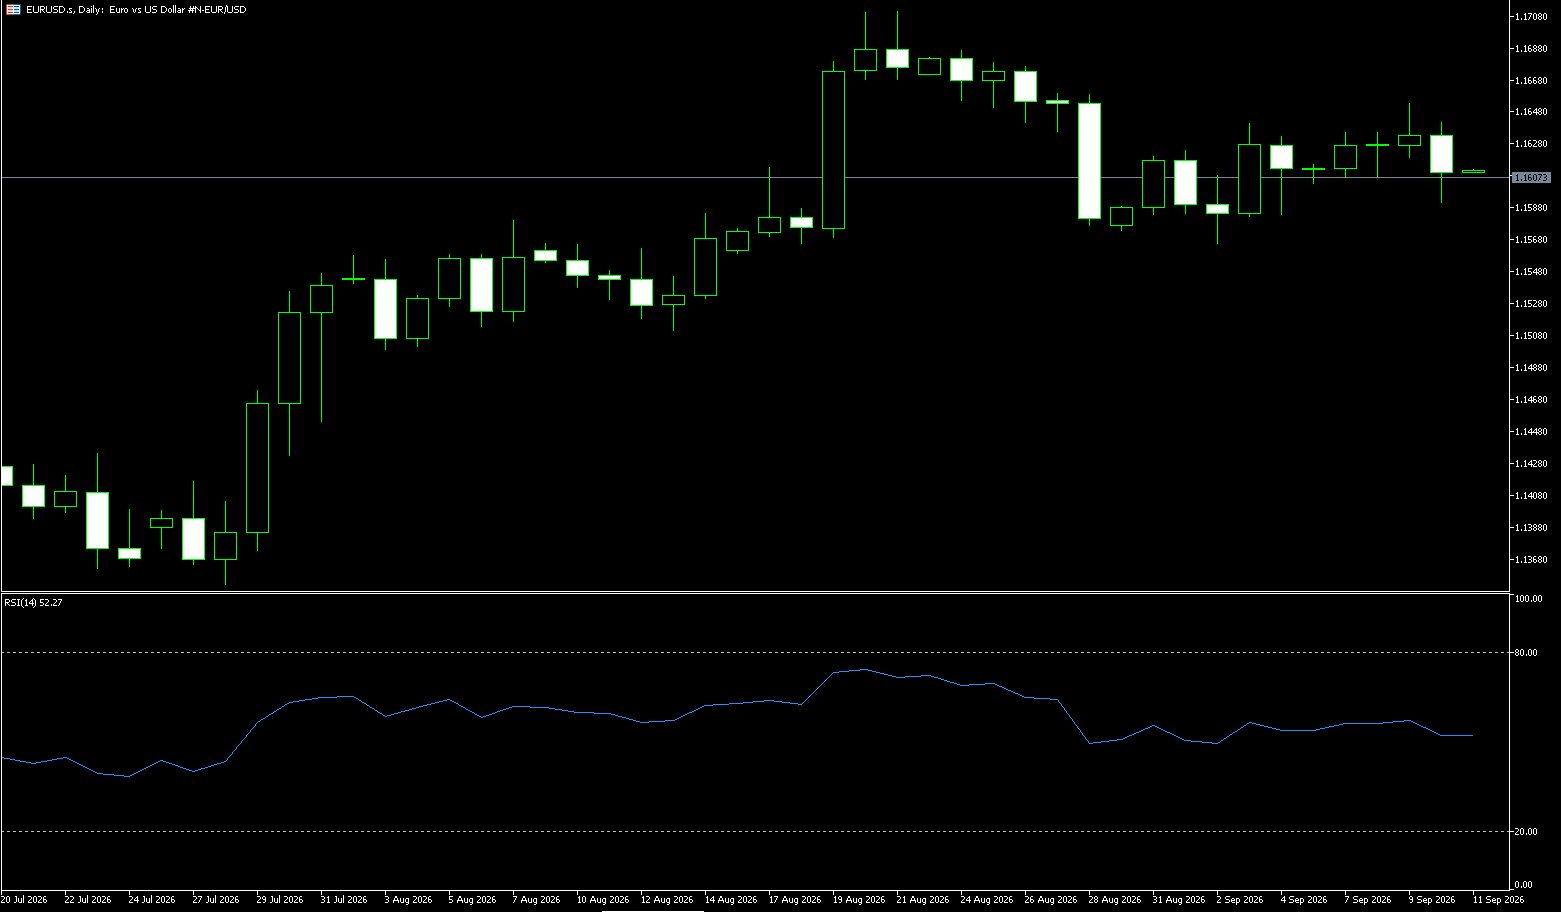
The EUR/USD pair attracted selling pressure for the fourth consecutive session on Tuesday, trading below the 1.1550 level and slightly above the one-month low touched the previous day. Furthermore, the fundamental backdrop suggests that the path of least resistance for the spot price remains to the downside. Ahead of the two-day FOMC monetary policy meeting starting later, the US dollar retains a bullish bias—driven by multiple supporting factors—and continues to weigh on the EUR/USD pair. Amid rising expectations of a Federal Reserve rate hike, inflation risks fueled by surging energy prices have kept US bond yields near multi-year highs. Coupled with escalating US-Iran tensions, these factors have bolstered the safe-haven US dollar. Ongoing conflict in the Strait of Hormuz maintains a geopolitical risk premium, supporting both crude oil prices and the US dollar. That said, a potentially hawkish outlook from the European Central Bank could provide some support to the Euro and help limit further declines in the EUR/USD pair.
The EUR/USD pair maintains a bearish tone below the 100-day (1.1555) and 200-day (1.1632) simple moving averages. However, sellers may need to decisively break below the 50.0% Fibonacci retracement level of the latest swing—around 1.1533—to extend the decline toward the 61.8% retracement level near 1.1491. Deeper support levels are found at the 78.6% level (1.1430) and the previous swing low area near 1.1353. On the upside, initial resistance appears at the 100-day SMA near 1.1555, followed by the 38.2% retracement level at 1.1575. However, stronger resistance lies at the 23.6% retracement level of 1.1628 and the 200-day simple moving average near 1.1633; together, these form a dense resistance zone that must be reclaimed to alleviate the current bearish bias.
Consider going long on the Euro at 1.1530 today; stop-loss: 1.1520; targets: 1.1580, 1.1570.
Stock Analysis:
Australia ASX 200 Index
Market Overview:
The Australian ASX 200 index fell 77 points (0.9%) on Tuesday to close at 8,673, extending last week's decline and hitting its lowest level since early July. Market sentiment deteriorated as US stock index futures fell and the 10-year Treasury yield surged to a high not seen since 2007—approaching 5%—amid expectations of a 25-basis-point rate hike by the Federal Reserve. Local traders assign an 85% probability to a Reserve Bank of Australia rate hike later this month, with Governor Bullock expected to testify that further tightening may be needed to curb inflation. In China, a key trading partner, August data sent mixed signals: retail sales slowed and the unemployment rate rose, although industrial output improved.
Losses were widespread, led by the healthcare, non-energy mining, and financial sectors, though the consumer sector provided some support. The "Big Four" banks fell between 0.4% and 1.6%, while Macquarie (-2.8%) and BHP (-2.4%) also underperformed. Gold miners saw their share prices slide alongside the falling gold price; Northern Star Resources dropped 2.4% and Evolution Mining fell 3.4%.
Sector Performance:
Top-performing sectors: Healthcare, Consumer Staples (capital rotating into defensive sectors).
Worst-performing sectors: Materials (mining, gold stocks), Financials (Big Four banks, Macquarie), Information Technology.
Technical Analysis:
After opening lower on Tuesday, the index trended downward with volatility; rebounds were weak throughout the day, and it closed near its intraday low. The ratio of advancing to declining stocks was 116:160, with decliners outnumbering advancers, reflecting weak market risk appetite. The index closed at 8,672.5 points (down 77.4 points or 0.89%), marking a new 10-week low and the fifth consecutive day of losses. External Pressures: The US 10-year Treasury yield is approaching 5%, and oil prices have surged above $107; market concerns over rebounding inflation are fueling expectations of further Federal Reserve rate hikes, while the probability of a Reserve Bank of Australia (RBA) rate hike in September has risen to 85%. Technical Indicators: The index is trading below all short-term moving averages (5/20 EMA); the RSI has dropped near the oversold zone (approx. 29–30), indicating a dominant bearish trend, though there is potential for a minor short-term technical rebound; the MACD shows continued bearish divergence; and the Bollinger Bands are widening downwards, opening up room for further decline.
Wednesday Technical Outlook: The prevailing trend is bearish; an oversold RSI merely suggests conditions for a corrective rebound rather than a trend reversal. On Wednesday, market sentiment will likely be weighed down by expectations surrounding the Federal Reserve meeting, leading to range-bound trading rather than a sustained, sharp rally. Forecast for Wednesday:
Scenario 1 (Baseline Scenario – Higher Probability)
The index remains weak and range-bound, repeatedly testing lows.
• Upside: Rebounds face resistance in the 8740–8760 zone, making a clean breakout unlikely; any rally would be a technical correction from oversold levels, not a reversal.
• Downside: Testing the first support level at 8600–8630; if US stocks weaken further overnight and US Treasury yields continue to rise, the strong support zone of 8540–8500 will be tested.
Scenario 2 (Bearish Scenario)
US retail data significantly exceeds expectations, causing US Treasury yields to surge; the index breaks directly below 8600, targeting the 8540–8500 range and opening up further downside potential. Trading Strategy (Short-term Perspective)
Short-term Trading Strategy (Suitable for intraday / 1–3 day swings)
Bullish Strategy
1. Do not chase rebounds; consider opening a small long position only upon a pullback to the 8600–8630 support zone, accompanied by a stabilizing candlestick pattern and shrinking trading volume;
2. Stop-loss: Exit if the price breaks decisively below 8540;
3. Take-profit 1: 8740–8760; Take-profit 2: 8830–8850; prioritize locking in gains at resistance levels—do not overstay the trade.
Bearish Strategy
1. Consider shorting on rallies to the 8740–8760 resistance zone if upward momentum stalls and the price fails to rise despite high volume;
2. Stop-loss: Exit if the price establishes a firm footing above 8860;
3. Target 1: 8630–8600; Target 2: 8540–8500.
Key Risk Warnings:
External Macro Risks (Primary Risk): US retail data exceeding expectations and rising US Treasury yields; hawkish signals from the Federal Reserve putting further pressure on Australian stocks; Middle East tensions disrupting oil prices, exacerbating inflation concerns, and dampening expectations for RBA rate cuts.
Technical Risks: An oversold RSI does not preclude further declines; conditions can remain oversold in a bear market; a decisive break below 8500 would open up significant downside potential.
Domestic Risks: Market pricing in an RBA rate hike for September; further increases in inflation expectations could weigh on interest-rate-sensitive sectors (banking, real estate).
China Shanghai Composite Index
Market Overview:
The Shanghai Composite Index fell 0.3% on Tuesday to 3875 points, hitting a low not seen in over a month, while the Shenzhen Component Index rose 0.3%. Mixed economic data heightened concerns regarding the fragility of China's economic recovery. Fixed-asset investment declined by 7.2% between January and August, marking the steepest drop for this period since January–April 2020. The year-on-year growth rate of retail sales in August slowed to 0.4%, marking a three-month low. The unemployment rate rose from 5.2% in July to 5.3%, reaching a five-month high. Offering some relief, the year-on-year decline in the house price index narrowed to 3% in August—the smallest drop since December 2025—while industrial output climbed from 4.5% in July to 5.2%.
China's growth has fallen short of the government's annual target of 4.5%–5.0% for the second consecutive quarter, increasing pressure for further stimulus. Notable laggards included CATL (-1.4%), Zhongji Innolight (-1.3%), and Suzhou TFC Optical Communication (-2.3%).
Sector Performance:
Leading Sectors
Semiconductors / PCBs / Electronics; Wind Power Equipment (Power Equipment sub-sector); IT Innovation (Xinchuang); High-Dividend Stocks
Laggard Sectors
Agriculture, Forestry, Animal Husbandry & Fishery; Tourism & Hotels (Discretionary Consumption); New Energy Vehicles / Power Batteries; Non-bank Financials (Insurance)—note: if external markets turn hawkish and risk appetite declines, non-bank financials face pressure, whereas banking stocks tend to be more resilient.
Technical Analysis:
The Shanghai Composite Index closed at 3,864.28 points on Tuesday (-0.54%), with a combined market turnover of 1.63 trillion yuan, reflecting reduced volume. Stocks fell across the board, with over 4,400 issues declining; the STAR Market, semiconductors, and wind power equipment showed relative resilience, while the consumer and agricultural sectors weakened. Tuesday (Sept 15) Technical Review: Candlestick and Trend—The index opened low, rallied but met resistance, and then pulled back; it ranged from a high of 3,891 to a low of 3,858, closing with a small bearish candle. The rebound failed to break above the 5-day moving average (3,904), with overhead moving averages exerting pressure, and the close returned to the vicinity of the previous low range (3,850–3,860). Indicator Status: The MACD green histogram expanded, the KDJ indicator formed a bearish cross (pointing downward) with the J-value entering the oversold zone; there is an expectation of a rebound from oversold levels in the short term, though no clear signal of stabilization has emerged; the DMA indicator formed a bearish cross, indicating that bearish forces remain dominant. Trading volume stood at 1.63 trillion yuan, a decrease from Monday; the decline on lower volume suggests that selling pressure was not released in a concentrated burst, yet buying interest remains sluggish. Market sentiment is at a freezing point, with an advance-decline ratio approaching 1:4; most stocks are weak, while only a few technology growth stocks are bucking the trend.
Technical Outlook for Wednesday (Sept 16): Key Context: The Federal Reserve's policy meeting concludes early Thursday morning; the market is engaging in risk aversion and a "wait-and-see" approach, meaning Wednesday's market action will be heavily influenced by external expectations. Scenario 1 (Higher Probability): Oscillating to bottom out. The index opens slightly lower and first tests the 3850–3852 support level. If this level holds, a technical oversold rebound may occur, targeting the 3880–3890 range; however, without significant volume, a direct breakthrough of the 3900 resistance level is unlikely, making it a weak rebound subject to further volatility. If the 3850 level is decisively broken, it will open up room for a further decline toward the 3800 area. Scenario 2: Rebound with stabilizing volume. A rebound signaling stabilization occurs only if Wednesday sees increased volume (combined market turnover returning above 1.75 trillion yuan) and the index holds above 3880, closing above the 5-day moving average; the rebound target would be the 3910–3920 range. This scenario requires an influx of new capital, which is currently lacking. Scenario 3: Breakdown. If overnight overseas markets plunge and US Treasury yields continue to rise, causing a direct break below the 3850 support level, the index will likely continue its downward momentum to test the 3800 area.
Trading Strategy:
The market is currently characterized by weak oscillation and a pre-event risk-aversion phase; it is not suitable for heavy or full positions. It is recommended to keep overall exposure between 40% and 60% and wait for the Federal Reserve's decision before considering increasing positions. 1. For Existing Holders
• If the index pulls back to the 3850 level, do not cut losses blindly; however, if it rebounds to the 3880–3900 resistance zone without significant trading volume, consider reducing positions—do not chase highs or add to positions.
• If the 3850 level is decisively breached (closing below it on high volume), further reduce positions to guard against the risk of a drop toward 3800.
2. For Cash Holders
• Do not rush to "buy the dip"; wait for one of two signals: ① the 3850 support holds and a high-volume bullish candle appears; or the index pulls back near 3800 and shows signs of stabilizing.
• For short-term trades, prioritize small test positions; do not enter the market with a large amount of capital all at once.
• Sector-specifics: Capital is showing localized activity in the technology sector (semiconductors, wind power equipment), but the overall market remains weak and sector volatility is high—do not chase highs. Avoid the consumer and agriculture sectors, which remain consistently weak.
Key Risk Warnings:
External Event Risk: The Federal Reserve's policy meeting takes place early Thursday morning; whether rates are raised or held steady, significant volatility in A-shares is likely. A hawkish stance would suppress A-shares, whereas a dovish stance could provide an opportunity for a rebound.
Technical Breakdown Risk: The 3850 level serves as both a key psychological and technical support; a high-volume breach would open up downside potential in the short term, likely leading to a slow, steady decline in the index and a broad sell-off across individual stocks.
Volume Risk: The market is currently seeing low trading volume, and rebounds on low volume tend to lack sustainability. Without volume support, any rebound is likely to be a brief spike followed by a pullback.
Stock Divergence Risk: While the index fluctuates, there is significant divergence among individual stocks; even if the index rebounds slightly, many stocks may continue to fall. Do not base individual stock trades solely on the index's performance.
Disclaimer: The information contained herein (1) is proprietary to BCR and/or its content providers; (2) may not be copied or distributed; (3) is not warranted to be accurate, complete or timely; and, (4) does not constitute advice or a recommendation by BCR or its content providers in respect of the investment in financial instruments. Neither BCR or its content providers are responsible for any damages or losses arising from any use of this information. Past performance is no guarantee of future results.
Lebih Liputan





2026 © - All Rights Reserved by BCR Co Pty Ltd
Pendedahan Risiko:Instrumen derivatif diniagakan di luar bursa dengan margin, yang bermakna ia membawa tahap risiko yang tinggi dan terdapat kemungkinan anda boleh kehilangan seluruh pelaburan anda. Produk-produk ini tidak sesuai untuk semua pelabur. Pastikan anda memahami sepenuhnya risiko dan pertimbangkan dengan teliti keadaan kewangan dan pengalaman dagangan anda sebelum berdagang. Cari nasihat kewangan bebas jika perlu sebelum membuka akaun dengan BCR.
BCR Co Pty Ltd (No. Syarikat 1975046) ialah syarikat yang diperbadankan di bawah undang-undang British Virgin Islands, dengan pejabat berdaftar di Trident Chambers, Wickham’s Cay 1, Road Town, Tortola, British Virgin Islands, dan dilesenkan serta dikawal selia oleh Suruhanjaya Perkhidmatan Kewangan British Virgin Islands di bawah Lesen No. SIBA/L/19/1122.
Open Bridge Limited (No. Syarikat 16701394) ialah syarikat yang diperbadankan di bawah Akta Syarikat 2006 dan berdaftar di England dan Wales, dengan alamat berdaftar di Kemp House, 160 City Road, London, England, EC1V 2NX. Open Bridge Limited bertindak semata-mata sebagai pemproses pembayaran untuk BCR Co Pty Ltd dan tidak menyediakan sebarang perkhidmatan kewangan, perdagangan atau pelaburan bagi pihaknya. Peranan Open Bridge Limited adalah terhad kepada pemprosesan pembayaran.


 English
 简体中文
简体中文
 繁體中文
繁體中文
 Bahasa
Melayu
Bahasa
Melayu
 Tiếng
Việt
Tiếng
Việt
 ไทย
ไทย
 日本語
日本語
 한국어
한국어
 ភាសាខ្មែរ
 español