0
US Dollar Index
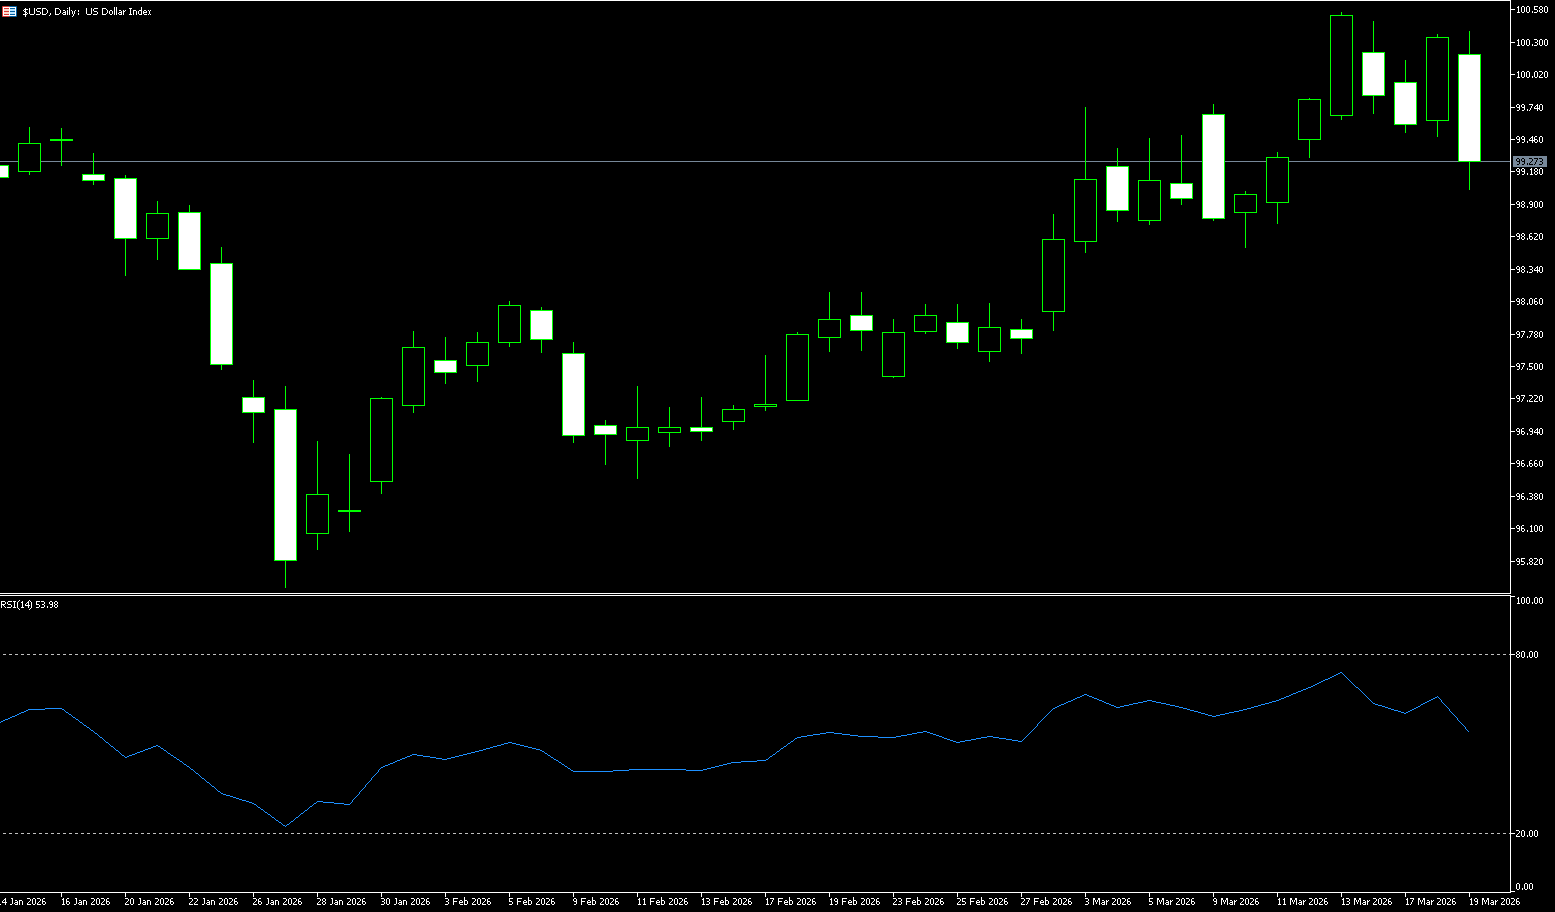
The US dollar index remained below 99.50 on Thursday, after a sharp rebound in the previous session, supported by an increasingly hawkish outlook from the Federal Reserve. The central bank, as expected, kept the federal funds rate unchanged, citing the uncertain economic impact of the war with Iran, while emphasizing that upside risks to inflation remain high. The Fed stated it would not cut rates until there are signs of easing inflation, although it still expects one rate cut this year and another in 2027, consistent with its December outlook. Data released on Wednesday showed that US producer prices rose more than expected in February. Investors are now awaiting the latest weekly jobless claims for new insights into the labor market. Meanwhile, oil prices climbed further after attacks on Middle Eastern energy infrastructure continued amid the ongoing conflict with Iran. President Donald Trump temporarily waived the Jones Act to reduce the cost of transporting oil, natural gas, and other commodities within the United States.
The US dollar index has maintained a strong overall trend recently, mainly due to the escalating conflict between Iran and the Middle East, which has driven up global energy prices and inflation expectations. The US, as a net energy exporter, has benefited relatively. Meanwhile, the Federal Reserve's reduction of its 2026 rate cut expectations due to inflationary pressures has strengthened the dollar's interest rate advantage and safe-haven appeal. Even with weak short-term data, geopolitical risks have quickly offset the downside potential. The RSI (14) has fallen from above 70 to 63, easing overbought pressure but still showing bullish momentum, making it suitable to watch for support and rebound signals. The US dollar index is in an upward channel on the daily chart, currently testing the key support level of 99.66 (the nine-day moving average) and the 99.50 level. If it holds, a rebound to 100 (a psychological level) is possible. On the downside, watch the key support level of 99.00 and the 98.50 level.
Today, consider shorting the US Dollar Index at 99.30, with a stop-loss at 99.40 and targets at 98.80 and 98.70.
WTI Crude Oil
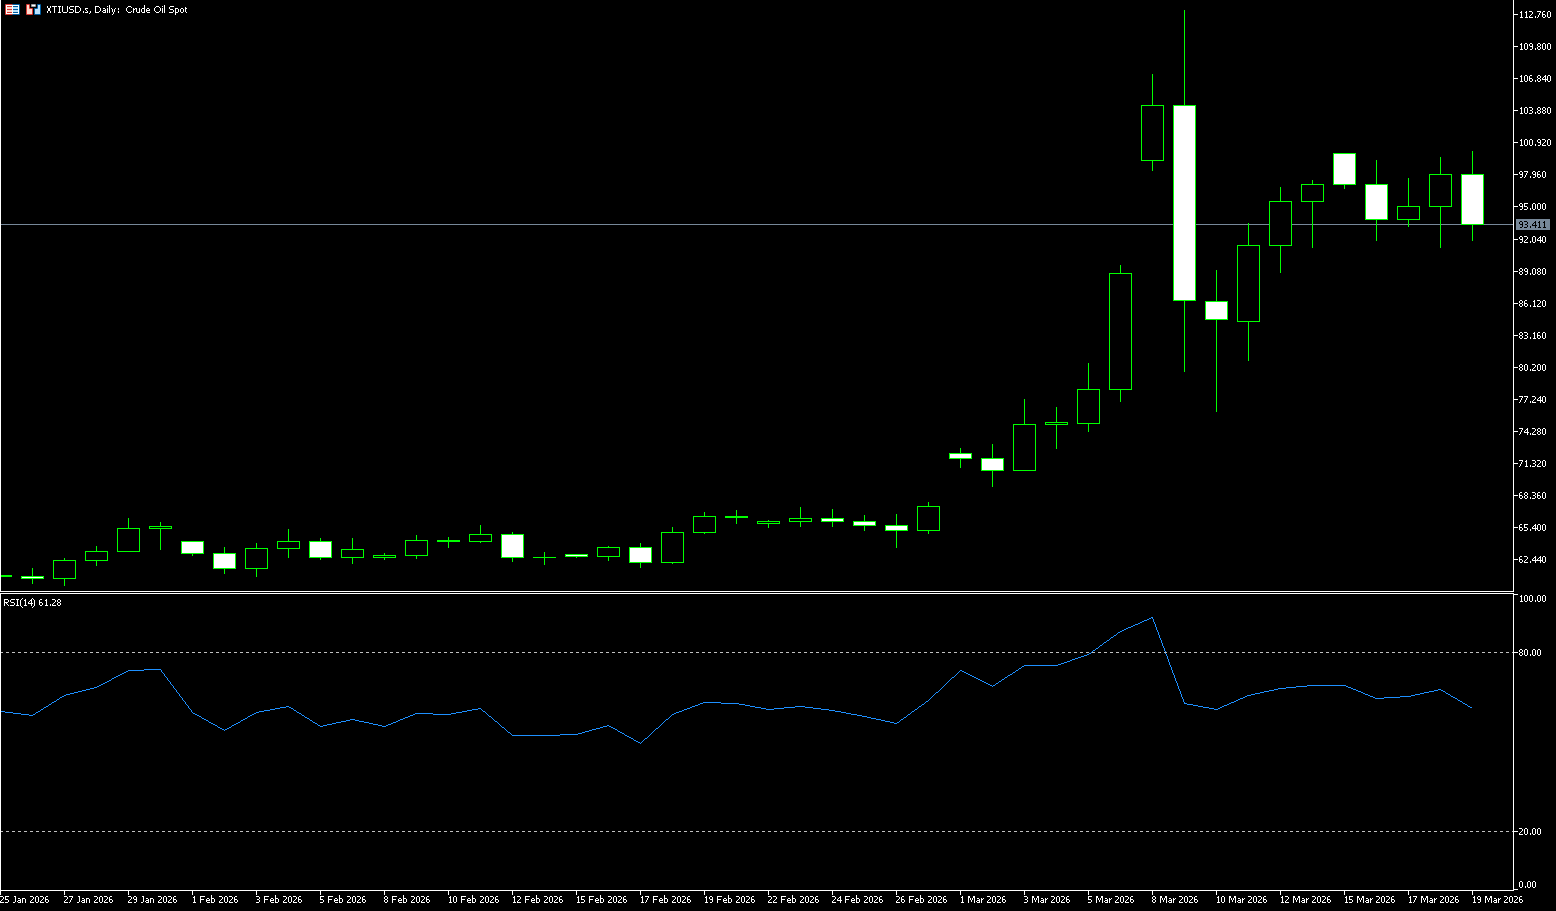
US crude oil rose nearly 3% mid-week, trading around $98.30 per barrel, as the risk of energy supply disruptions in the Middle East escalated sharply. It fell about 4% to $64.50 in early trading on Thursday. The Iranian Revolutionary Guard threatened to attack Gulf energy facilities in retaliation for the attack on the Pars gas field, followed by a missile attack on Qatar's Ras Raffan industrial city that caused significant damage, drastically increasing the risk of energy supply disruptions in the Middle East. Analysts pointed out that the attack on Iran's southern Pars gas field directly pushed up oil and gas prices, and with shipping through the Strait of Hormuz already disrupted, total Middle Eastern oil production is expected to decrease by 7 million to 10 million barrels per day. To alleviate the surge in oil prices, the Trump administration announced a 60-day suspension of the Jones Act and a temporary lifting of federal emissions restrictions on summer blended gasoline.
On the data front, the EIA reported that US crude oil inventories increased by 6.2 million barrels last week, exceeding expectations. In the next 2-3 days, the market will shift from "data-driven" to "policy-driven." Due to unresolved geopolitical risks and increasing inventories, the price divergence between Brent and WTI crude oil is likely to continue, resulting in wide fluctuations in the short term. Currently, it remains in the $90-$100 range, with a cumulative increase of over 40%. The de facto closure of the Strait of Hormuz has led to supply disruptions, and the consensus is that oil prices will remain above $100 under prolonged blockade. Technically, the US dollar index is currently at the psychological level of 100, entering a consolidation phase to choose a direction. While the MACD shows signs of turning positive, momentum is limited. The upper resistance zone is locked between $100.00 (psychological level) and $99.91 (this week's high). Lower support levels to watch are 92.49 (9-day simple moving average) and the 90.00 (psychological level).
Today, consider going long on spot crude oil at 94.15, with a stop-loss at 94.00 and targets at 96.00 and 97.00.
Spot Gold
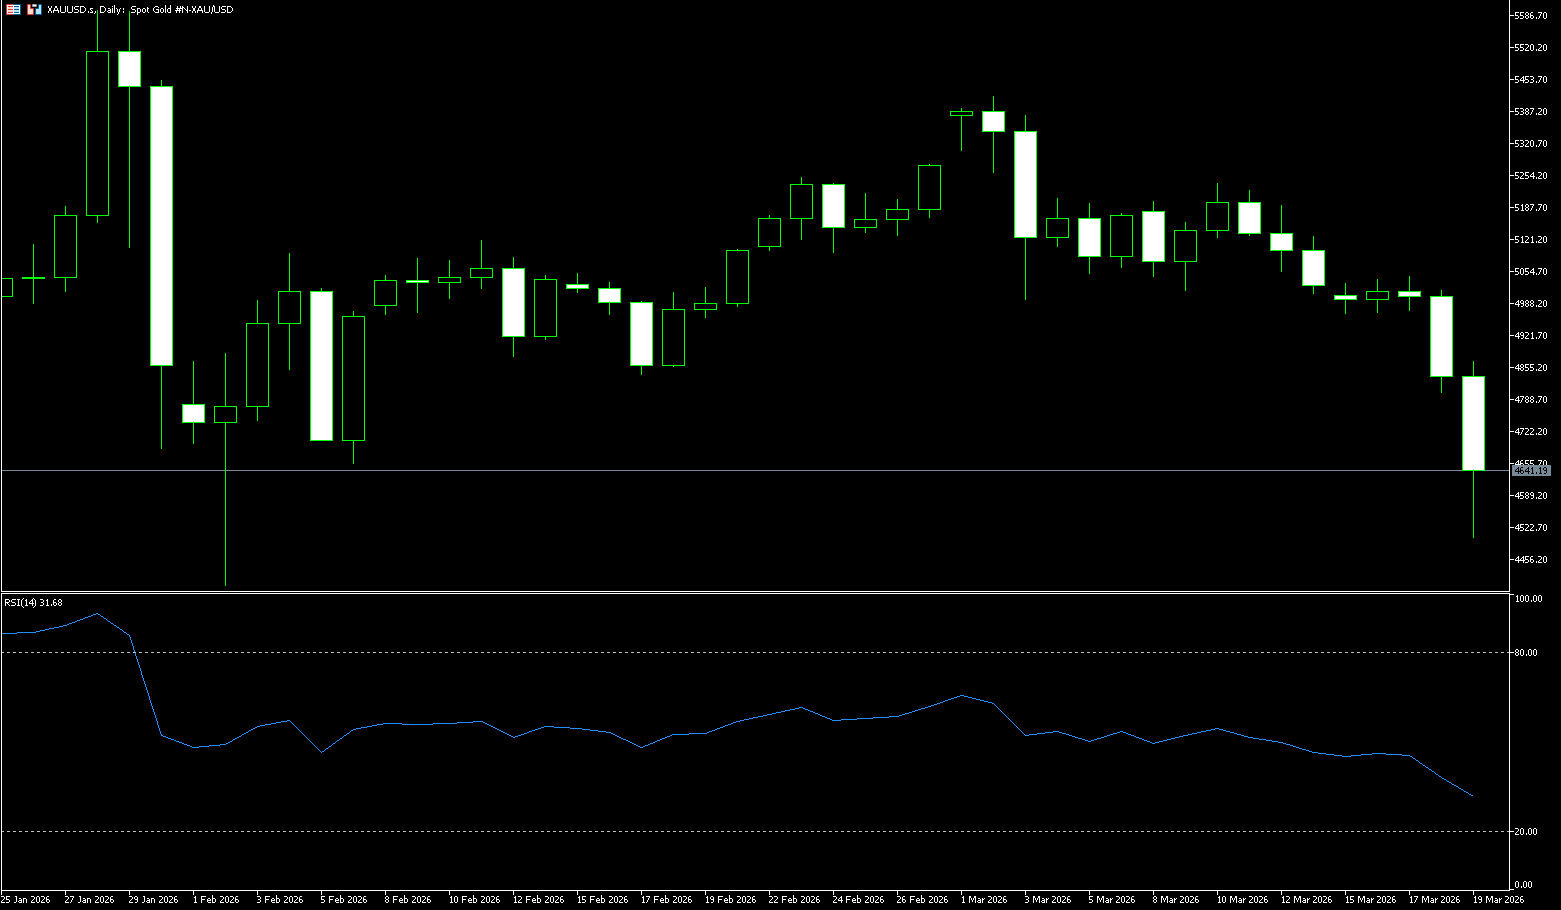
Gold fell below $4,700 an ounce on Thursday, marking its seventh consecutive day of declines and hitting a near six-week low, as the Federal Reserve's hawkish outlook diminished its appeal as a non-yielding commodity. The Fed kept interest rates unchanged as expected, citing the uncertain economic impact of the Iranian conflict and the continued upside risks to inflation. Policymakers hinted that rate cuts would remain paused until there is clearer evidence that price pressures are easing, although they still expect one rate cut this year. Meanwhile, geopolitical tensions escalated after Iran launched a missile at the site of one of the world's largest liquefied natural gas facilities in Qatar, followed by an Israeli attack on Iran's South Pars gas field. While this supported safe-haven demand, it also boosted oil prices. Gold is still up about 12% year-to-date, but momentum has weakened as expectations of a rate cut diminished and some investors sold to meet margin requirements.
Gold is biased bearish in the short term as prices slipped below the 20-day simple moving average, near 5,109, and are under pressure at $4.502 (this week's low). The 50-day, 100-day, and 200-day simple moving averages are rising below the price, maintaining a broader uptrend, but are now acting more as a medium-term rather than an immediate directional driver. The 14-day Relative Strength Index (RSI) is at 41.15, biased to the downside but still above oversold territory, suggesting that downward momentum is strengthening but has not yet signaled a sell-off. Initial resistance is seen at $4,900 (the psychological level), and a daily close above 4,950 would alleviate current bearish pressure and pave the way for 5,000. On the downside, immediate support lies at $4.502 (this week's low) and the $4,600 level, followed by $4,402 (the February low), where buyers are expected to defend the broader bullish structure.
Today, consider going long on spot gold at 4,650, with a stop loss at 4.645 and targets at 4,700 and 4,730.
AUD/USD
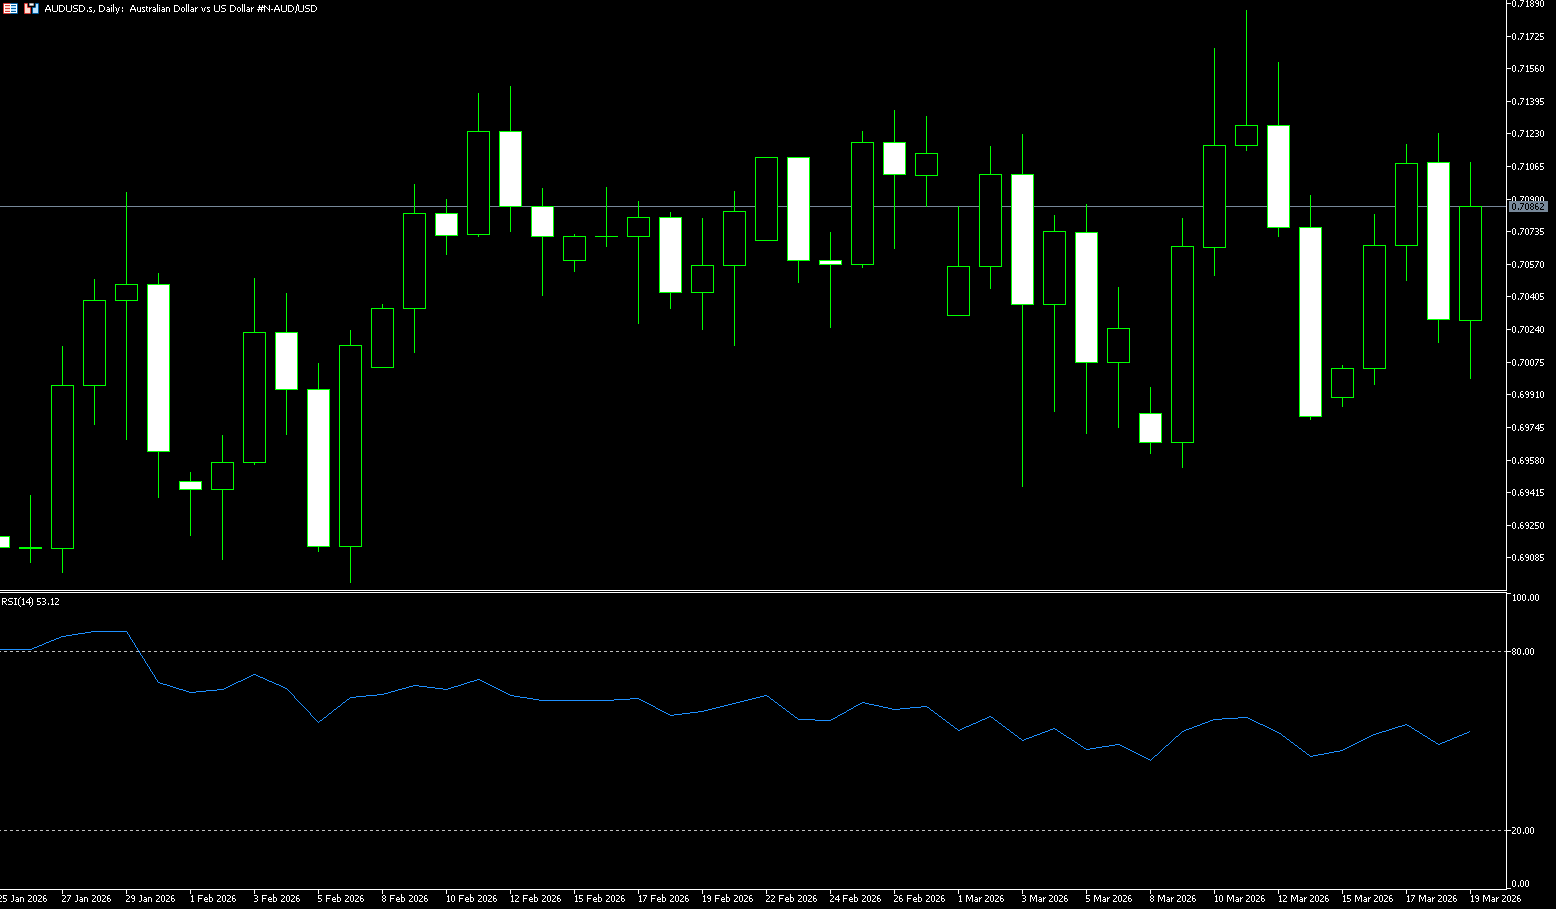
The Australian dollar remained strong on Thursday, nearing the key 0.7100 area, primarily due to a sharp sell-off in the US dollar. Furthermore, mixed results from the Australian employment report, coupled with recent positive data from China, continued to support the pair's strong upward momentum. After falling more than 1% in the previous session, investors assessed the latest employment report. The data showed a surge of 48,900 jobs in February, well above the predicted 20,000, highlighting the continued resilience of the labor market. However, the unemployment rate unexpectedly rose to 4.3%, revealing a more complex situation. Nevertheless, this unemployment rate remains at historically low levels, reinforcing the Reserve Bank of Australia's view that the economy can withstand tighter policy. While their impact on interest rate expectations was minimal, the market remains divided on the possibility of another rate hike in May. Meanwhile, the central bank warned that the escalation of the Middle East wars poses a substantial risk to the domestic economy and hinted at a potential for a more severe global shock, with persistently high inflation potentially putting pressure on some households and borrowers. However, they also emphasized that Australia's financial system remains generally resilient.
On the daily chart, the Australian dollar is trading at 0.7100 against the US dollar. The short-term bias is bullish, as the spot price is firmly above the 55, 100, and 200-day simple moving averages, all of which are trending upwards and constitute a medium-term uptrend. The latest pullback remains relatively shallow within the broader uptrend. The Relative Strength Index (RSI) is around 50.50, holding above the midline and showing positive but moderate momentum, while the waning Average Directional Index (ADX) is near 21, indicating the trend is losing strength and encouraging a range-bound bullish stance rather than an impulsive breakout view. Immediate resistance is at the 0.7100 level, followed by the recent upper limit near 0.7147. A break above this level would target 0.7200 (the psychological level). On the downside, initial support is seen at the psychological level of 0.7000. A break below this level would expose the low of the 55-day simple moving average at 0.6958.
Consider going long on the Australian dollar today at 0.7085, with a stop-loss at 0.7070 and targets at 0.7150 and 0.7160.
GBP/USD
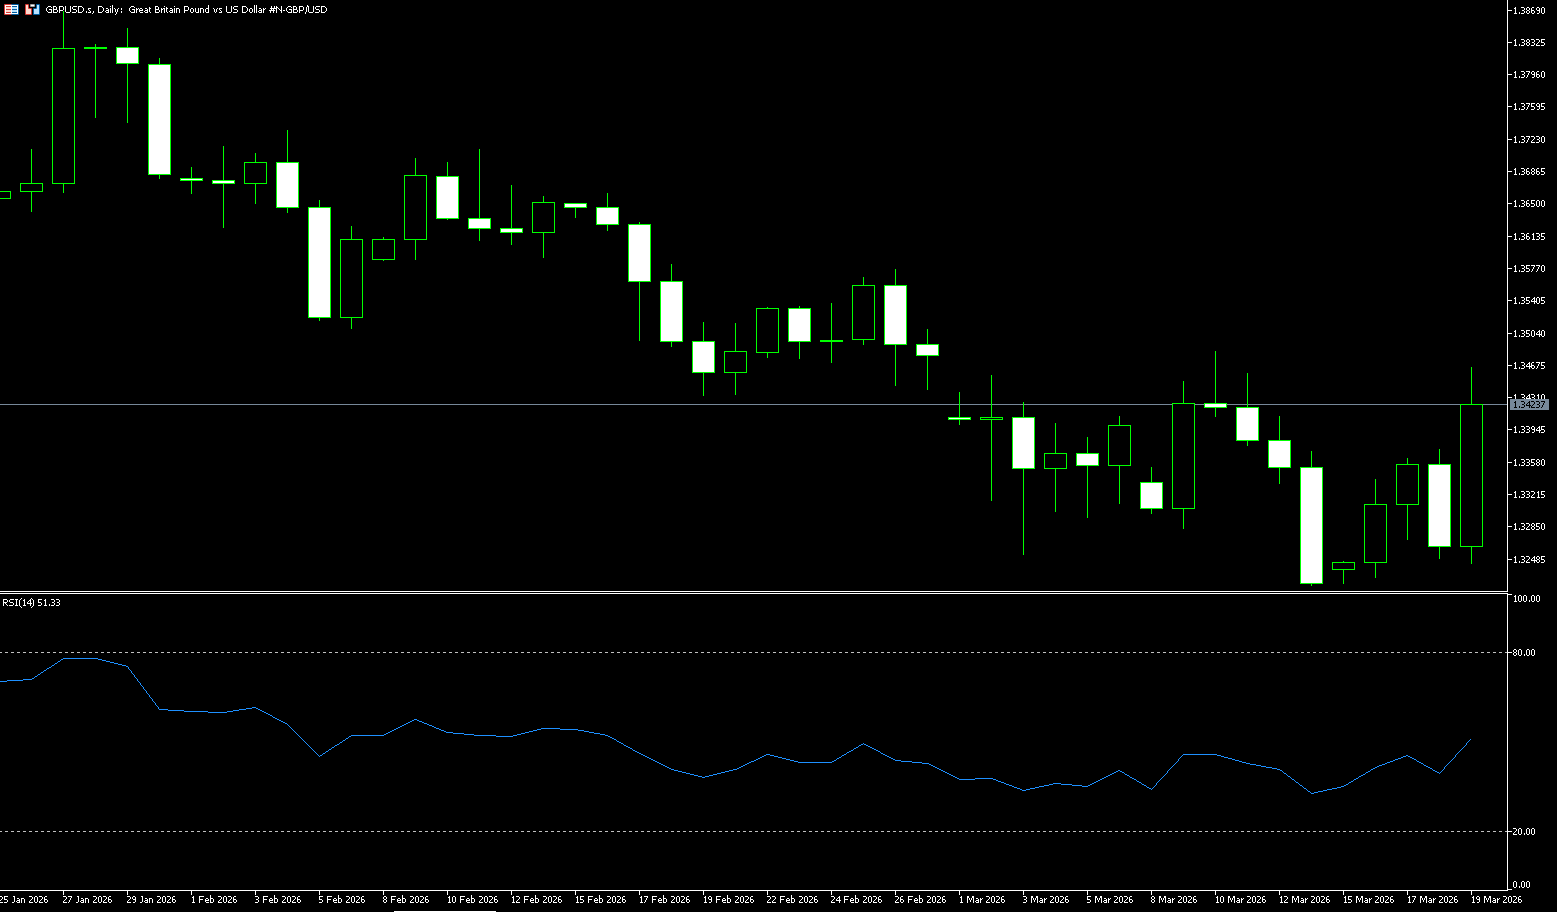
The GBP/USD pair accelerated its intraday rebound, hitting a five-day high on Thursday, slightly above the 1.3430 level. The pound's strong performance was a reaction to the sharp decline in the US dollar, while investors were also assessing the Bank of England's hawkish stance earlier in the day. European gas prices surged 25% due to the attack on a key Qatari liquefied natural gas facility, while Brent crude rose to $117 a barrel, increasing inflation risks for the UK economy. The market now expects the Bank of England to take a more hawkish stance, although it is widely anticipated that the central bank will keep interest rates unchanged today. Looking ahead, traders expect a tightening of approximately 32 basis points by the end of the year, equivalent to more than a quarter of a percentage point in interest rate hikes. The probability of a June rate hike is over 50%, and the expectation of a full rate hike by September is already priced into the market. Meanwhile, the latest UK employment report showed slower wage growth and the unemployment rate stabilizing at 5.2%, both lower than expected.
Technical analysis on the daily chart shows a strengthening bearish bias as GBP/USD has retreated from the upper boundary of its descending channel pattern. Furthermore, the 14-day Relative Strength Index (RSI) hovering below 40 confirms continued downward pressure and focuses on the recent series of intraday lows. The pair is likely to explore lower levels, looking for key support at the three-month low of 1.3253, which was reached on December 3rd. Further declines would put downward pressure on GBP/USD, causing it to hover near the lower boundary of the descending channel around 1.3140, followed by the 11-month low of 1.3010. On the upside, immediate resistance is testing this week's high of 1.3374. A further breakout would indicate a bullish bias and support the GBP/USD pair challenging the 1.3400 level.
Consider going long GBP at 1.3325 today, with a stop-loss at 1.3310 and targets at 1.3370 and 1.3380.
USD/JPY
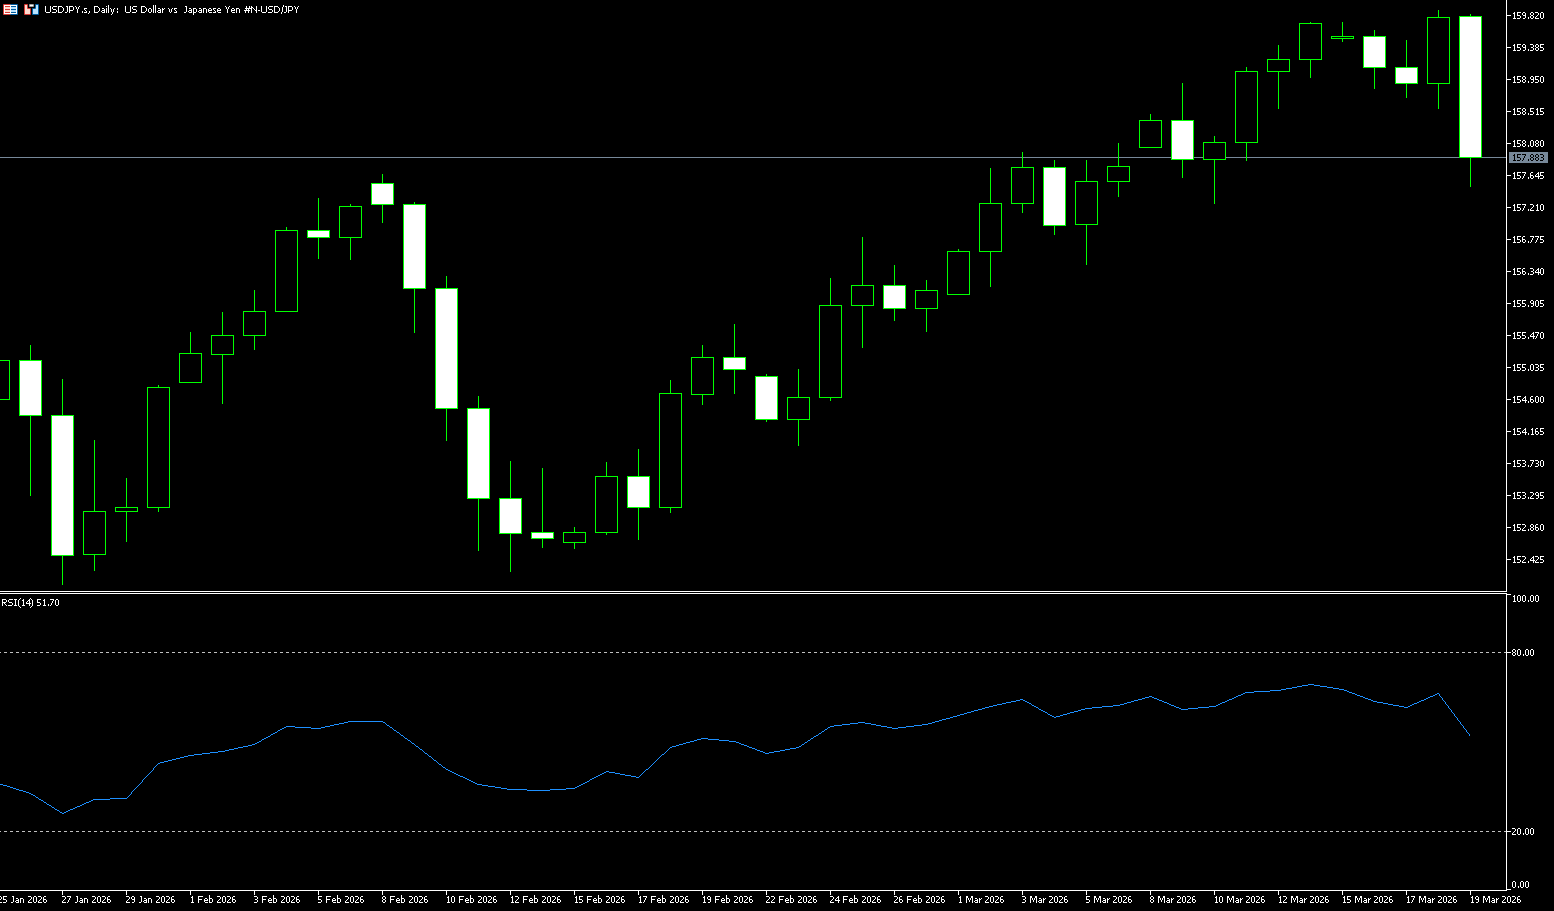
On Thursday, USD/JPY fell to 157.80 as investors assessed the decisions of the two central banks. On one hand, the Federal Reserve decided to maintain stable interest rates, with Chairman Jerome Powell stating that rising energy prices would push up overall inflation. Powell stated that if inflation did not progress, there would be no rate cut. Powell's comments supported the dollar and sent a hawkish signal. On the other hand, the Bank of Japan also kept its interest rate at 0.75%, but with an extremely dovish tone. Eight members voted to keep the rate unchanged, while one voted to raise it. The Bank of Japan emphasized that if the economy and prices develop as expected, it will continue to raise policy rates. Furthermore, it stated that it will implement monetary policy as needed to sustainably and continuously achieve its 2% inflation target. Meanwhile, Prime Minister Sanae Takaichi will meet with US President Donald Trump later today to discuss potential economic and military cooperation, balancing a delicate diplomatic situation following Trump's initial urging of Japan to send warships to the Strait of Hormuz before withdrawing his request.
Both the Federal Reserve and the Bank of Japan maintained a cautious tone, suggesting the relative strength of the US dollar is likely to continue. The USD/JPY pair may resume its upward momentum after a pullback. In the short term, the 159.00-160.00 range will remain a key area of intense competition between bulls and bears. The 14-day Relative Strength Index (RSI), after hovering near the 50 midline, has rebounded to the 65.79 area, indicating upward momentum rather than overbought conditions. Immediate support lies at the 157.00 level. A deeper decline would expose the next support at 156.53 (the 50-day simple moving average), which, as long as the price holds above 156, will protect the broader bullish structure. On the upside, initial resistance appears at 158.50; a sustained break above this level would pave the way for the current swing towards the 159.89 area (this week's high).
Consider shorting the US dollar today at 158.00, with a stop-loss at 158.20 and targets at 157.00 and 156.90.
EUR/USD
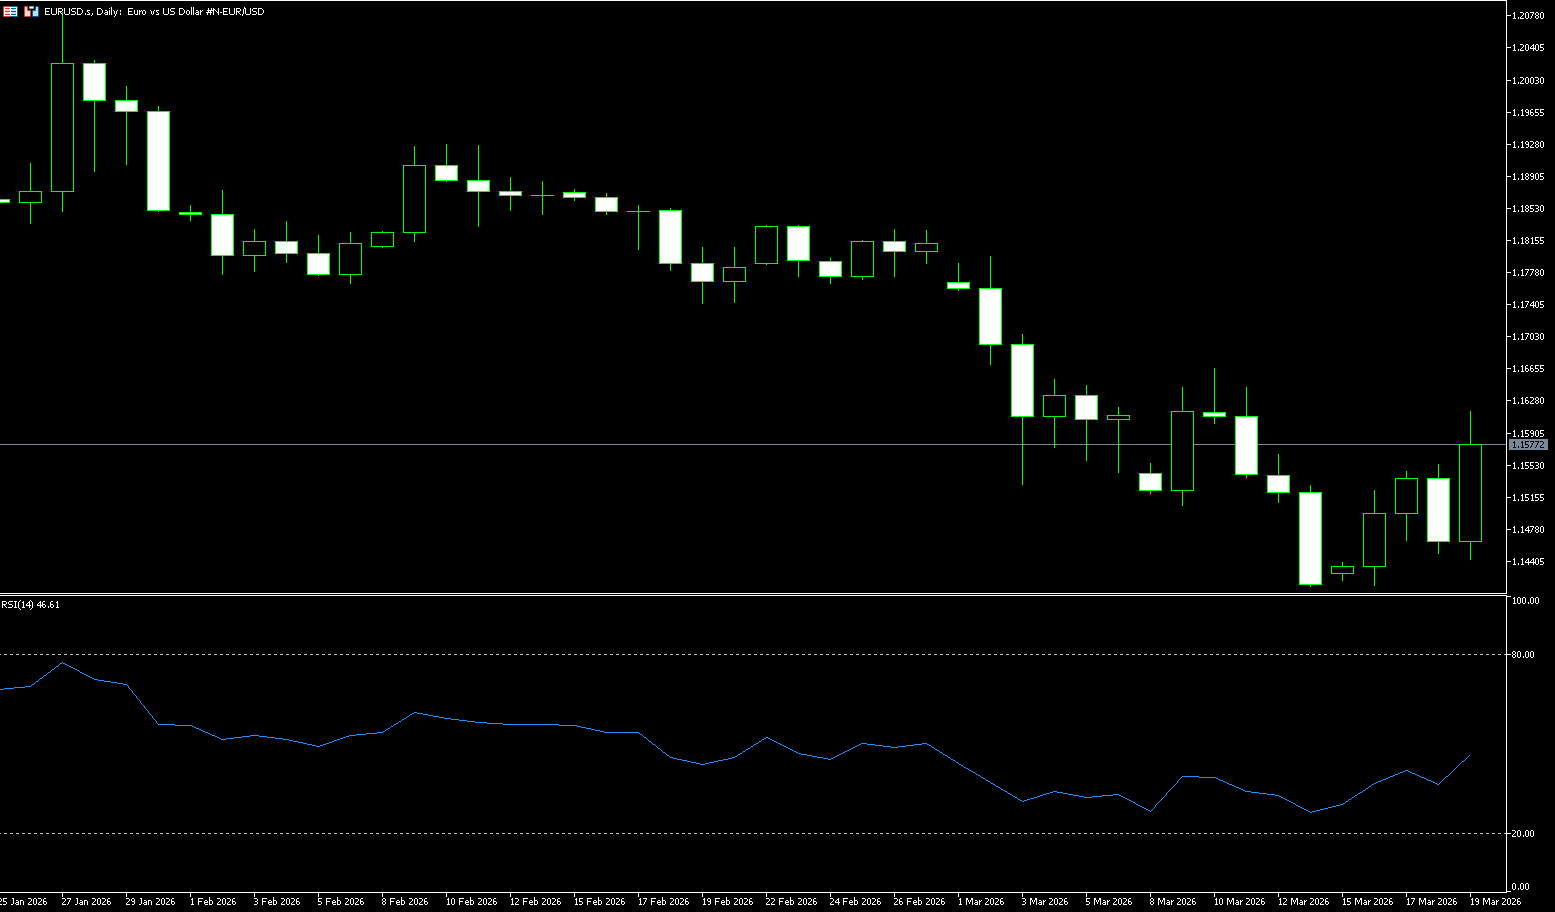
The euro/dollar pair continued its upward trend in late North American trading on Thursday, climbing to a six-day high and challenging the key 1.1600 level. The continued weakness of the US dollar was the main driver of the rise, while the European Central Bank's cautious stance also helped stabilize market sentiment towards the euro. The pair traded at 1.1582 after rebounding from a daily low near 1.1440. Reuters, citing three sources, reported that a generally weaker dollar and policymakers' concerns about the Middle East conflict could prompt discussions about interest rate hikes as early as April. The Eurozone's heavy reliance on imports and soaring oil and gas prices are putting upward pressure on energy prices, causing concern among European Central Bank (ECB) policymakers. Therefore, the ECB maintained its deposit facility rate at 2%, its main refinancing rate at 2.15%, and its marginal lending rate at 2.40%, all unchanged. The ECB's monetary policy statement indicated that the medium-term impact will depend on the intensity and duration of the conflict and how energy prices affect consumer prices and the economy.
The euro/dollar pair recovered losses from the previous trading day during Thursday's session, hovering around 1.1580. Daily chart technical analysis suggests a continued bearish bias for the pair. The short-term bias is slightly bearish as the euro/dollar remains below its 9-day and 50-day simple moving averages, limiting attempts to rally near 1.15 and 1.16 respectively. The short-term moving averages are below the medium-term trend and are moving lower with the price, reinforcing downward pressure following the recent series of closes below 1.19. The 14-day Relative Strength Index (RSI) momentum indicator is 35.40, remaining below the 50 line, confirming the current selling momentum but not yet signaling deep oversold conditions. The main support level for EUR/USD is likely at the seven-month low of 1.1411 reached on March 13th. Further support lies near the lower boundary of the descending channel, around 1.1310. On the upside, initial resistance is at the upper boundary of the ascending channel, around 1.1600, followed by the 50-day simple moving average at around 1.1730.
Consider going long on EUR/USD today at 1.1570, with a stop-loss at 1.1560 and targets at 1.1630 and 1.1650.
Disclaimer: The information contained herein (1) is proprietary to BCR and/or its content providers; (2) may not be copied or distributed; (3) is not warranted to be accurate, complete or timely; and, (4) does not constitute advice or a recommendation by BCR or its content providers in respect of the investment in financial instruments. Neither BCR or its content providers are responsible for any damages or losses arising from any use of this information. Past performance is no guarantee of future results.
Lebih Liputan


Pendedahan Risiko:Instrumen derivatif diniagakan di luar bursa dengan margin, yang bermakna ia membawa tahap risiko yang tinggi dan terdapat kemungkinan anda boleh kehilangan seluruh pelaburan anda. Produk-produk ini tidak sesuai untuk semua pelabur. Pastikan anda memahami sepenuhnya risiko dan pertimbangkan dengan teliti keadaan kewangan dan pengalaman dagangan anda sebelum berdagang. Cari nasihat kewangan bebas jika perlu sebelum membuka akaun dengan BCR.
BCR Co Pty Ltd (No. Syarikat 1975046) ialah syarikat yang diperbadankan di bawah undang-undang British Virgin Islands, dengan pejabat berdaftar di Trident Chambers, Wickham’s Cay 1, Road Town, Tortola, British Virgin Islands, dan dilesenkan serta dikawal selia oleh Suruhanjaya Perkhidmatan Kewangan British Virgin Islands di bawah Lesen No. SIBA/L/19/1122.
Open Bridge Limited (No. Syarikat 16701394) ialah syarikat yang diperbadankan di bawah Akta Syarikat 2006 dan berdaftar di England dan Wales, dengan alamat berdaftar di Kemp House, 160 City Road, London, City Road, London, England, EC1V 2NX. Entiti ini bertindak semata-mata sebagai pemproses pembayaran dan tidak menyediakan sebarang perkhidmatan perdagangan atau pelaburan.

 English
 简体中文
简体中文
 繁體中文
繁體中文
 Bahasa
Melayu
Bahasa
Melayu
 Tiếng
Việt
Tiếng
Việt
 ไทย
ไทย
 日本語
日本語
 한국어
한국어
 ភាសាខ្មែរ
 español