


0
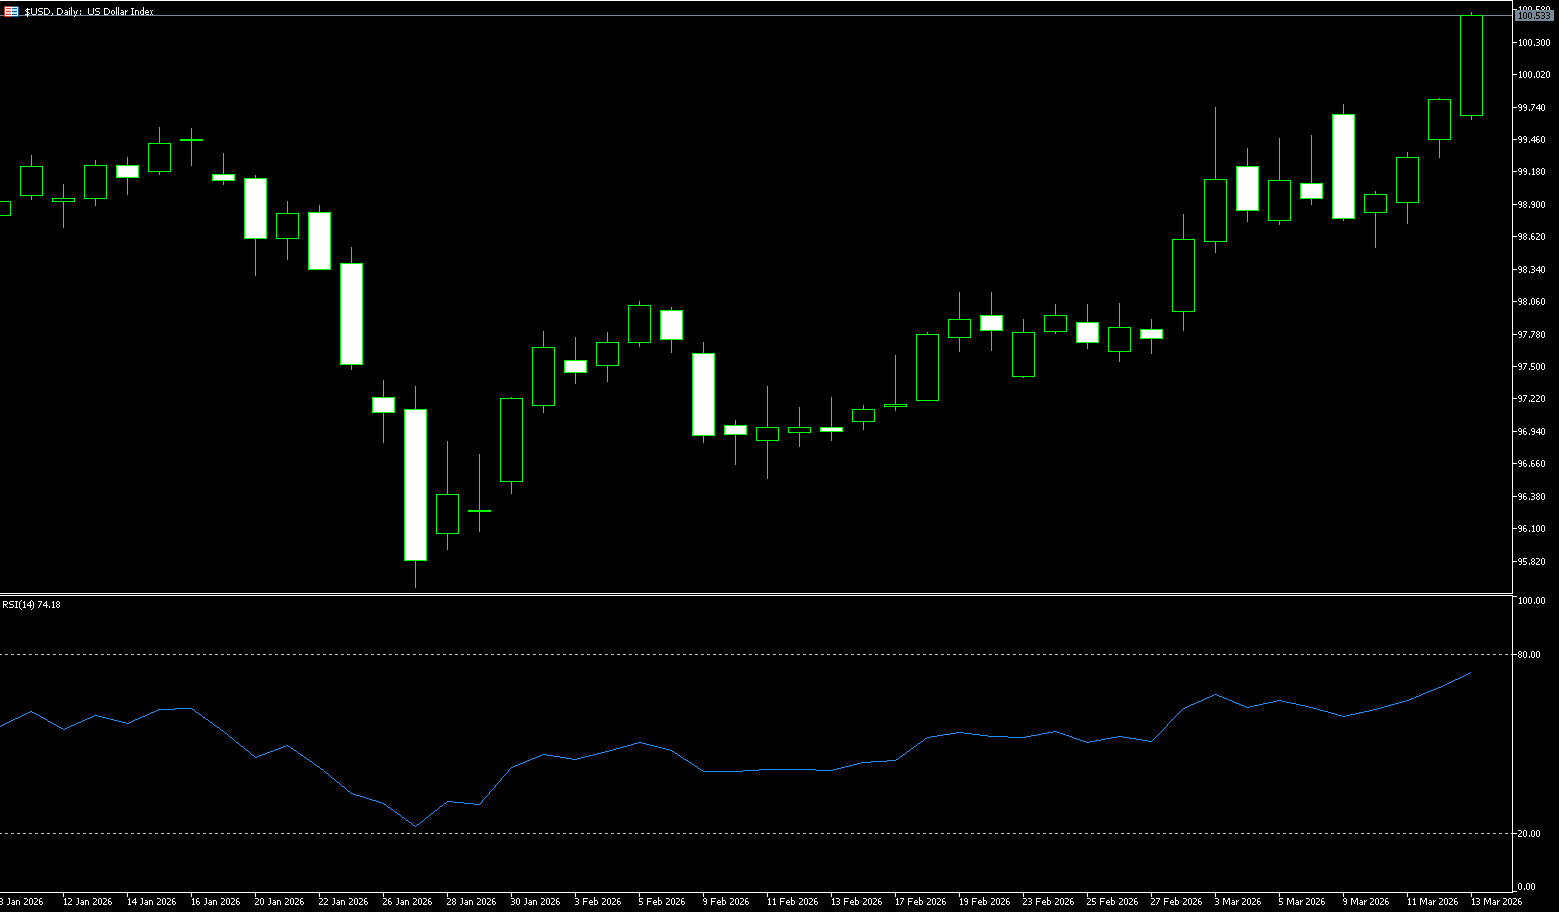
The US Dollar Index
The US dollar index climbed to around 100.59 on Friday, its highest level since mid-May 2025, and is on track for its second consecutive weekly gain, as traders continue to favor the dollar as a safe haven amid escalating tensions with Iran and a lack of prospect of an imminent resolution. Defense Secretary Peter Hergese told reporters that the US would launch its largest strike to date against Iran on Friday. Oil prices also recovered after earlier declines and remain near their highest levels since 2022. Investors believe the US's energy independence makes it more competitive than other economies. The Federal Reserve will decide on monetary policy next week, and while the federal funds rate is not expected to change, the market will be closely watching policymakers' outlook for the remainder of the year, especially given the recent rise in energy prices and how inflation might evolve. Investors currently only expect the Fed to cut rates once in 2026. Meanwhile, oil prices may be somewhat constrained in the coming days, depending on the actual size of reserve releases. However, the release of oil reserves is a temporary measure, and only military de-escalation can sustainably lower crude oil prices. The International Energy Agency's actions may be sending an implicit signal to the market that expectations for an impending ceasefire are low. In our view, these mixed signals may prevent the dollar from falling further today unless some positive news emerges regarding easing tensions.
The US dollar index generally traded in a high-level consolidation pattern last week, primarily fluctuating between 98.66 (20-week simple moving average) and 100.95 (May 2025 high). Short-term upward momentum is increasing, but downward pressure is also rising. The direction depends on the situation in the Middle East and expectations for Federal Reserve policy. The dollar index's failure to break through 99.70 marks a turning point in risk sentiment in 2026, as the weakening of the "energy doomsday" trade and the actions of the G7/International Energy Agency have reduced safe-haven demand for the dollar. He emphasized that compared to 2022, a restrictive +0.75% real interest rate and a 4.4% unemployment rate now limit the dollar's upside potential. From the weekly chart's technical indicators, the MACD is below the zero line, indicating bearish dominance, and any rebound is seen as a correction. The RSI is hovering around the midpoint of 60.23, suggesting continued downside risk. The daily chart shows a potential double top pattern, with the neckline around 99.10, which has been broken and confirmed by a pullback, indicating a short-term bearish bias. Therefore, the priority is to watch for a pullback to support before any upward move. If it breaks below 98.66 (the Bollinger Band midline on the weekly chart), it may test the 98.23 (14-week simple moving average) – 98.00 (a psychological level) area. On the other hand, once the US dollar index stabilizes above 100.50, it may attempt to test 100.95 (the May 2025 high) and the psychological level of 101.
Today, consider shorting the US Dollar Index at 100.62, with a stop-loss at 100.90 and targets at 99.90 and 99.80.
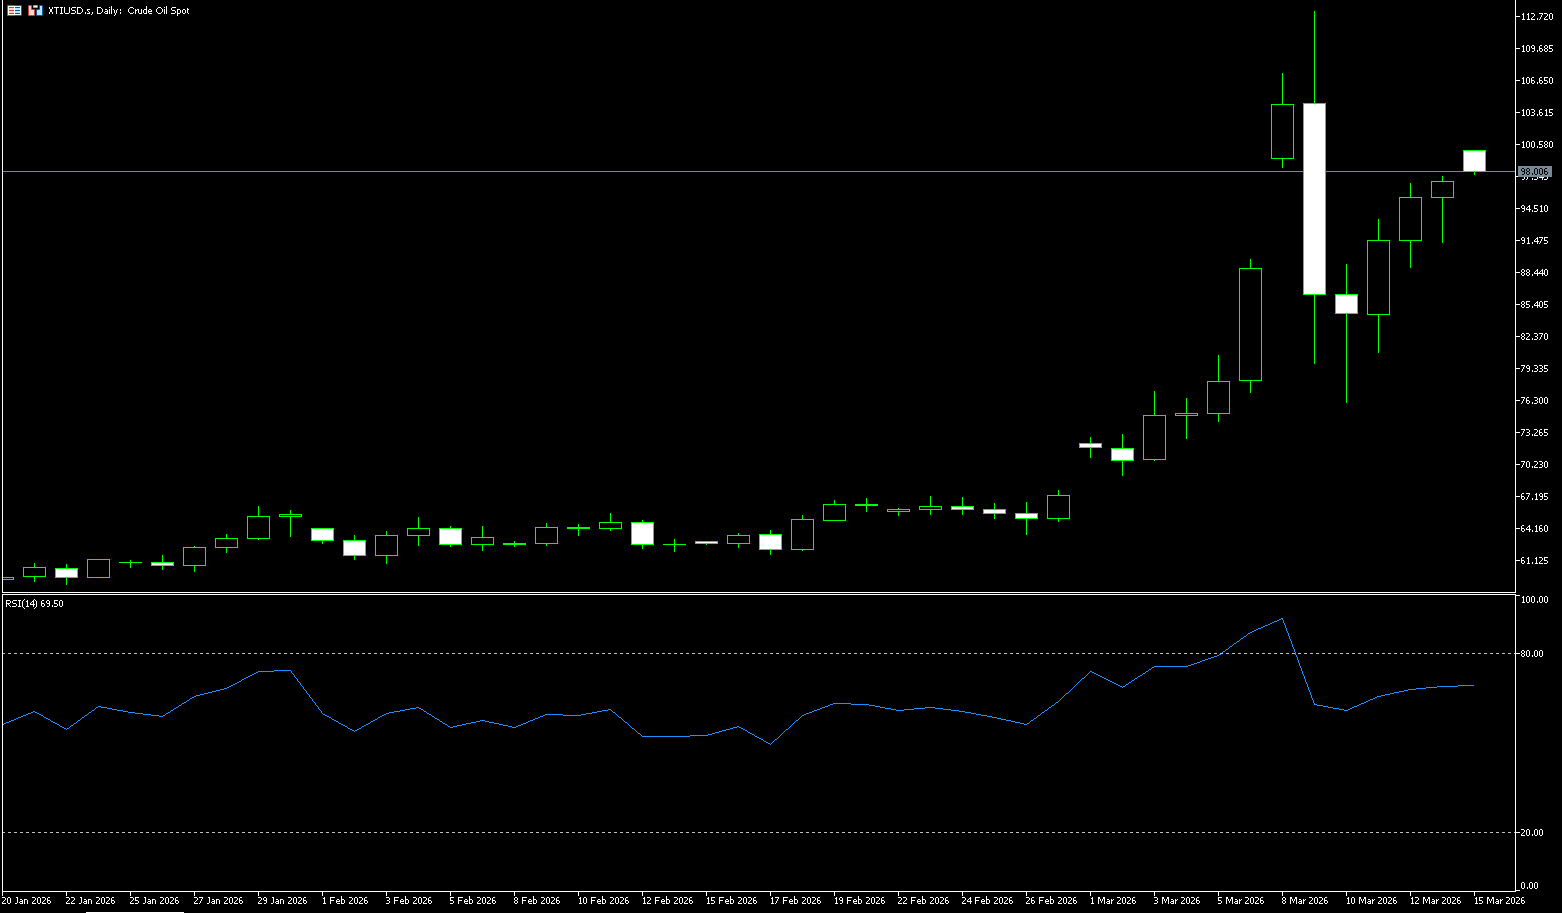
WTI Crude Oil
WTI crude oil experienced an extreme surge to $113.28 last week before plummeting to $75.95, entering a wide-range consolidation pattern. The short-term trend has shifted from strong to weak, with intense battles between bulls and bears, primarily focused on the $80-$113 range. Although Trump stated that "the war is over" to lower oil prices, this simultaneously escalated the threat to Iran, and the US military's tough stance pushed oil prices back above $90/barrel. The Trump administration's rapidly changing statements regarding the Iran war have made it difficult for investors to interpret. US Energy Secretary Wright mistakenly posted on social media that the US Navy escorted an oil tanker through the Strait of Hormuz, causing oil prices to plummet by nearly 20%, but he soon deleted the post. The White House press secretary subsequently admitted that no such action had been taken. This event highlights the confusion and disjointedness of information in Washington as the conflict enters its 11th day. Meanwhile, news that the International Energy Agency might discuss releasing a record-large strategic petroleum reserve put short-term pressure on international oil prices, with WTI crude falling back to around $80 per barrel. However, the escalating situation in the Middle East, shipping risks in the Strait of Hormuz, and the combined production cuts of over 6 million barrels per day by major oil-producing countries have kept global oil supply concerns strong. The market is repeatedly oscillating between policy intervention and geopolitical conflict, leading to significantly increased short-term price volatility, but overall risk premiums remain high. Until supply risks are resolved, risk premiums in the crude oil market will remain high, and the probability of WTI oil prices fluctuating above $90 remains high.
Last week, the international crude oil market was in a phase of oscillation between policy intervention and geopolitical risks. On the one hand, the International Energy Agency may release the largest strategic petroleum reserve in history, providing additional supply to the market and thus exerting temporary downward pressure on oil prices. On the other hand, the escalating conflict in the Middle East, shipping risks in the Strait of Hormuz, and large-scale production cuts by major oil-producing countries mean that the global energy supply outlook remains highly uncertain. Before supply risks are resolved, the risk premium in the crude oil market will remain high, and the probability of WTI oil prices fluctuating above $90 remains relatively high. WTI spot crude oil is currently in a complex pattern driven by geopolitics, technical correction, and overbought conditions, characterized by wide-range fluctuations at high levels, news-driven factors, and a technically strong but downward-pressured market. The MACD indicator shows a shortening of the green bars below the zero line, indicating weakening downward momentum and a potential golden cross; while the RSI is around 83.65, entering overbought territory, suggesting a short-term pullback to digest profit-taking. Next week, a wide-range fluctuation between $90.00 (the psychological level) and $109.53 (the July 2002 high) is expected. Once it breaks through and holds above $90, the next target is $100 (a psychological level), followed by a challenge of $109.53 (the July 2002 high). If it breaks below $90.00, it will first test the strong support at $80. A break below that level would then challenge the $75.95 level (last week's low).
Today, consider going long on spot crude oil at 97.10, with a stop-loss at 96.80 and targets at 103.00 and 106.00.
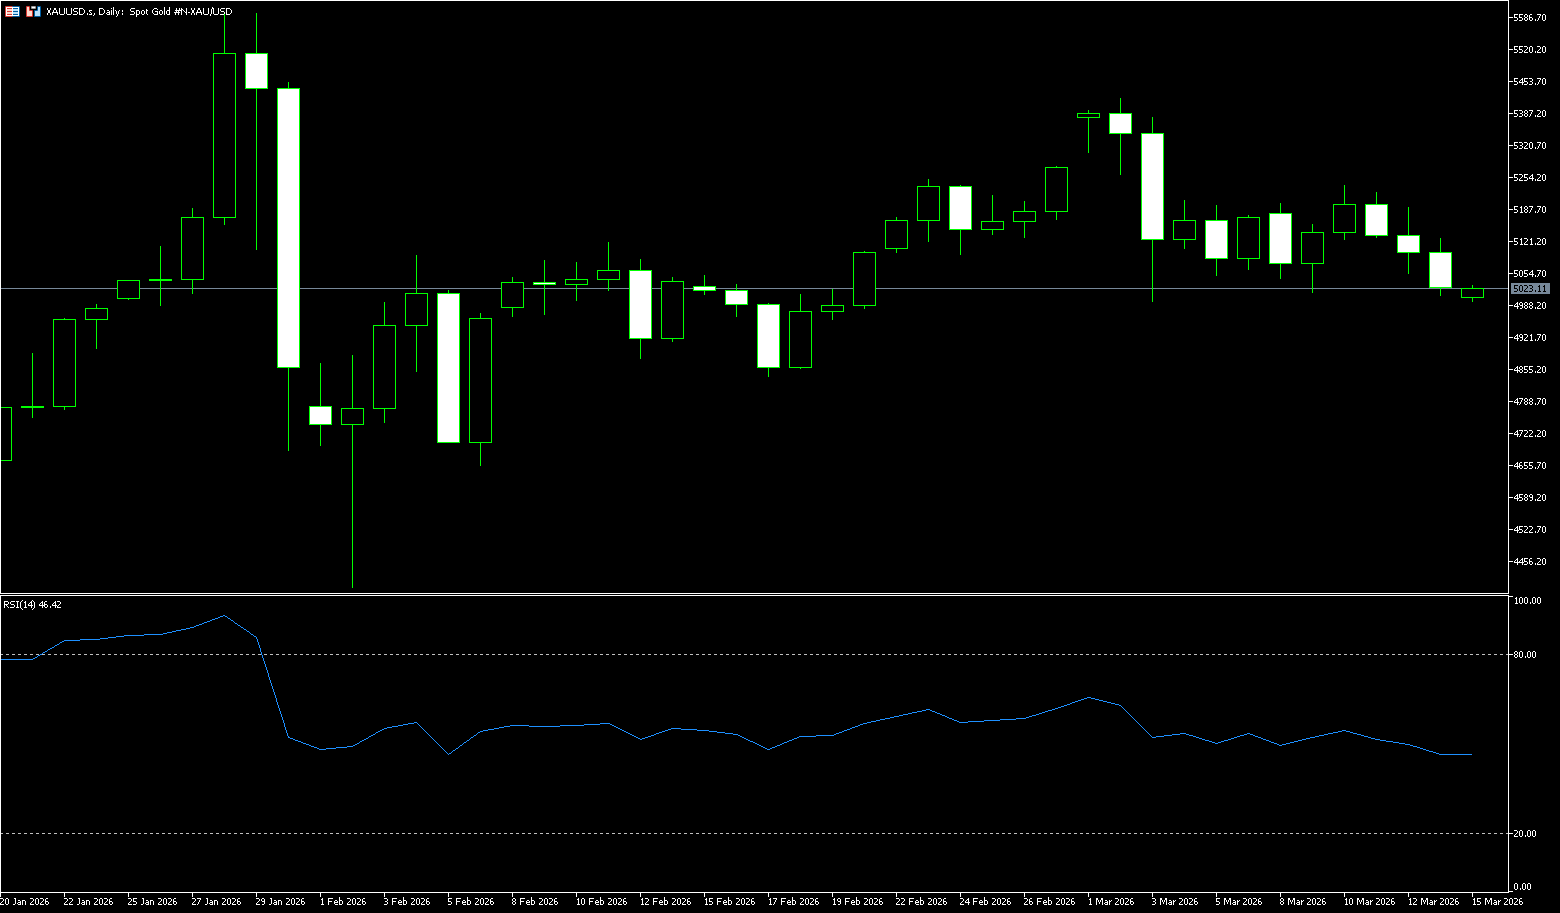
Spot Gold
Last week, gold prices fell due to profit-taking by short-term futures traders, while a stronger US dollar also contributed to the downward pressure on metal prices. Currently, spot gold prices have fallen back to around $5,000 per ounce. Given strong cash demand, it's not uncommon for gold prices to face downward pressure for several weeks. The market maintains an optimistic view on the long-term trend of gold and expects it to continue its upward trend after short-term profit-taking. The gold market appears to be caught in a tug-of-war between safe-haven demand triggered by war and concerns about persistently high interest rates. The market is currently highly focused on the Federal Reserve's March policy meeting (expected to maintain interest rates) and US energy inventory data, compounded by the possibility that any unexpected developments in the Middle East situation could trigger significant volatility. In the long term, continued central bank gold purchases (estimated to exceed 800 tons annually in 2025-2026) and expectations of further accelerating inflation remain solid supports for a structural bull market in gold. At the same time, geopolitical risk premiums have significantly raised the floor for gold. If the Strait of Hormuz crisis lasts for more than 30 days, gold may retest the $5,400-$5,600 high range; conversely, if tensions ease in the short term, the short-term pullback target is the psychological level of $5,000.
Last week, the technical picture for spot gold showed a pattern of bottoming out and rebounding, consolidation, and awaiting a breakout. The short-term bias is slightly bullish, while the medium-term bullish trend remains unchanged. This week's low was $5,009 (March 9th) and the high was $5,239 (March 11th), currently around $5,100. Judging from the recent weekly trend, the weekly chart's bullish alignment remains intact, while the daily chart is in a corrective phase after a pullback. In terms of chart pattern, the daily chart shows a consolidation structure of a sharp drop from a high level → panic selling → a bullish engulfing pattern → stabilization and rebound, with the long lower shadow on March 9th confirming the effectiveness of the $5,000 support level. Observing the technical indicators, the medium-term bullish trend remains unchanged, with short-term consolidation. The MACD has formed a death cross, but the green bars are continuously shortening, indicating weakening bearish momentum. The KDJ/RSI have rebounded from oversold to neutral, currently in a corrective phase. After the previous fluctuations, gold prices have remained above the key support area, and the overall bullish trend has not changed. Short-term moving averages are in a bullish alignment, indicating that prices still have some upward momentum. The upside resistance level to watch is the $5,239/ounce area (March 11th). A break above this level could lead to a further test of the $5,411 level (the upper Bollinger Band on the weekly chart). Downside support levels to watch are the $4,993 level (the 9-week simple moving average) and the $5,000 level (a psychological level). A break below this level could lead to a short-term pullback to the $4,944 level (the 10-week simple moving average).
Consider going long on spot gold today at $5,015, with a stop-loss at $5,010 and targets at $5,080 and $5,100.
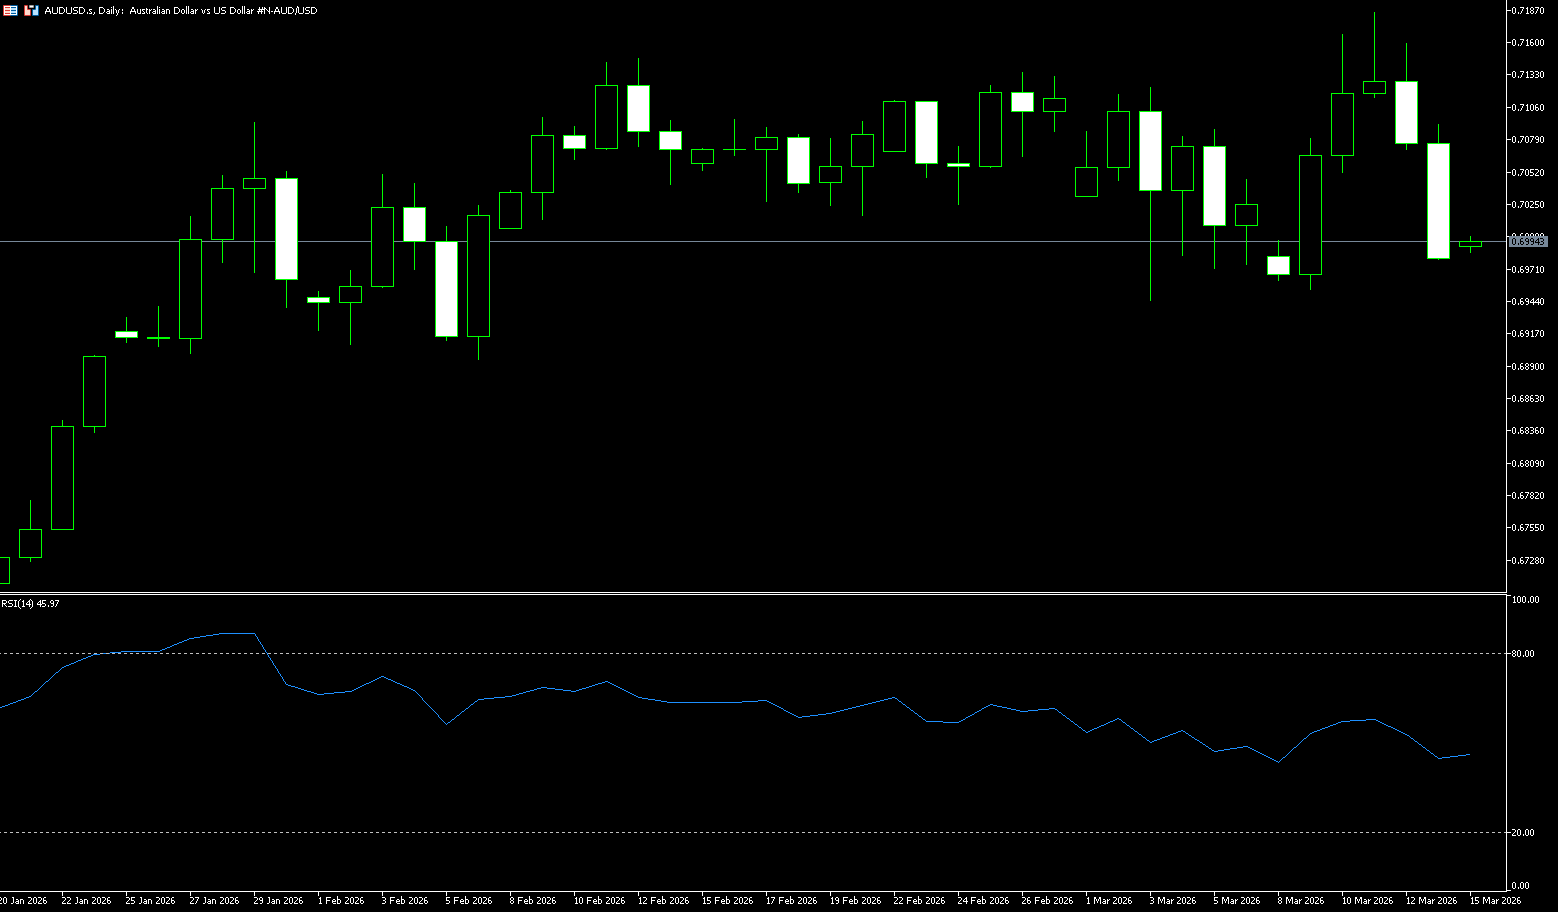
AUD/USD
The Australian dollar appreciated to around US$0.7185, reaching its highest level since May 2022, driven by rising expectations of an interest rate hike next week. The Reserve Bank's deputy governor stated that rising oil prices could push up inflation, increasing pressure to raise interest rates at the March 17th meeting, which the central bank has described as an "active" rate hike meeting. Markets quickly raised the probability of a March rate hike to around 75%, with many analysts expecting the Reserve Bank of Australia (RBA) to raise rates next week, following a senior official's inflation warning. RBA Deputy Governor Andrew Hauser said on Tuesday that rising oil prices would push inflation above the projected 4.2%, and warned that the Middle East conflict could force a rate hike within days. Hauser added that the response depends on the size and duration of the price shock, which is highly uncertain. Earlier this week, the probability was below 30%, and another rate hike was expected to be fully priced in by August. Overall, traders expect a tightening of around 60 basis points this year, potentially pushing the cash rate above the peak reached when inflation exceeded 7% post-pandemic. Currently, headline inflation is at 3.8%, expected to exceed 4% as petrol prices continue to rise, while core inflation remains high at 3.4%, well above the RBA's target range of 2-3%. Elsewhere, markets remain tense due to conflicting reports on the Middle East conflict and increasing uncertainty.
The Australian dollar against the US dollar showed a bullish trend last week, with a slightly bullish bias and a new high since June 2022 (0.7185). In the short term, it has been supported by key support levels, but faces strong resistance above. This week, it is likely to fluctuate within the range of 0.6956 (last week's low) – 0.7283 (May 2022 high). A break above 0.7200 would open up further upside potential. The Australian dollar has continued its seven-day winning streak against the US dollar, firmly establishing itself above all weekly moving averages, clearly indicating a bullish trend. The short-term trend remains bullish with a slightly bullish bias, and the weekly uptrend remains intact. The 14-week RSI is near the leading 65, indicating a neutral to bullish bias and further upside potential. The MACD has formed a golden cross above the zero line, with the red bars expanding, indicating strengthening bullish momentum. If expectations of a Reserve Bank of Australia (RBA) rate hike intensify, and the currency pair holds above 0.7056 (last week's low) and 0.7000 (a psychological level), and breaks above 0.7185 (Wednesday's high) and the 0.7200 (psychological level) area, it will likely test 0.7283 (the May 2022 high) and the 0.7300 (psychological level) area. On the downside, first watch the 0.6956 (last week's low) level; a break below this level would target the 0.6900 (psychological level) area.
Today, consider going long on the Australian dollar at 0.6970, with a stop-loss at 0.6960 and targets at 0.7050 and 0.7060.
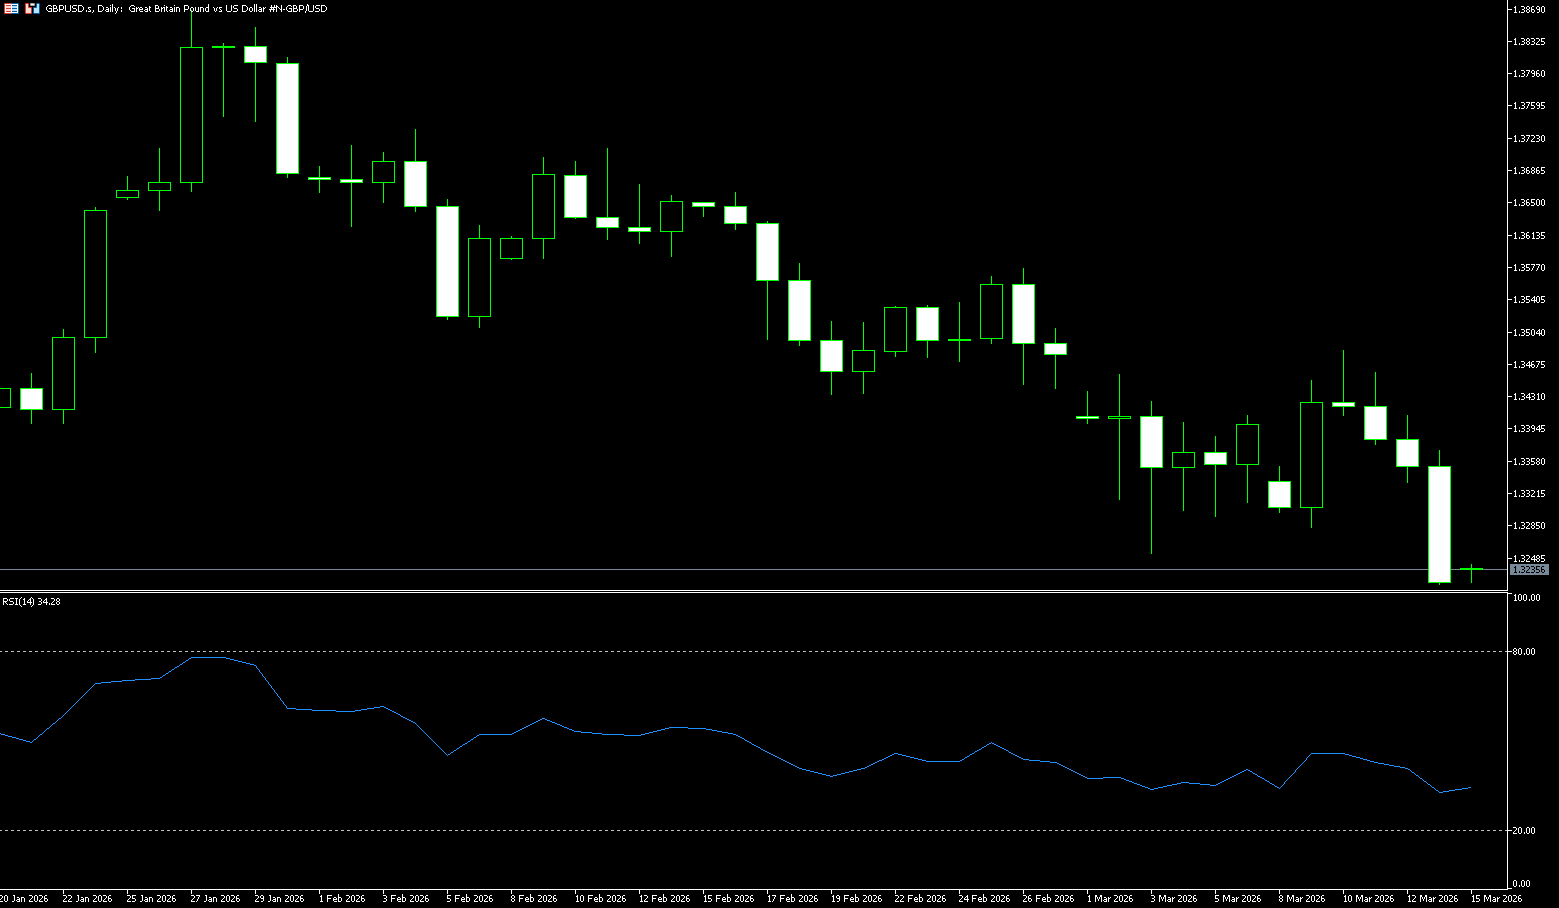
GBP/USD
Last week, the pound fell to a December low of $1.3218, after which investors weighed the potential economic impact of the escalating Middle East conflict, rising inflationary pressures, and the possibility of a more hawkish stance from the Bank of England. The pound rebounded slightly last week, moving away from the low of $1.3200, as investors shifted from the dollar to other currencies, hoping the conflict's impact on inflation would be smaller than previously expected. Market sentiment improved as oil prices fell after US President Trump tried to reassure investors. Trump indicated the conflict could end quickly and announced the US Navy would escort oil tankers through the Strait of Hormuz to secure shipping routes. Oil prices fell nearly 6%, and European gas prices also declined. Meanwhile, expectations for Bank of England policy shifted, with traders again favoring the prospect of interest rate cuts. The market currently anticipates a roughly 50% probability of an interest rate cut by September, a stark contrast to the previous round of virtually no policy changes and a brief pricing in of a rate hike earlier in the day. On the other hand, investor confidence improved after US President Donald Trump indicated the conflict could end quickly and announced that the US Navy would escort oil tankers through the Strait of Hormuz to protect key shipping routes.
The pound against the dollar traded with a generally weak bias last week, within a core range of 1.3218 (last week's low) – 1.3483 (14-week moving average). While bulls held a short-term advantage, upward momentum was limited. After bottoming out at 1.3283 in the first half of the week, it rebounded strongly, closing higher for several consecutive days and returning to around 1.32, completing a short-term oversold correction. In terms of technical indicators: The currency pair has stabilized above the psychological level of 1.3200, but remains below the 14-week moving average of 1.3490, indicating a short-term bullish bias but a medium-term bearish bias, suggesting a bottoming-out correction. The RSI (14) has rebounded from oversold levels to the 40-45 range, indicating weakening buying pressure and a recovery in short positions, but it hasn't broken above 50, limiting upward momentum. Finally, the MACD is in a golden cross near the zero line, suggesting short-term bullish dominance. Since the GBP/USD pair touched a low of 1.3218, triggering short covering and buying activity, resulting in a technical oversold rebound, the upside targets are the 20-week moving average of 1.3391 and the psychological level of 1.3300. A break above these levels would target 1.3575 (the high of February 26th). On the other hand, the Fed's policy of "higher interest rates for longer" still provides medium-term support for the US dollar. Therefore, the key support levels to watch are 1.3218 (last week's low) and 1.3200 (a psychological level). A break above these levels would target 1.3100 (the psychological level).
Today, consider going long on GBP at 1.3210, with a stop-loss at 1.3200 and targets at 1.3270 and 1.3280.
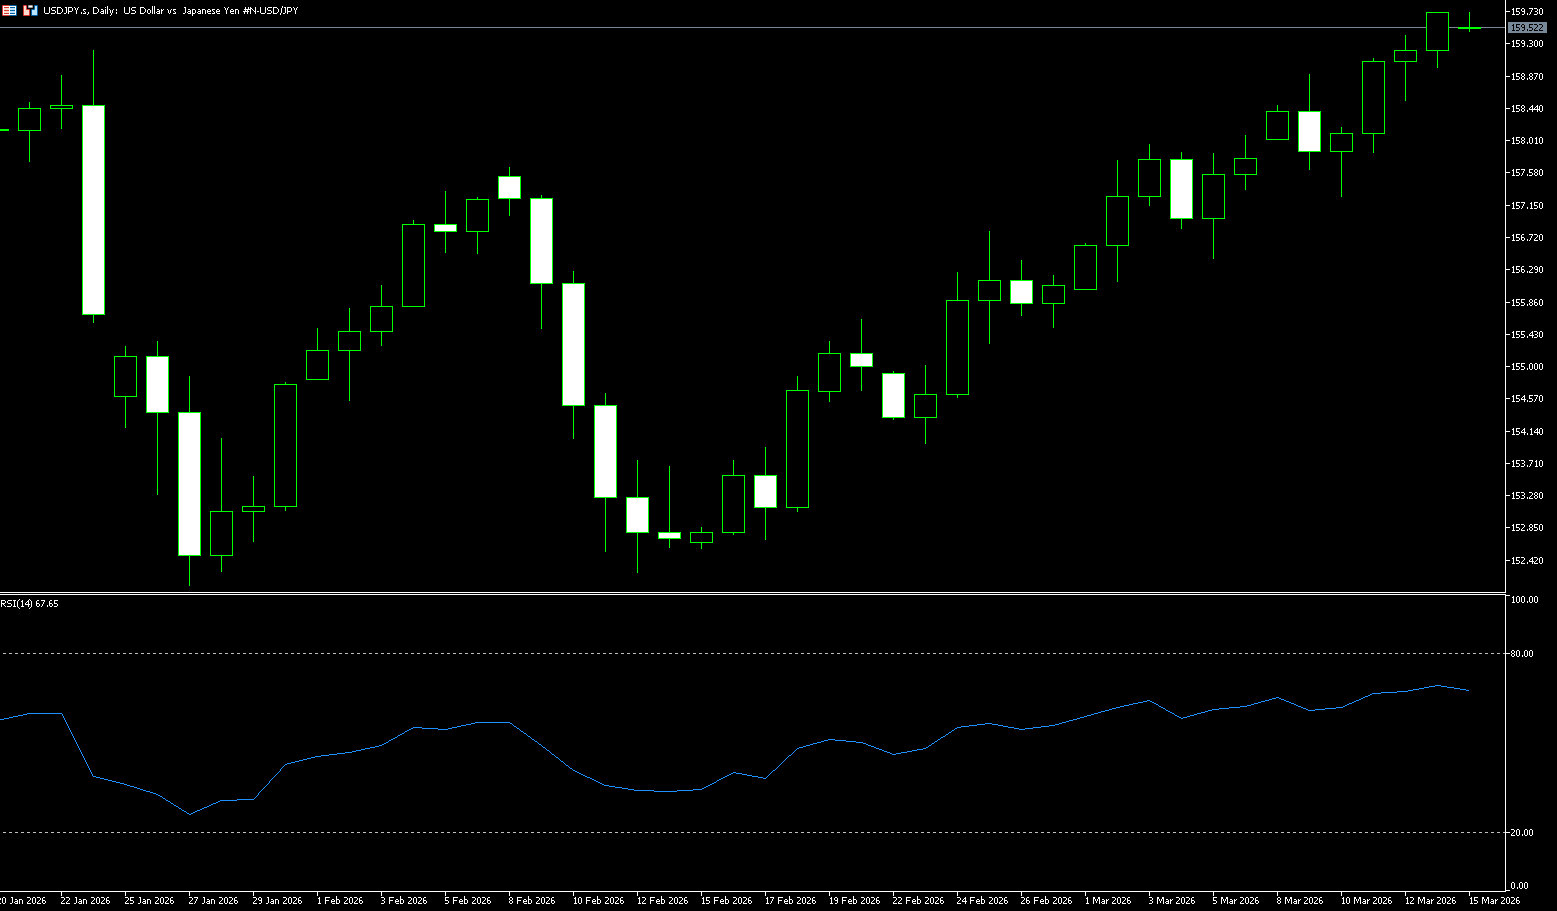
USD/JPY
Last week, the USD/JPY pair hovered around 159.70, its highest level since January 12th. After a pullback from the previous high of 159.45, the pair quickly found trendline support and rebounded. The current market context is clear: escalating uncertainty surrounding the Middle East conflict continues to support the US dollar. The Trump administration has sent mixed signals regarding the war with Iran, with President Trump suggesting the conflict could end soon, while senior officials indicated military action was escalating and diplomatic negotiations remained unlikely. The Iranian Revolutionary Guard refuted Trump's claims, warning that the blockade would continue until attacks by the US and Israel ceased. Meanwhile, oil prices fell further after the International Energy Agency (IEA) proposed the largest release of oil reserves in history to help stabilize the market. Japan, heavily reliant on energy imports, is highly vulnerable to oil price shocks, but the country is prepared to use emergency reserves to offset supply risks. At the same time, data showed that Japanese producer prices rose 2% in February, the most modest increase in nearly two years. On the other hand, Japanese Prime Minister Sanae Takaichi may urge the Bank of Japan to proceed cautiously with interest rate hikes, following reports that she expressed concerns about further tightening during her meeting with BOJ Governor Kazuo Ueda last month. Governor Ueda stated last week that interest rates might remain unchanged for an extended period due to the potential impact of the Middle East conflict on the economy. The market widely expects the BOJ to maintain its policy rate at next week's meeting.
The USD/JPY pair exhibited a generally strong, high-level consolidation pattern last week. While the bullish structure remains intact, it is approaching the potential intervention range set by the Japanese authorities. The pair is likely to trade within a range, with opportunities for upward movement, but caution is advised regarding potential intervention and pullbacks. Current price action suggests a continuation of the dollar's bullish trend, with prices trading above all moving averages and volatility increasing. Key recent characteristics include high-level consolidation, slow upward testing of resistance, and approaching the 160 intervention line. Technically, the 14-week RSI is at 63, not yet overbought but without a bearish divergence, indicating continued bullish momentum. As for the MACD, the golden cross continues, with the red bars slightly expanding, reflecting a trend consistent with momentum. In terms of price pattern, it forms a high-level converging triangle, with upper resistance at 158.90-159.00 and lower resistance at 157.80-157.70. A breakout is highly likely this week to determine the direction. If the pair breaks upwards, the first target is 160.00 (a psychological level); a break above that level would target 160.50 and the 161.30 area (the June 2024 high). On the downside, 157.27 (last week's low) is the first support level, followed by 156.56 (the 14-week simple moving average); a break below that would target 156.04 (the 5-week simple moving average) and the 156.00 level (a psychological level).
Today, consider shorting the US dollar at 159.85, with a stop loss at 160.00 and targets at 158.50 and 158.40.
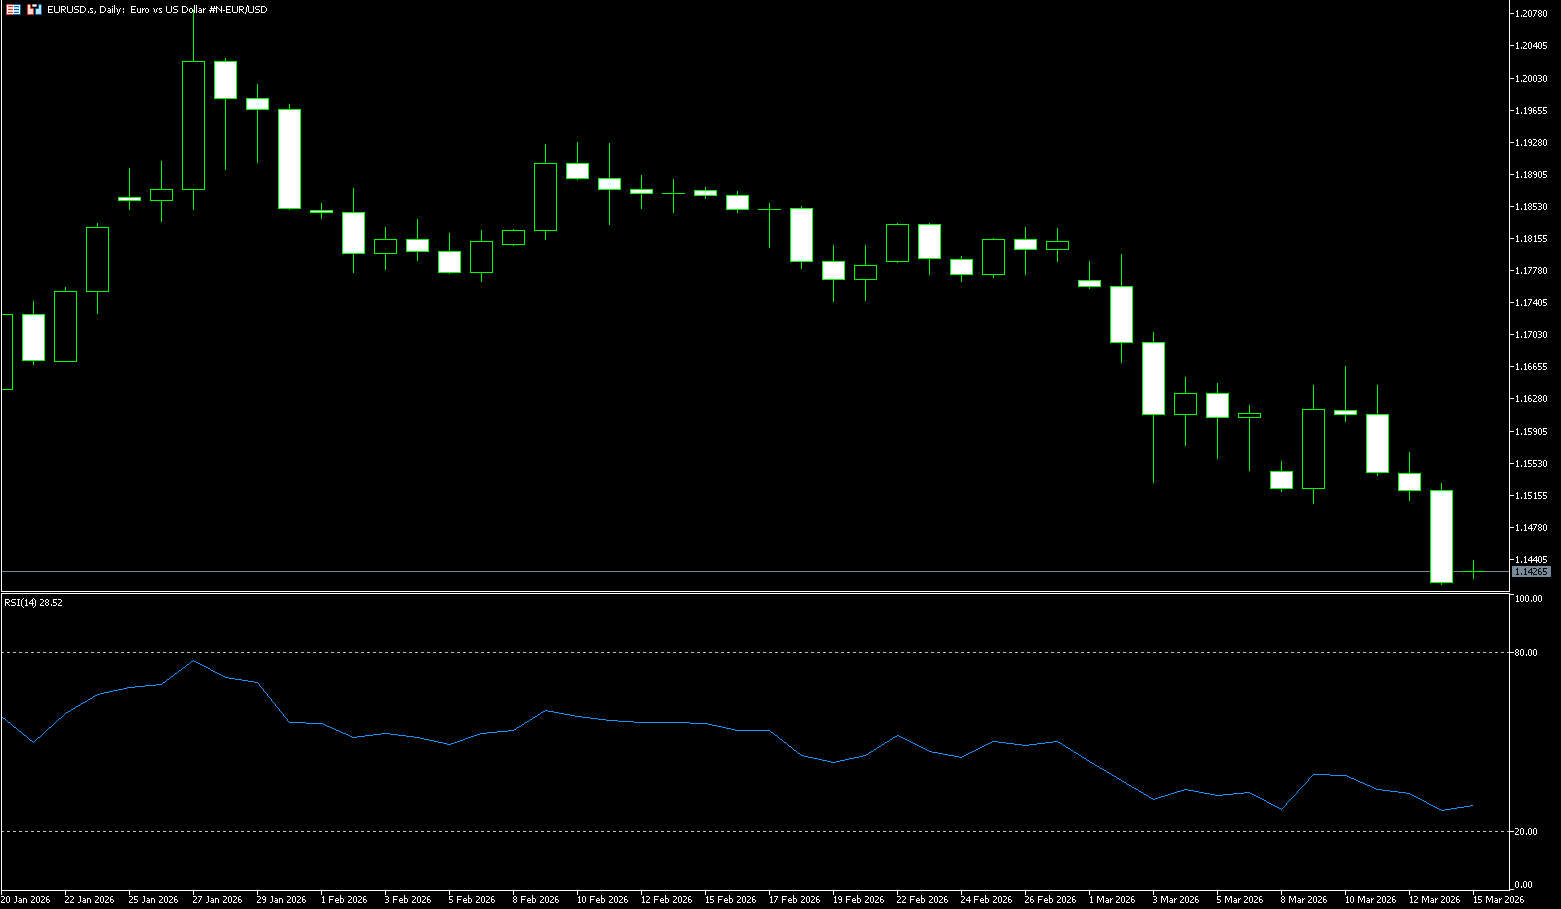
EUR/USD
Last week, the euro traded slightly above $1.1400, hovering near an eight-month low, as investors continued to assess developments related to the conflict with Iran, the surge in energy prices, and their impact on inflation and ECB policy. The market received some temporary relief after US President Trump indicated that the military action against Iran could end soon and was progressing well, exceeding the initially expected four to five weeks. Oil prices also fell back below $100 per barrel after Trump hinted at several measures to control energy costs. Earlier this month, ECB Chief Economist Philip Lane warned that prolonged conflict in the Middle East and a continued decline in regional oil and gas supplies could trigger a “significant surge” in inflation and a “sharp decline” in the eurozone. Against this backdrop, the market now expects the ECB to raise its key interest rate by at least 25 basis points once this year. Meanwhile, hawkish comments from European Central Bank officials, including President Lagarde and Peter Kazimir, have strengthened market pricing in a rate hike within six months, although this is still considered a low-probability scenario. The euro/dollar is now primarily driven by oil, with International Energy Agency (IEA) reserve releases providing temporary support around 1.160.
The euro/dollar pair exhibited a slightly bearish technical pattern last week, with resistance above and support below. The core short-term trading range is 1.1500 (the psychological level) – 1.1257 (the 75-week moving average). The direction of the breakout will determine the week's trend. The early-week low of 1.1507-1.1500 has become a strong short-term resistance area. The MACD indicator is above the zero line, with a golden cross of DIFF/DEA and a slight expansion of the red bars, indicating moderate bullish momentum; while the RSI (14) is around 40.00, suggesting further upside potential. A "W" bottom pattern is forming this week, with the neckline at 1.1680-1.1700. A break above this level would confirm a short-term rebound. If the EUR/USD pair holds above 1.1507-1.150 this week, its target will be 1.1600 (the psychological level). Conversely, if the pair breaks below 1.1400 and closes below it, the target will be 1.1300 (the psychological level), and a break below that would lead to 1.1257 (the 75-week moving average).
Today, consider going long on the EUR/USD at 1.1410, with a stop-loss at 1.1400 and targets at 1.1460 and 1.1470.
Disclaimer: The information contained herein (1) is proprietary to BCR and/or its content providers; (2) may not be copied or distributed; (3) is not warranted to be accurate, complete or timely; and, (4) does not constitute advice or a recommendation by BCR or its content providers in respect of the investment in financial instruments. Neither BCR or its content providers are responsible for any damages or losses arising from any use of this information. Past performance is no guarantee of future results.
Lebih Liputan


Pendedahan Risiko:Instrumen derivatif diniagakan di luar bursa dengan margin, yang bermakna ia membawa tahap risiko yang tinggi dan terdapat kemungkinan anda boleh kehilangan seluruh pelaburan anda. Produk-produk ini tidak sesuai untuk semua pelabur. Pastikan anda memahami sepenuhnya risiko dan pertimbangkan dengan teliti keadaan kewangan dan pengalaman dagangan anda sebelum berdagang. Cari nasihat kewangan bebas jika perlu sebelum membuka akaun dengan BCR.
BCR Co Pty Ltd (No. Syarikat 1975046) ialah syarikat yang diperbadankan di bawah undang-undang British Virgin Islands, dengan pejabat berdaftar di Trident Chambers, Wickham’s Cay 1, Road Town, Tortola, British Virgin Islands, dan dilesenkan serta dikawal selia oleh Suruhanjaya Perkhidmatan Kewangan British Virgin Islands di bawah Lesen No. SIBA/L/19/1122.
Open Bridge Limited (No. Syarikat 16701394) ialah syarikat yang diperbadankan di bawah Akta Syarikat 2006 dan berdaftar di England dan Wales, dengan alamat berdaftar di Kemp House, 160 City Road, London, City Road, London, England, EC1V 2NX. Entiti ini bertindak semata-mata sebagai pemproses pembayaran dan tidak menyediakan sebarang perkhidmatan perdagangan atau pelaburan.

 English
 简体中文
简体中文
 繁體中文
繁體中文
 Bahasa
Melayu
Bahasa
Melayu
 Tiếng
Việt
Tiếng
Việt
 ไทย
ไทย
 日本語
日本語
 한국어
한국어
 ភាសាខ្មែរ
 español
