


0
US Dollar Index
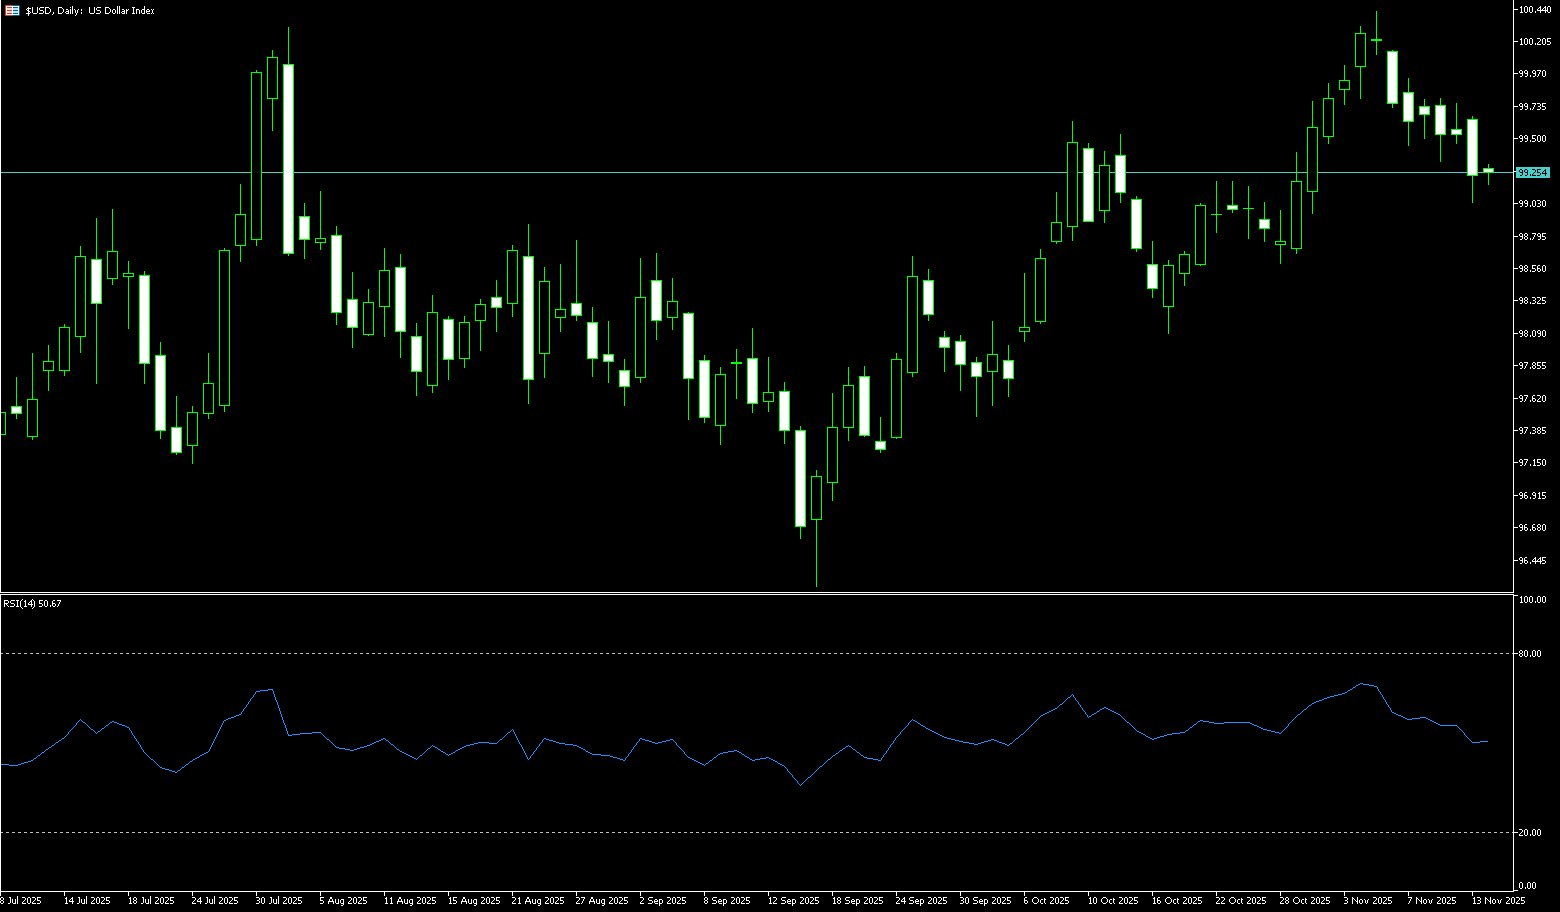
The US dollar index remained above 100 on Monday, near a six-month high, as investors continued to assess the Federal Reserve's monetary policy outlook. In the currency market, the dollar has recently oscillated between "risk aversion" and "interest rate cut expectations." On the one hand, the reopening of the government and hawkish rhetoric themselves have not significantly boosted the dollar; on the other hand, this round of risk asset adjustments has provided new support for the dollar. Given that the risks from a weak labor market outweigh rising inflation, a near-term interest rate cut remains possible. However, policymakers remain divided on the future path, with Boston Fed President Susan Collins stating that she has not yet made a decision on possible measures. The dollar rose against the euro and pound as European fiscal tensions came into focus, while the yen gave back some of Friday's gains after Japanese authorities issued new verbal intervention orders.
Supported by cross-currency trading, safe-haven buying, and a firm hold above the 20-day simple moving average support at 99.61, the short-term outlook for the US dollar remains optimistic. Technical indicators on the daily chart are upward, with the 14-day Relative Strength Index (RSI) near 64.00, indicating a strengthening bullish momentum. The MACD indicator also shows increased bullish momentum. However, a decisive break above the 100.40 (last week's high) and 100.67 (100-day simple moving average) areas is necessary. A successful break above these resistance areas would target the May 12 high of 101.00 (a psychological level). On the downside, only a break below the 99.85 (200-day simple moving average) and 99.61 (20-day simple moving average) areas would neutralize the bullish trend.
Today, consider shorting the US Dollar Index around 100.28; Stop loss: 100.40; Target: 99.80; 99.70
WTI Crude Oil
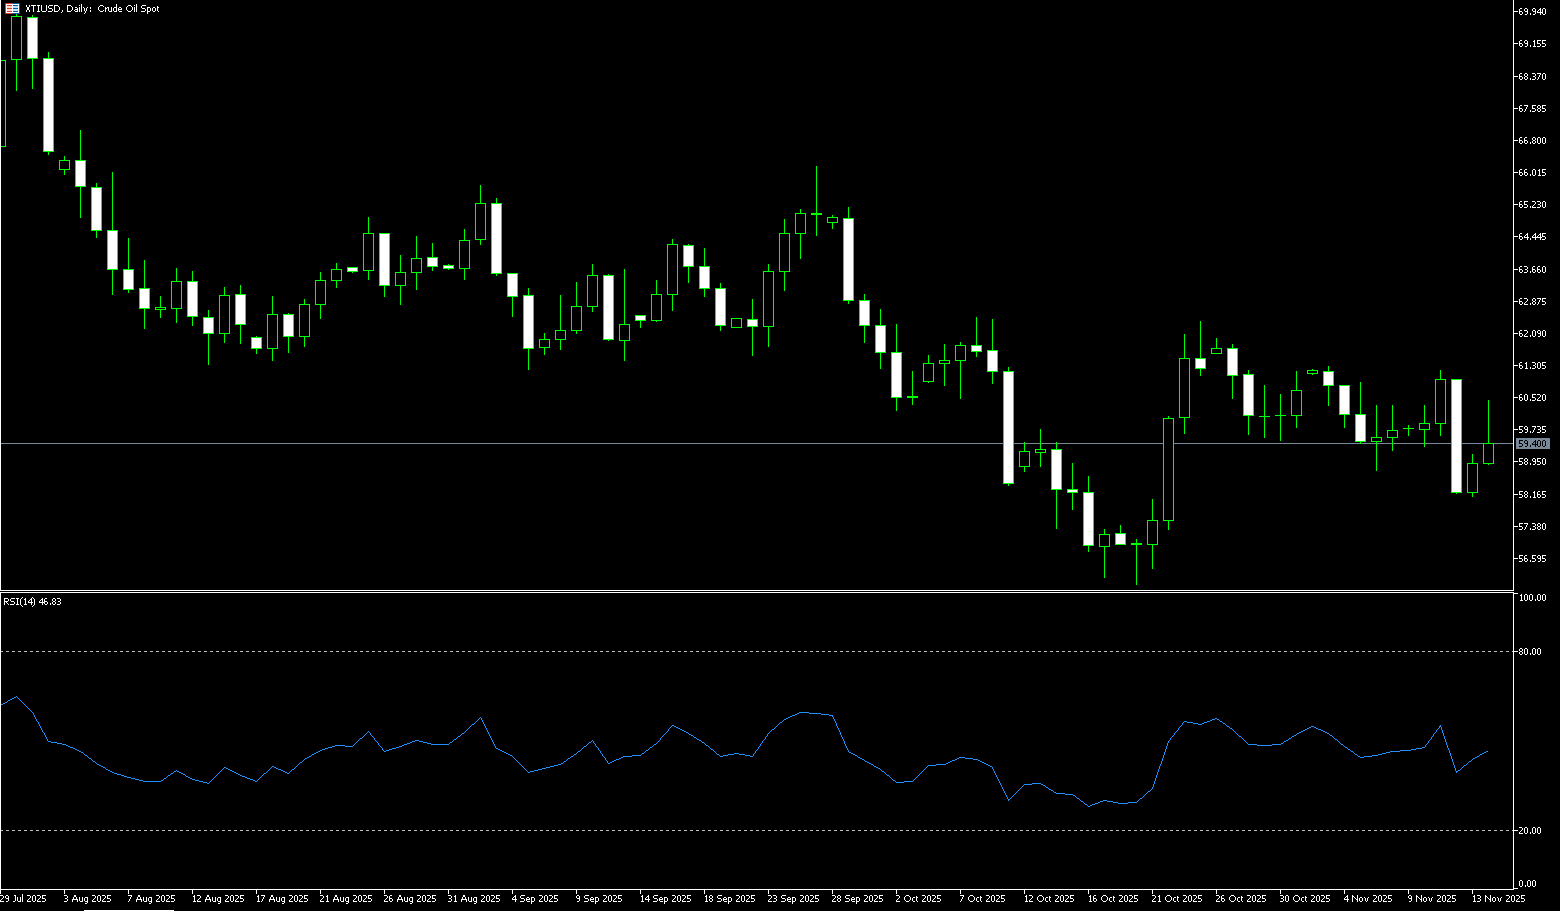
WTI crude oil rose to around $58.90 per barrel on Monday, after falling 3.4% last week, as the market assessed the possibility of a peace agreement between Russia and Ukraine. US-brokered negotiations have made some progress, although significant obstacles remain on territorial and sovereignty issues. President Trump hinted that "some good things" might happen, while President Zelensky called the negotiations a "critical moment." An agreement could lift sanctions on Russian oil, potentially allowing more barrels to re-enter a market already facing a significant surplus next year. Meanwhile, the likelihood of a US interest rate cut next month has increased due to speeches by Federal Reserve Chairman Waller today and the New York Federal Reserve Bank president last week. WTI has fallen more than 4% so far this month and is on track for its fourth consecutive monthly decline, its longest losing streak since 2023.
The daily chart shows that WTI crude oil prices fell to a near one-month low of $57.33 last week, a weekly drop of 3.16%. At the beginning of this week, oil prices fluctuated above the $58.00 mark. Looking at the weekly chart, WTI crude oil has now fallen for four consecutive trading weeks. Breaking down the daily movements, the bears clearly dominated. Except for a brief rise at the beginning of last week due to technical correction, the other four trading days all closed with bearish candles. Friday's decline was particularly crucial, breaking through the initial support area formed by the $58.02 (lower Bollinger Band) and $58.00 (psychological level) levels that had held for several weeks. This further strengthened the bearish momentum to the area around the October 22 low of $57.31 and last Friday's low of $57.33, establishing a short-term downtrend. The next key levels to watch are the $56.00 mark and the October low of $55.97. Regarding the rebound target, pay attention to the initial resistance area around the $59.00 level, with the next levels to watch being $59.80 (the Bollinger Band middle line) and the psychological level of $60.00.
Today, consider going long on crude oil around $58.70; stop loss: $58.55; target: $59.90; $60.20
Spot Gold
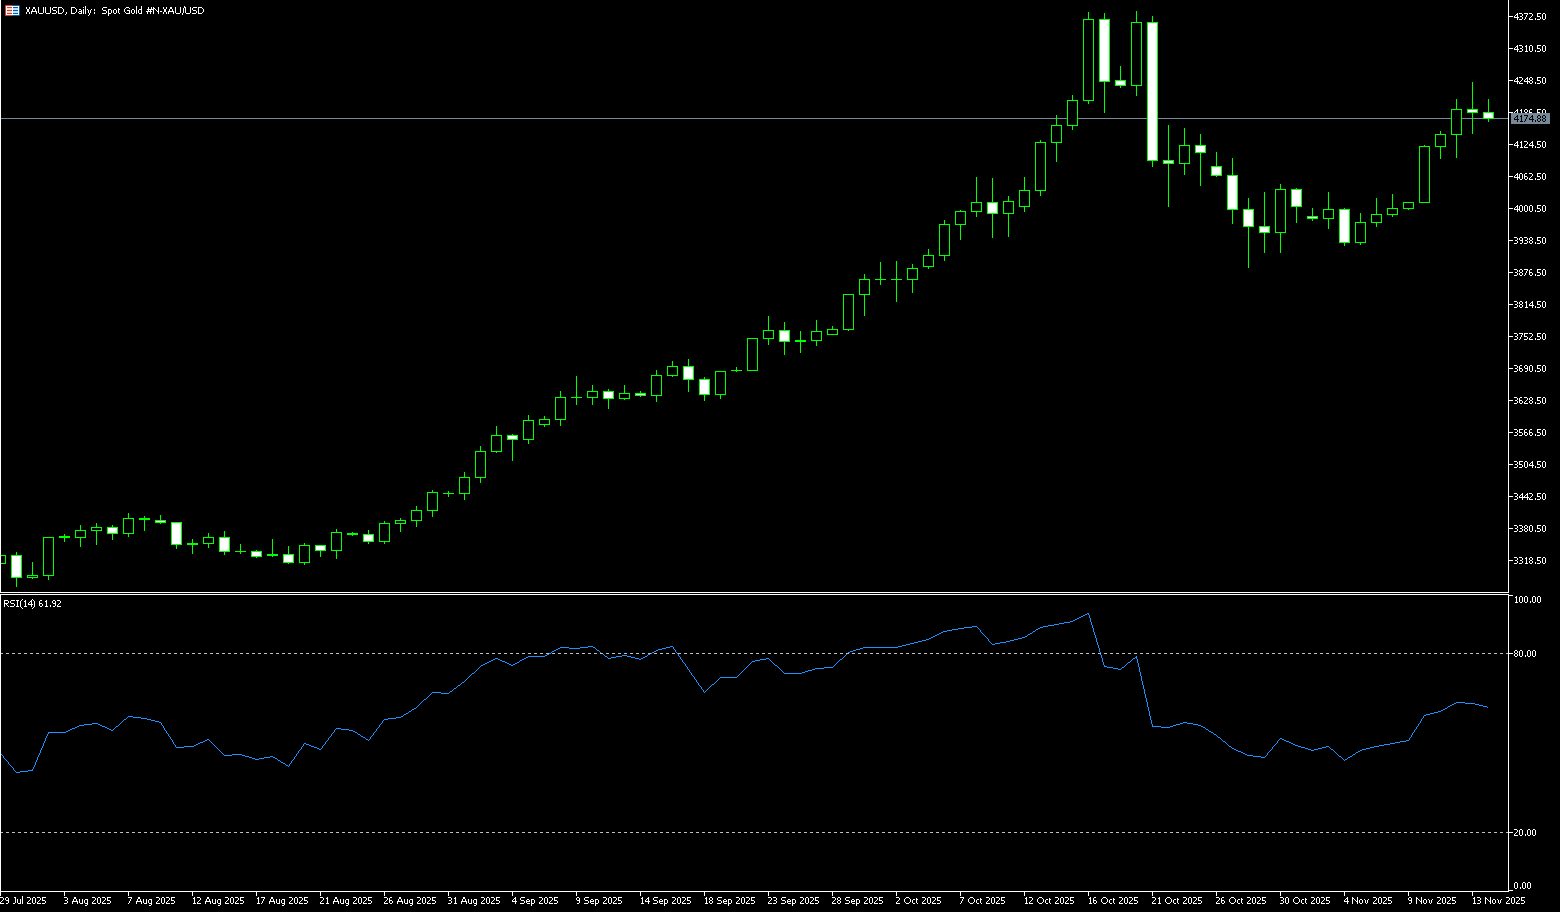
Gold prices traded around $4,120 per ounce in early European trading on Monday. Gold prices stabilized temporarily after a downward trend last Friday, supported by Fed Chair Williams' statement that the Fed could still cut interest rates "in the near term" without jeopardizing its inflation target. This statement fueled market expectations for a Fed rate cut. However, the Fed is not unanimously dovish. Dallas Fed President Logan maintained a hawkish stance, calling for interest rates to remain unchanged "for some time." The gold market is closely watching stock market performance. If the stock market continues to strengthen due to increased risk appetite, it could divert funds and put downward pressure on gold prices. Furthermore, physical gold demand remained weak last week due to volatile interest rate conditions, limiting potential price increases. With the US Thanksgiving holiday this week, market trading interest may weaken, and gold prices may continue to fluctuate; investors should pay attention.
Considering the data vacuum period, it's important to note that while analysis suggests short-term pressure on gold prices, it's crucial to remember that even if the Federal Reserve remains hawkish for most of 2025, gold has still managed to rise this year driven by other macroeconomic factors. On the downside, gold prices remain firmly supported by multiple moving averages, with $3,998 (last week's low) and the key psychological level of $4,000 (first breached earlier this year) providing strong defense. The next level to test is the support at $3,957.70 (55-day simple moving average) and $3,930 (November 4th low). On the upside, watch $4,132 (last week's high), with a break above targeting $4,200 (the psychological level).
Consider going long on gold today around $4,125; stop loss: $4,120; targets: $4,155; $4,165
AUD/USD
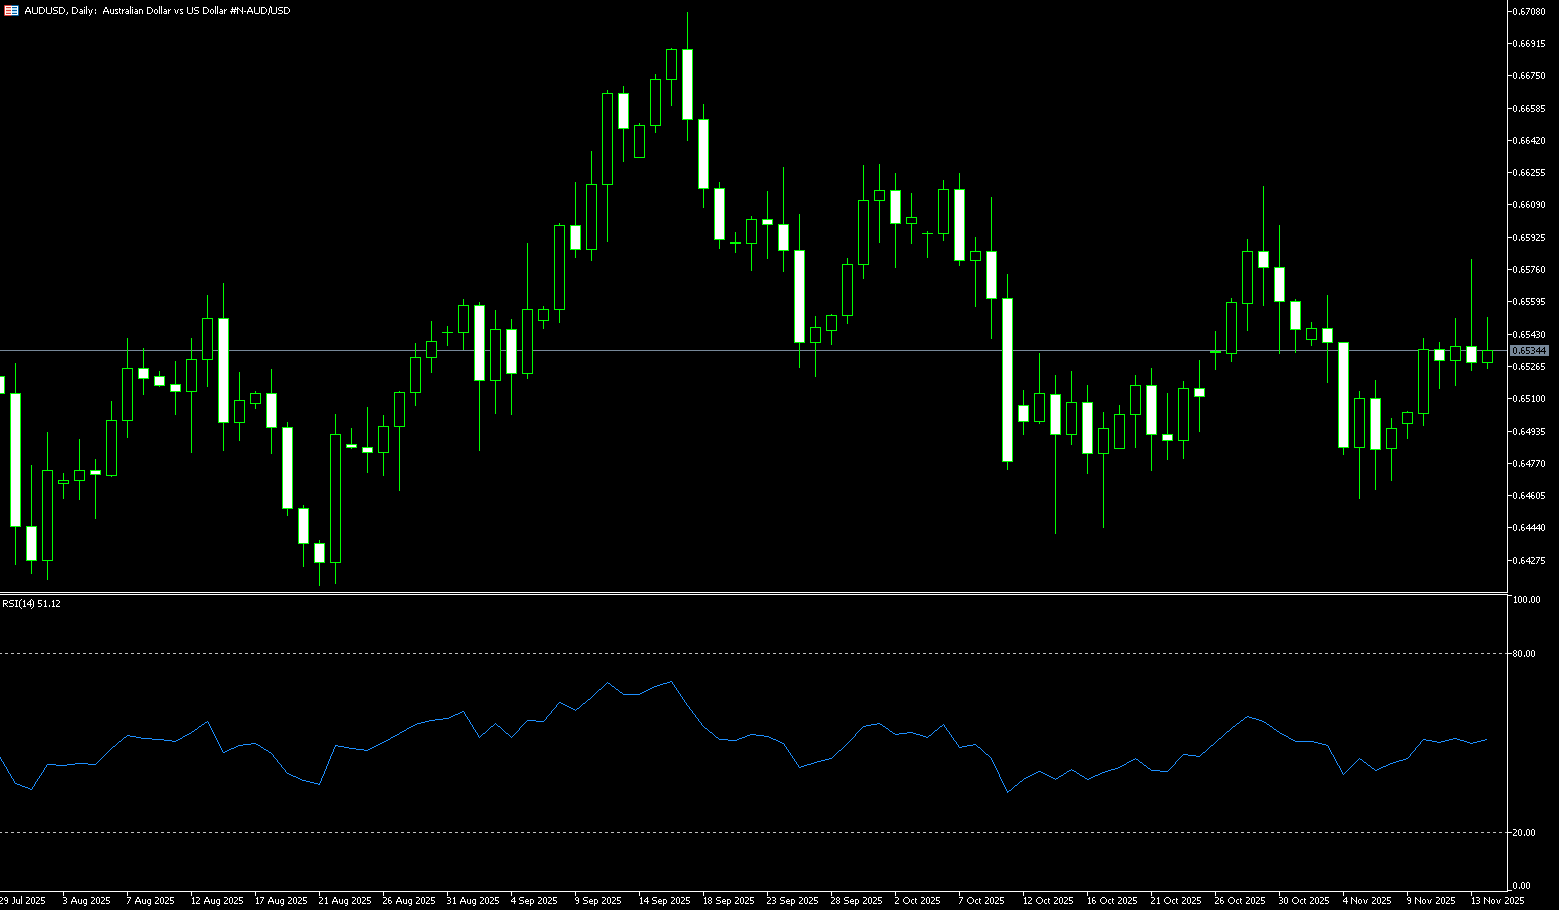
The Australian dollar remained firm against the US dollar on Monday due to key inflation data updates this week. Traders will likely focus on Wednesday's release of Australia's first "full" monthly consumer price index for October, for further indications of the Reserve Bank of Australia's (RBA) monetary policy stance. The AUD/USD pair found support as market expectations of a cautious RBA stance strengthened. The RBA's November meeting minutes indicated that the central bank is likely to keep interest rates unchanged for an extended period. ASX 30-day interbank cash rate futures showed that as of November 20, the December 2025 contract was trading at 96.41, implying a 6% probability of a rate cut to 3.35% (from 3.60%) at the upcoming RBA board meeting. Reserve Bank of Australia Assistant Governor Sarah Hunt noted on Thursday, "Sustained overtrend growth could exacerbate inflationary pressures." Hunt stated that monthly inflation data could fluctuate, and the central bank would not react to single-month data.
The Australian dollar/US dollar pair traded around 0.6460 on Monday. The daily chart shows the pair consolidating within a range of 0.6420 (last week's low) to 0.6545 (upper trendline of the descending channel), reflecting a consolidation phase. Meanwhile, the pair continues to remain below the psychological level of 0.6500, indicating weak short-term momentum. The 14-day Relative Strength Index (RSI) is near 40, reflecting a continued weak trend. The pair found immediate support near 0.6420 (last week's low), followed by the psychological low of 0.6400, and then 0.6372 (June 23 low). Key resistance lies at the 14-day simple moving average of 0.6499 and the psychological level of 0.6500. A break above this level would improve short-term price momentum and bring the pair closer to the 50-day simple moving average level of 0.6541.
Consider going long on the Australian dollar today near 0.6450; Stop loss: 0.6440; Target: 0.6490; 0.6500
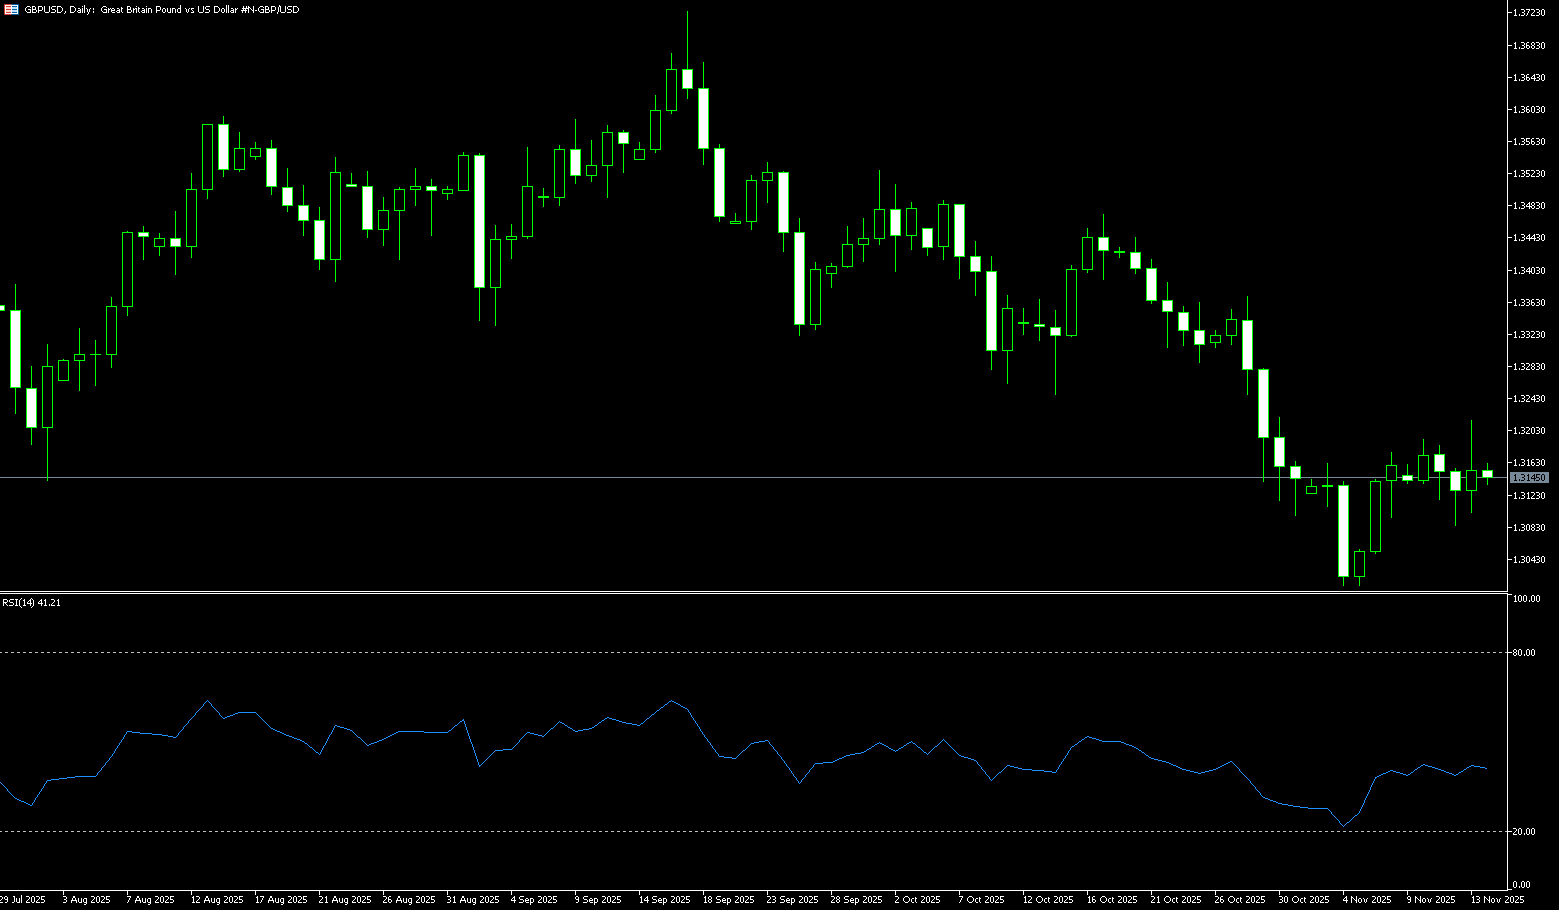
GBP/USD
The GBP/USD pair rebounded from a modest decline in the European session on Monday, fluctuating around 1.3100 as the dollar weakened slightly. However, uncertainty surrounding the upcoming UK budget and rising bets on a Bank of England rate cut next month are providing resistance to spot prices. The delayed release of the September US non-farm payrolls report further reduced market expectations for another Fed rate cut in December. This offset concerns about weakened economic momentum due to the longest government shutdown in US history, continuing to support the dollar and putting pressure on the GBP/USD pair. On the other hand, the pound continued to underperform amid upcoming UK budget uncertainty and bets on a Bank of England rate cut next month. This was seen as a key factor putting pressure on the GBP/USD pair. A relatively busy US economic schedule this week will influence short-term dollar price dynamics, which in turn should help determine the next direction of the GBP/USD pair.
From a technical perspective, the recent break below the very important 25-day simple moving average at 1.3177 is considered a key trigger for GBP/USD bears. Furthermore, the oscillator on the daily chart is deep in negative territory, supporting the possibility of some selling pressure around the 1.3120-1.3125 area. The next resistance level is 1.3177, a break of which could trigger a new wave of short covering. A subsequent rally could help the GBP/USD pair reclaim the 1.3200 level and the 1.3215 (November 13 high), and further climb to the key 200-day simple moving average at 1.3298. A sustained break above the latter could shift the short-term bias towards bullish traders and pave the way for some meaningful appreciation in the near term. On the other hand, the 1.3040-1.3035 area, or the two-week low reached last Thursday, is likely to continue providing immediate support before the psychological level of 1.3000. A decisive break below the latter would expose the next relevant support level in the 1.2950 area, after which the GBP/USD pair could extend its downward trajectory, eventually testing levels below 1.2900.
Consider going long on GBP/USD around 1.3095 today; Stop loss: 1.3080; Target: 1.3150; 1.3160
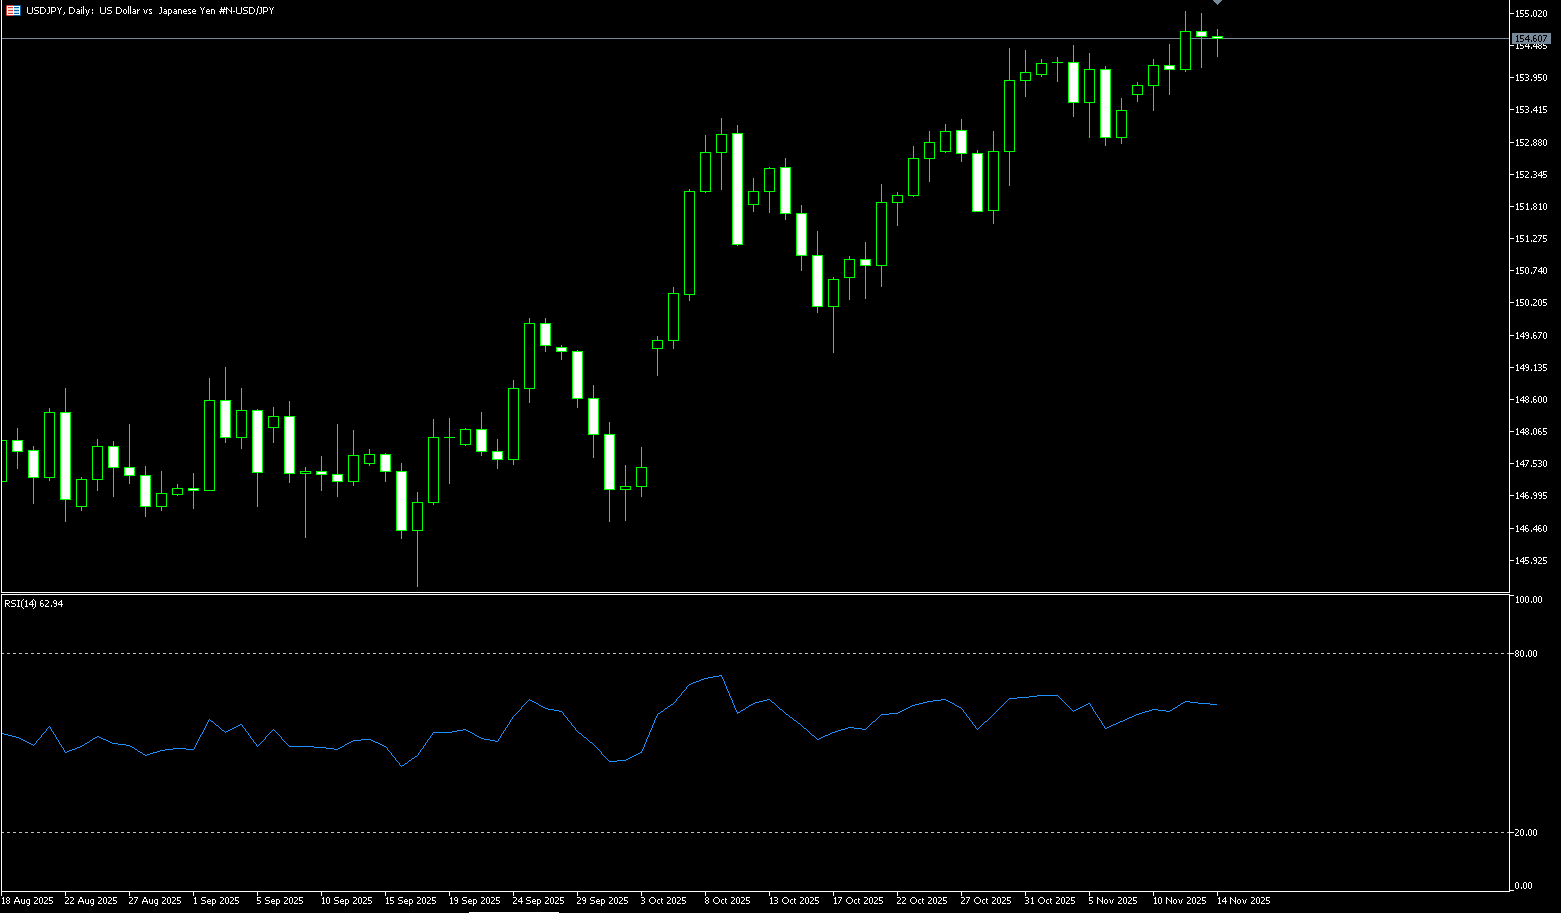
USD/JPY
The yen fell below 156.50 yen per dollar on Monday, partially erasing gains from the previous session, as traders continued to weigh a series of verbal interventions by authorities aimed at slowing the yen's depreciation. On Sunday, Takuji Aida, an advisor to Prime Minister Sanae Takaichi, said Tokyo could actively intervene in the currency market to offset the negative economic impact of the yen's depreciation. Bank of Japan Governor Kazuo Ueda and Finance Minister Satsuki Katayama also commented on the yen's weakness last week, sparking speculation that authorities might act when the yen approaches 160 yen per dollar, consistent with previous intervention levels. Last week, the yen fell to a ten-month low as Takaichi's massive stimulus package raised concerns about Japan's fiscal health, while her government also supported keeping interest rates low.
The daily chart suggests that a break above the 157.00 level could see USD/JPY rise further towards the resistance at last week's high of 157.89, followed by the 158.00 psychological level. A break above 158.00 would be seen as a new trigger for bullish traders, paving the way for further short-term appreciation towards 158.88 (the year-to-date high). A break above this level could see the pair move towards the psychological level of 160.00. On the other hand, the 156.00 area appears to be immediate support. A decisive break above this level could trigger some technical selling and drag USD/JPY to the 10-day simple moving average support at 155.62, with an ultimate target of the psychological level of 155.00. Any further declines are more likely to find good support around the 154.50-154.45 level.
Consider shorting the US dollar around 157.15 today; Stop loss: 157.35; Target: 156.20; 156.00
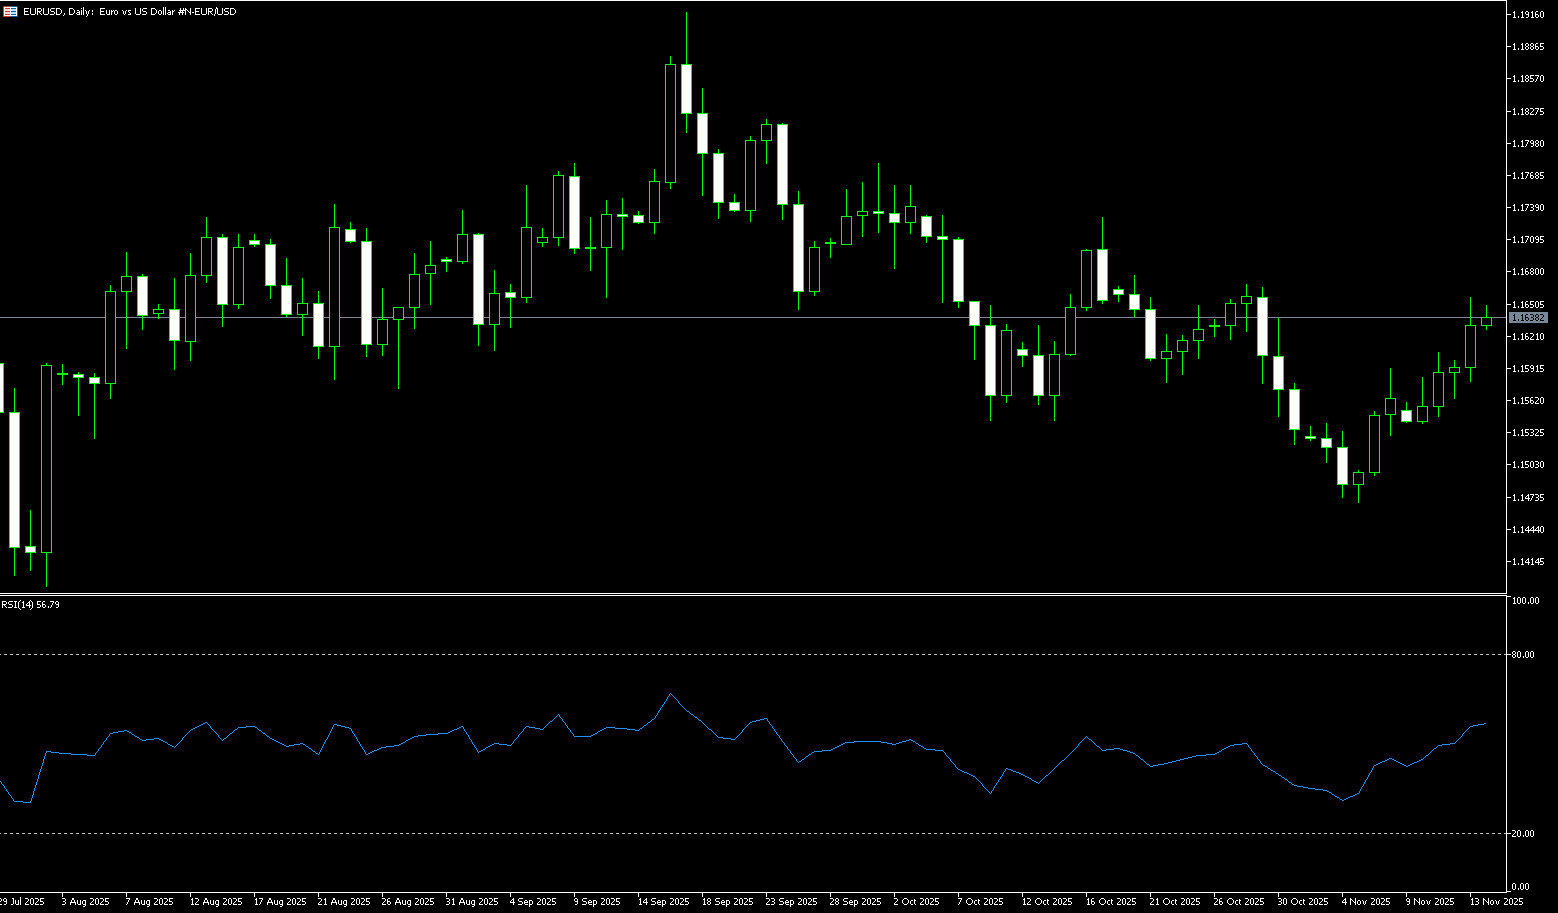
EUR/USD
The euro/dollar pair traded around 1.1520 in early trading on Monday. The dollar weakened against the euro due to rising expectations of a Federal Reserve rate cut. Traders are preparing for the release of US September producer price index and retail sales data later on Tuesday. Following dovish comments from New York Federal Reserve President John Williams, traders increased their bets on a December rate cut by the Fed, putting pressure on the dollar. Meanwhile, the European Central Bank is widely expected to keep interest rates unchanged until at least the end of 2025 and 2026, having previously kept key rates stable at its October meeting. A Reuters poll of economists in November confirmed this expectation, stating that the economic outlook is stable and inflation is under control. ECB President Christine Lagarde said on Friday that the central bank will remain vigilant about inflation risks and adjust interest rates as necessary to keep inflation at its 2% target. The European Central Bank's cautious stance may provide some support for the euro against the dollar in the short term.
The daily chart shows the 20-day simple moving average at 1.1560 consistently below the 34-day (1.1586) and 50-day (1.1637) simple moving averages, while the 100-day (1.1649) simple moving average is also declining. The pair remains below all these moving averages, maintaining a bearish bias. The 14-day Relative Strength Index (RSI) is at 40.65, recovering from earlier oversold readings but still below the 50 midline. The 23.6% Fibonacci retracement level measured from the high of 1.1918 to the low of 1.1468 is considered a correction at 1.1574, acting as immediate resistance, followed by the 38.2% retracement level at 1.1639. On the downside, 1.1500 (the psychological level) can be considered temporary support, followed by the 1.1468 level for the month and the 1.1400 mark.
Consider going long on the Euro today around 1.1505; Stop loss: 1.1495; Target: 1.1560; 1.1570
Disclaimer: The information contained herein (1) is proprietary to BCR and/or its content providers; (2) may not be copied or distributed; (3) is not warranted to be accurate, complete or timely; and, (4) does not constitute advice or a recommendation by BCR or its content providers in respect of the investment in financial instruments. Neither BCR or its content providers are responsible for any damages or losses arising from any use of this information. Past performance is no guarantee of future results.
Lebih Liputan


Pendedahan Risiko:Instrumen derivatif diniagakan di luar bursa dengan margin, yang bermakna ia membawa tahap risiko yang tinggi dan terdapat kemungkinan anda boleh kehilangan seluruh pelaburan anda. Produk-produk ini tidak sesuai untuk semua pelabur. Pastikan anda memahami sepenuhnya risiko dan pertimbangkan dengan teliti keadaan kewangan dan pengalaman dagangan anda sebelum berdagang. Cari nasihat kewangan bebas jika perlu sebelum membuka akaun dengan BCR.
BCR Co Pty Ltd (No. Syarikat 1975046) ialah syarikat yang diperbadankan di bawah undang-undang British Virgin Islands, dengan pejabat berdaftar di Trident Chambers, Wickham’s Cay 1, Road Town, Tortola, British Virgin Islands, dan dilesenkan serta dikawal selia oleh Suruhanjaya Perkhidmatan Kewangan British Virgin Islands di bawah Lesen No. SIBA/L/19/1122.
Open Bridge Limited (No. Syarikat 16701394) ialah syarikat yang diperbadankan di bawah Akta Syarikat 2006 dan berdaftar di England dan Wales, dengan alamat berdaftar di Kemp House, 160 City Road, London, City Road, London, England, EC1V 2NX. Entiti ini bertindak semata-mata sebagai pemproses pembayaran dan tidak menyediakan sebarang perkhidmatan perdagangan atau pelaburan.

 English
 简体中文
简体中文
 繁體中文
繁體中文
 Bahasa
Melayu
Bahasa
Melayu
 Tiếng
Việt
Tiếng
Việt
 ไทย
ไทย
 日本語
日本語
 한국어
한국어
 ភាសាខ្មែរ
 español