


0
US Dollar Index
The US Bureau of Labor Statistics released data last week showing that the US economy added more jobs than expected in September, but rising unemployment and downward revisions to data from previous months have created uncertainty for the Federal Reserve regarding whether to cut interest rates next month to support the labor market. The US dollar index remained above 100 until the end of last week and is expected to rise nearly 1% this week. It is anticipated that the Fed will avoid cutting rates in December, and the US jobs report will have little impact on the outlook. The prolonged US government shutdown has delayed the release of key economic data, including employment and inflation reports. Uncertainty about the US economy may put pressure on the dollar index in the short term. In addition, the Fed meeting minutes were released, and as expected, they confirmed the core conclusions of the meeting three weeks ago: there was a general consensus within the Fed that a rate cut was necessary last month, but the prospect of a third consecutive 25 basis point rate cut in December could trigger more serious disagreements. In fact, the interest rate-related content in the minutes suggests that maintaining the current rate is the most likely outcome. Clearly, three weeks ago, Fed officials favored keeping rates unchanged in December.
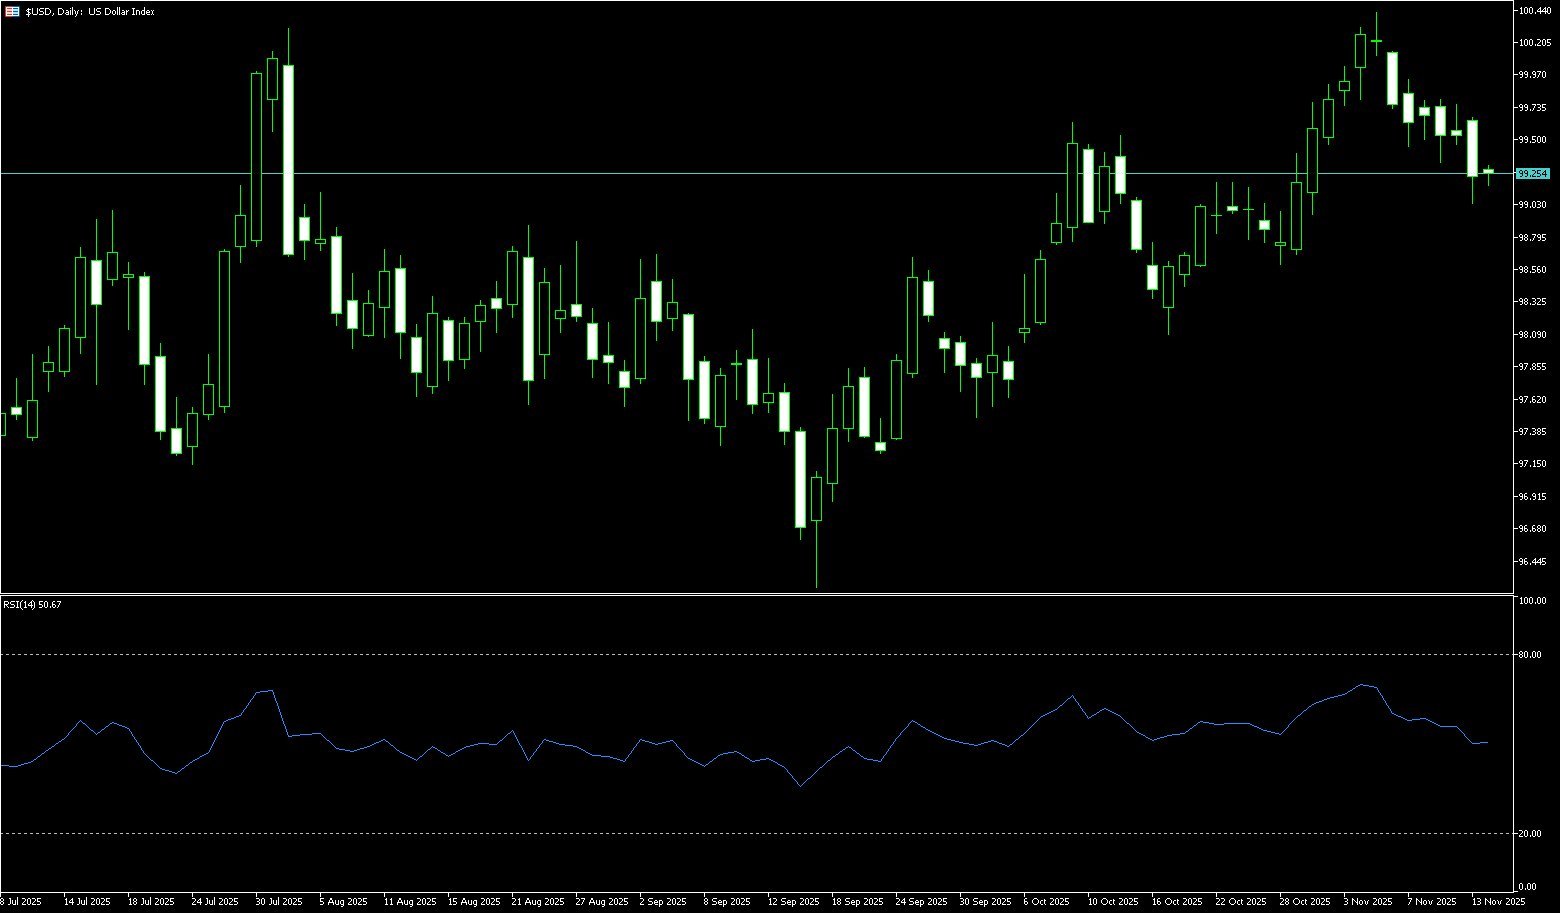
Since bottoming out near the previous support level of 96.21 on September 17, the US dollar index has been steadily rising, supported by the gradually weakening market expectations for a December rate cut. Last week, the dollar index strengthened further, remaining firmly above the key psychological level of 100. On the daily chart, technical indicators are upward, with the 14-day Relative Strength Index (RSI) around 63.90, in a relatively strong zone and approaching overbought territory, indicating a weakening of bullish momentum. The MACD indicator shows a decrease in bullish momentum, suggesting some exhaustion of bullish energy. Regarding the moving average system, short-term moving averages are in a bullish alignment, but the price is approaching the long-term moving average resistance zone, further strengthening the effectiveness of the resistance above. On the upside, the dollar index is testing resistance near 100.53 (the high of May 29). A successful break above this level would open the door to a further attack on the psychological level of 101.00. On the downside, the bullish trend will only turn neutral if the US dollar index breaks below the 99.85 (200-day simple moving average) and 99.67 (9-day simple moving average) areas.
Today, consider shorting the US dollar index around 100.28; stop loss: 100.40; target: 99.80; 99.70
WTI Crude Oil
WTI crude oil fell to a near one-month low of $57.32 per barrel last week, declining for several consecutive trading days, resulting in last week's losses. Ukrainian President Zelensky expressed his willingness to engage in peace talks. The blueprint drafted by the US and Russia is expected to be further discussed when Zelensky speaks with President Trump in the coming days. On the other hand, during the session, the Russian Deputy Prime Minister stated that despite US restrictions on two Russian oil companies, production plans have not been affected, and domestic prices have even stabilized due to export restrictions, decreased demand, and refinery restarts, leading to a decline in retail crude oil prices. Meanwhile, on November 19, 2025, key data released by the American Petroleum Institute (API) and the Energy Information Administration (EIA) outlined the complex landscape of the current crude oil market: "loose supply, inventory accumulation, and a short-term price rebound," providing crucial decision-making references for crude oil traders. Another detail is that US Army Secretary Dan Driscoll has arrived in Ukraine, planning to meet with Russian representatives. A senior Ukrainian official stated that Ukraine has received "signals" regarding a series of proposals discussed between the US and Russia aimed at ending the conflict, but Ukraine has not participated in the preparation of these proposals. This is also a real bearish factor for crude oil. Therefore, traders need to closely monitor subsequent EIA full inventory reports, OPEC+ production cut policy developments, and changes in global demand data, be wary of the risk of a pullback after a short-term rebound, and rationally plan position sizing and stop-loss strategies.
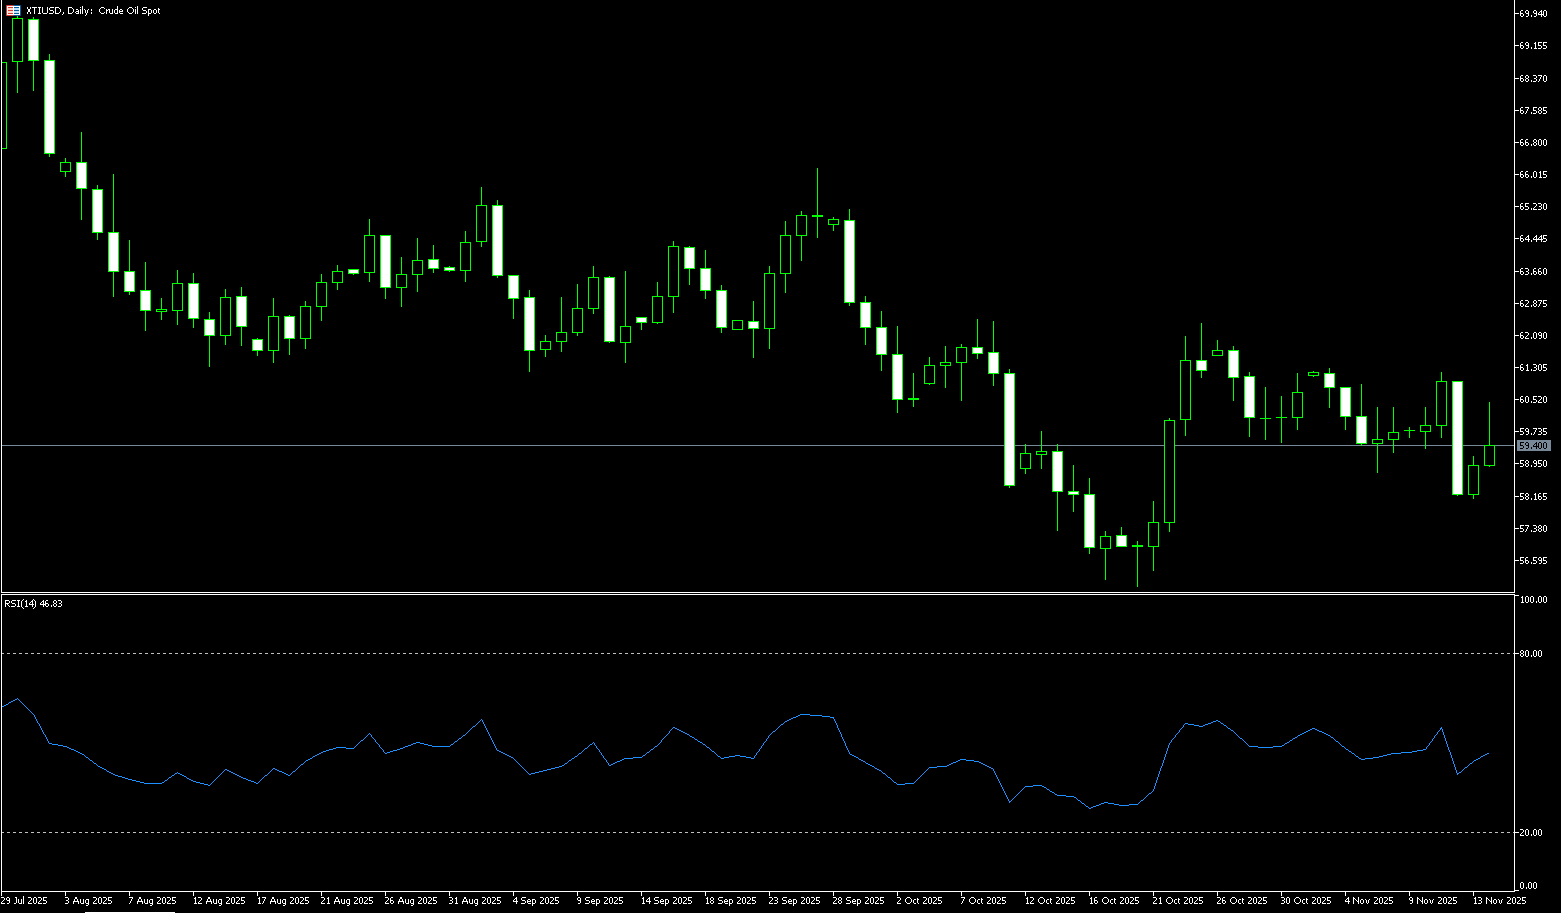
The daily chart shows that WTI crude oil prices experienced two consecutive rapid declines exceeding 3% in the past eight trading days (November 12th and 19th). Technical indicators, including the 14-day Relative Strength Index (RSI) and MACD, are both in negative territory, indicating strong bearish momentum and suggesting that the market may remain bearish in the short term. The long-term bearish fundamentals mean that every rebound could be a good selling opportunity, and chasing highs is an unwise market strategy. Currently, the key support levels remain at $58.02 (lower Bollinger Band) and $58.00 (psychological level), forming the initial support zone. A break below $58.00-$58.02 could further strengthen the bearish momentum to the October 22nd low of $57.31. Ultimately, the October low of $55.97 will again become the market focus. The first resistance zone is at $59.80 (Middle Bollinger Band) and the $60.00 (psychological level). Oil prices need to recover the aforementioned resistance level to potentially test the 55-day simple moving average at $60.81. A break above this level would strengthen the short-term bullish bias and push prices towards $61.58 (the upper Bollinger Band). A further break above this level could lead to a rebound to $62.38 (the October 24 high).
Consider going long on crude oil today around $57.75; Stop loss: $57.56; Target: $59.00; $59.50
Spot Gold
Gold prices briefly fell below the psychological level of $4,000 to $3,998 last week before rebounding and fluctuating above $4,000 per ounce. A moderate weekly decline is expected as expectations for a December Fed rate cut have weakened following the release of the jobs report. The report showed that non-farm payrolls increased by 119,000 in September, far exceeding the expected 50,000. These data reinforced the Federal Reserve's October assessment that the labor market is cooling but remains stable. Meanwhile, the unemployment rate rose to 4.4%, the highest level since October 2021. Nvidia's strong earnings report significantly improved global market risk sentiment, driving a rebound in global stock markets and diverting funds away from gold as a safe-haven asset. Safe-haven assets and risk equities influence each other; when US tech stocks and gold stocks fall together, one is likely overshooting. Conversely, when tech stocks reverse their declines after proving that the AI narrative has indeed brought rapid earnings growth, gold begins to give back its gains from the first half of last week. Furthermore, the strengthening of the US dollar against most major currencies makes dollar-denominated gold more expensive for overseas buyers, further suppressing gold demand. Although gold, as a traditional safe-haven asset, has risen 55% this year and reached a record high of $4,381 on October 20, the market has recently shown a consolidation trend.
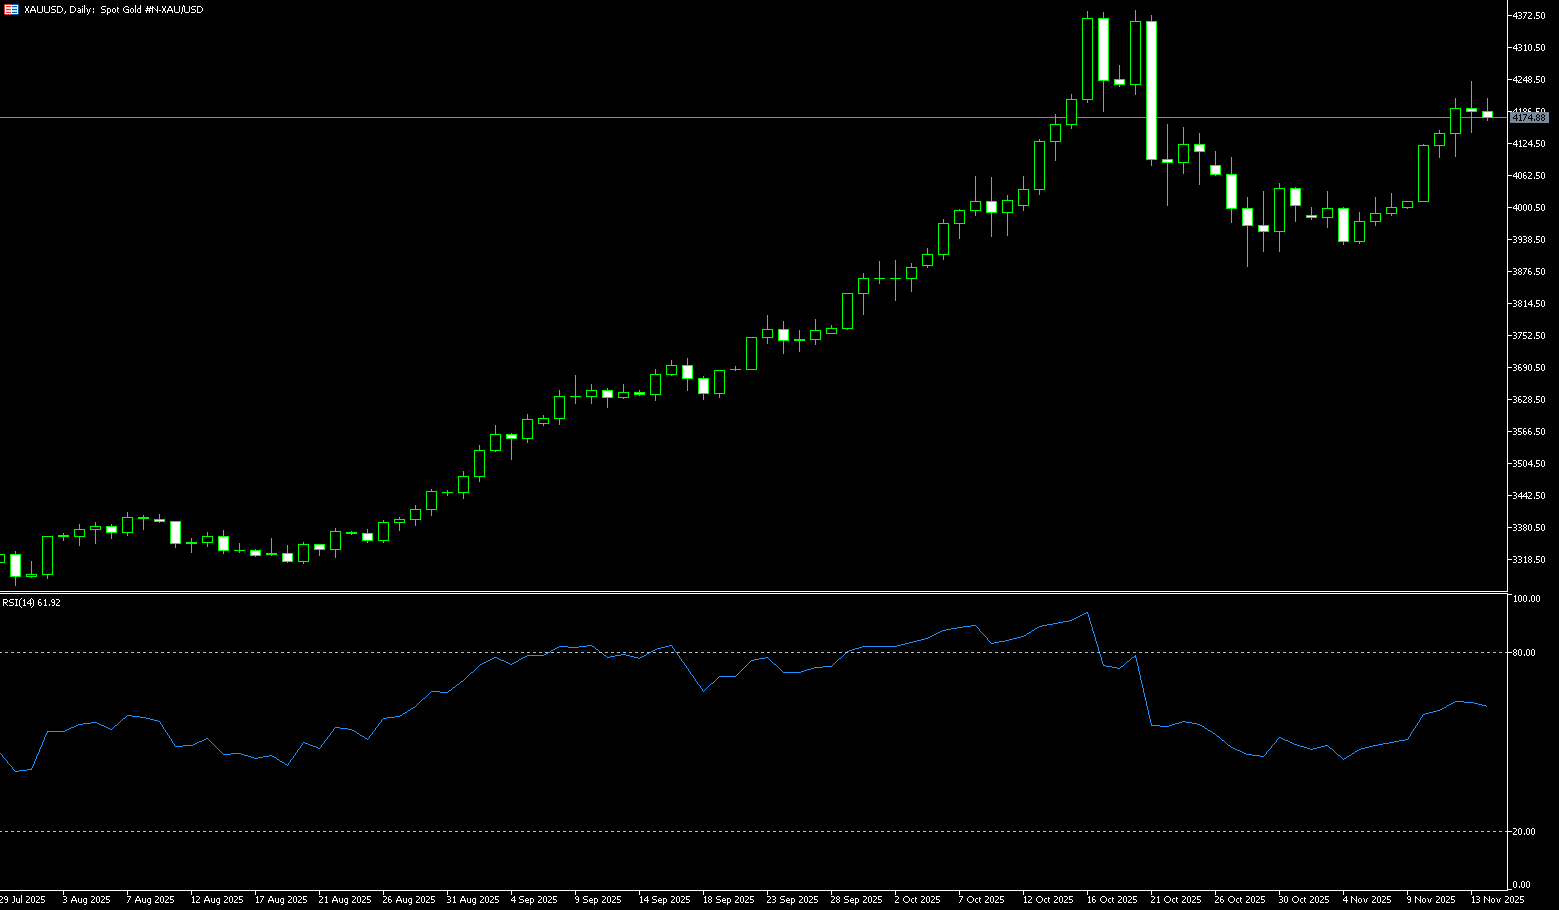
From the daily chart, gold prices repeatedly tested the $4,100 level last week (reaching as high as $4,132 at one point) without success, indicating insufficient short-term breakout momentum. The current price action appears to be a false breakout. This pattern is more akin to a consolidation structure within a strong long-term uptrend. Even if a strong upward breakout doesn't occur immediately, this consolidation pattern is likely to accumulate momentum for a subsequent bullish bias. If gold prices continue to fall, the areas around $3,998 (last week's low) and $4,000 (a psychological level) will form key support. A break below these levels could lead to a retest of the $3,950.10 (55-day simple moving average) and $3,930 (November 4th low) support levels, and even a potential retest of the late October lows around $3,886. Conversely, if the price breaks through the $4,100 (psychological level) and $4,100.90 (9-day simple moving average), a corrective upward trend may begin, targeting $4,132 (last week's high) and the $4,200 psychological level.
Today, consider going long on gold around $4,063; Stop loss: $4,058; Target: $4,100; $4,110
AUD/USD
Last week, the Australian dollar traded near $0.6420, close to its lowest level in three months, as investors assessed the ongoing debate within the Reserve Bank regarding the actual extent of tightening policy. Comments from Deputy Governor Sarah Hunter highlighted that the central bank is reassessing three key shifts in the economy, including how businesses price post-pandemic, how tight the labor market remains, and changes in policy transmission given the stronger-than-expected response in the housing market. Meanwhile, the economy showed signs of growth after improving PMI data in November, with the composite output index expanding for the fourteenth consecutive month. These data, combined with improved business surveys, stronger consumer confidence, a declining unemployment rate, and a surging housing market, reduced the likelihood of further rate cuts by the Reserve Bank of Australia. Elsewhere, the US dollar remained strong as the Federal Reserve was expected to keep interest rates unchanged in December, with the mixed US jobs report having little impact. On the other hand, the People's Bank of China decided last week to maintain the Loan Prime Rate (LPR) unchanged in November. The one-year and five-year LPRs are 3.00% and 3.50%, respectively. Given the close trading partnership between China and Australia, China's policy rates could influence the Australian dollar.
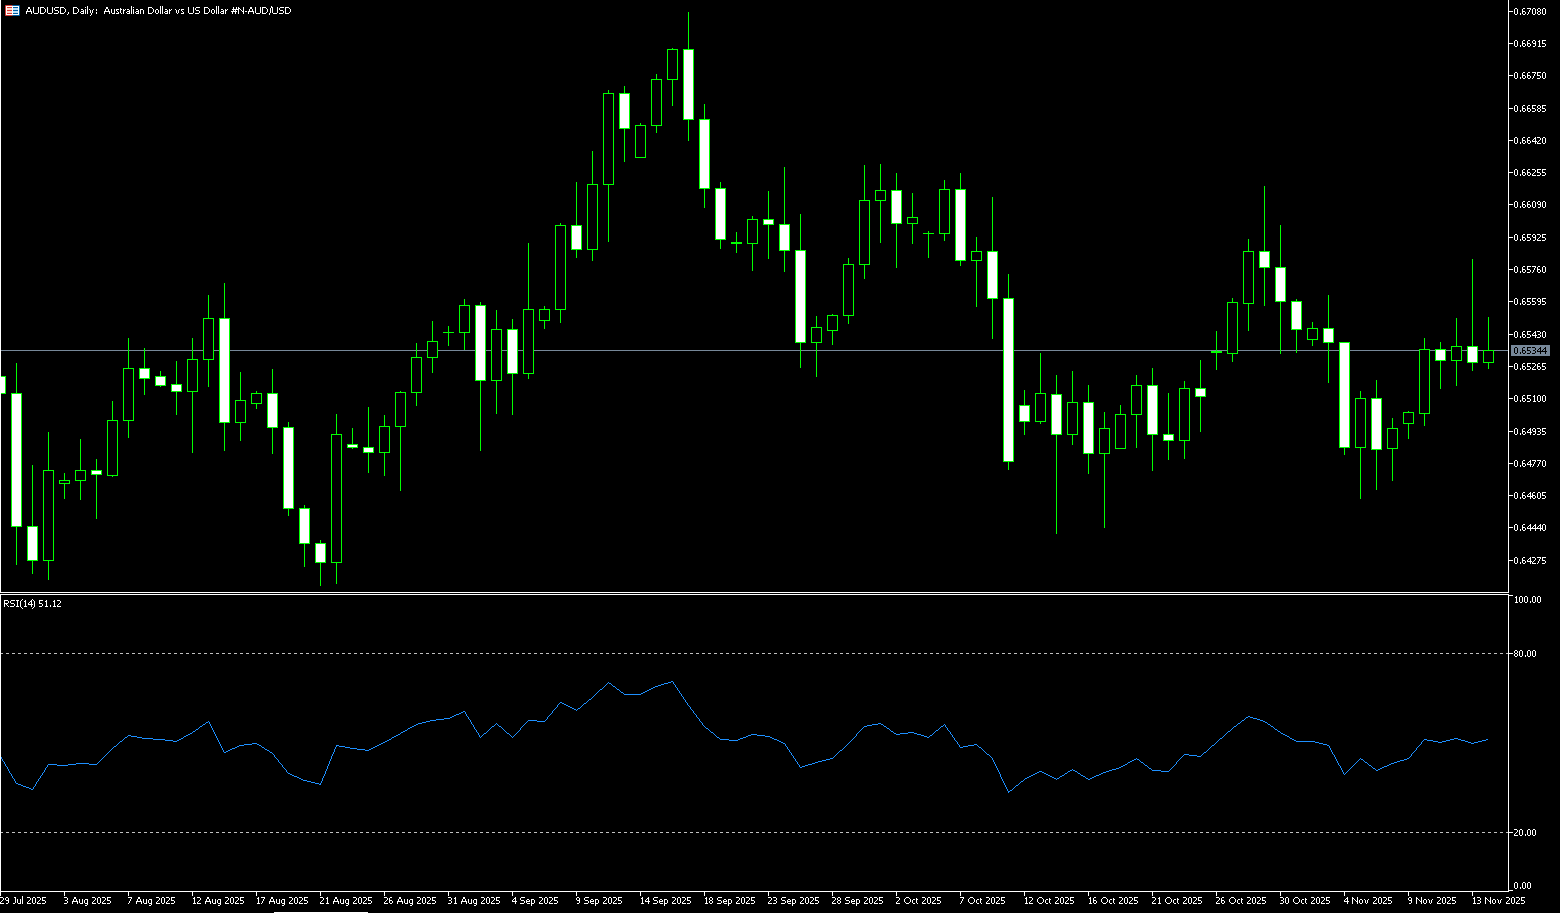
The Australian dollar traded below US$0.6420 last week, near its lowest level in three months. Weekly chart analysis suggests the pair is currently consolidating around the midline of a descending channel at 0.6435, indicating a period of consolidation. Meanwhile, AUD/USD remains below the 14-week simple moving average at 0.6535 and the upper trendline of the descending channel at 0.6545, highlighting weak short-term momentum. The 14-day Relative Strength Index (RSI) is near the 50 level, reflecting a continued weak trend. Therefore, on the downside, the pair found immediate support near the midline of the descending channel at 0.6435 and around 0.6420 (last week's low), followed by the psychological low of 0.6400. A break below this level would target 0.6372 (June 23 low) and even the psychological level of 0.6300. Initial resistance is at the psychological level of 0.6500. A break above this overlapping resistance zone would improve short-term price momentum and move the pair closer to the 9-week simple moving average at 0.6535, the upper trendline of the descending channel at 0.6545, and the 0.6580 area (November 13 high).
Consider going long on the Australian dollar around 0.6445 today; Stop loss: 0.6430; Target: 0.6490; 0.6500
GBP/USD
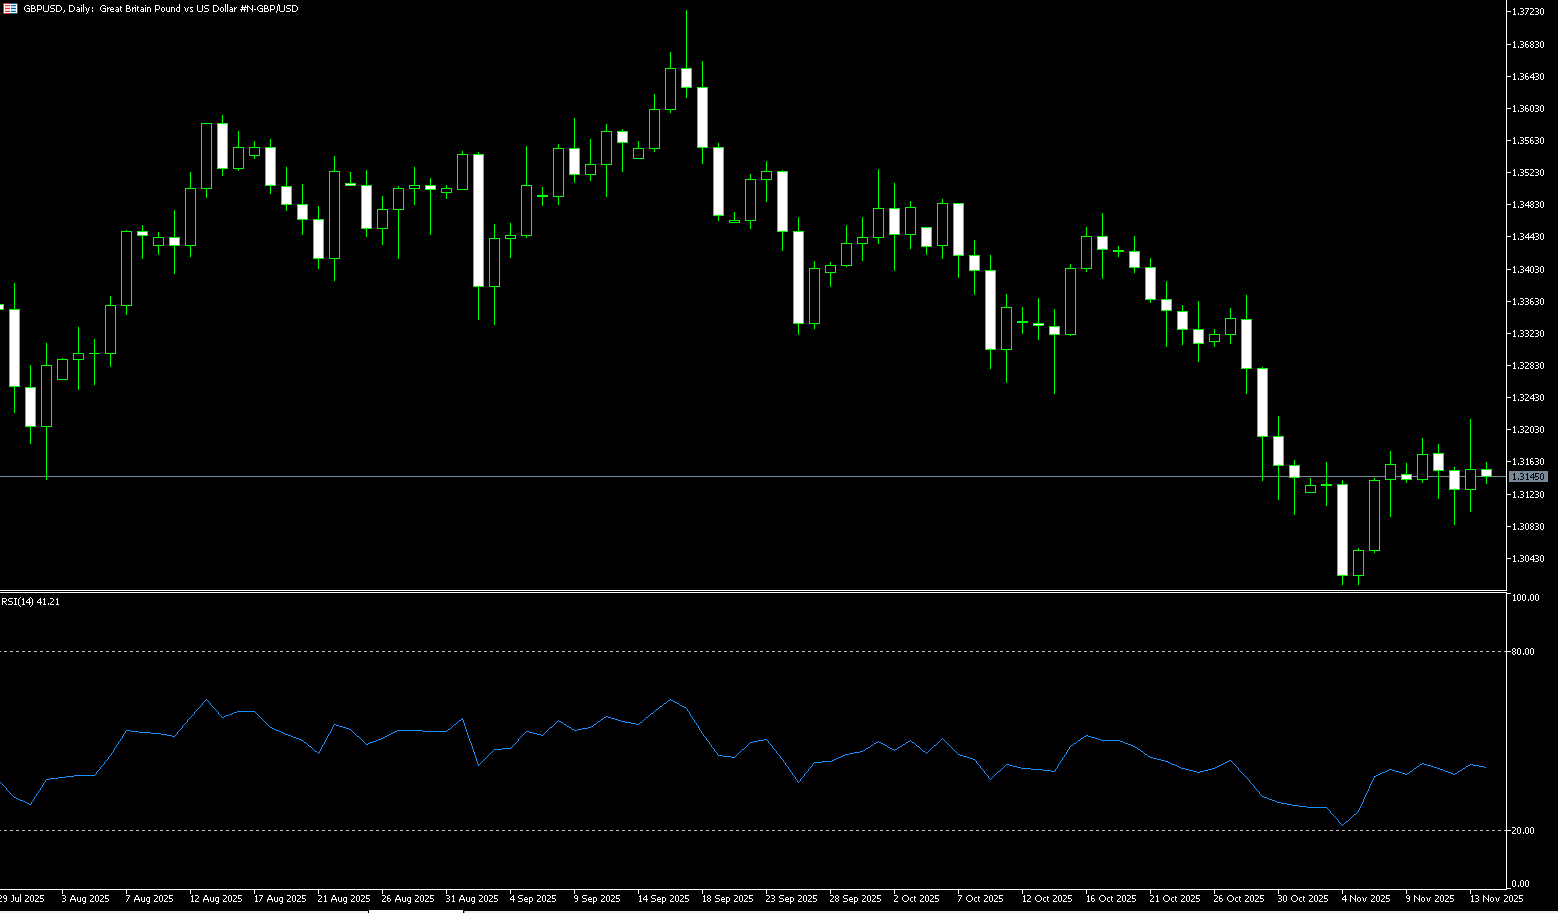
The GBP/USD pair repeatedly declined last week, reaching a more than two-week low of 1.3038. Given the growing market expectation of a rate cut by the Bank of England at its next monetary policy meeting in December, the potential upside for this major currency pair may be limited. Recent weak UK economic data, such as consumer price index inflation, disappointing GDP and industrial production figures, have fueled market bets on a rate cut at the Bank of England's December meeting. According to a Reuters survey last month, most economists expect the Bank of England to cut rates in December as inflation cools in the coming months, followed by another rate cut early next year. On the other hand, the UK Chancellor of the Exchequer abandoned a planned income tax increase, introducing new uncertainty into UK fiscal policy adjustments. This, coupled with weaker economic data, has strengthened expectations of a December rate cut by the Bank of England, raising concerns about the sustainability of UK finances. This puts continued downward pressure on the pound. This strategy of "no tax increases but structural tightening" has made investors cautious about the UK's fiscal outlook, thus putting pressure on the pound. Even with limited gains in the dollar, the cooling of expectations for a Fed rate cut has supported its strength. Overall, the pound is unlikely to escape its weak trend in the short term.
The current downward trend of the pound against the dollar is mainly suppressed by two factors: continued weakness in UK economic data and a significant contraction in expectations for a US rate cut. If UK inflation data continues to decline as expected, further declines in the pound are almost inevitable. Attention should be paid to whether the psychological level of 1.3000 and the 1.3010 area (the low of November 4th) will be breached. The medium-term direction depends on whether the Bank of England gives a clear policy shift signal in December. The daily chart shows that the pound/dollar maintains a weak and volatile structure. The exchange rate has closed lower for several consecutive days, trading below short-term moving averages, indicating significant selling pressure above. Technically, the 14-day RSI is in the neutral-to-weak zone (latest at 40.57), showing no signs of reversal; the MACD histogram is gradually contracting, suggesting that downward momentum is still being released. Key support lies in the 1.3010-1.3000 range. A break below this area could lead to further declines towards 1.2966 (April 11 low), and potentially even below 1.2900. Initial resistance is near 1.3148 (20-day simple moving average), followed by 1.3200 (psychological level) and the 1.3215 (November 13 high) area. Overall, the daily chart structure is weak, maintaining downward pressure in the short term.
Consider going long on GBP/USD near 1.3092 today; Stop loss: 1.3080; Target: 1.3150; 1.3160
USD/JPY
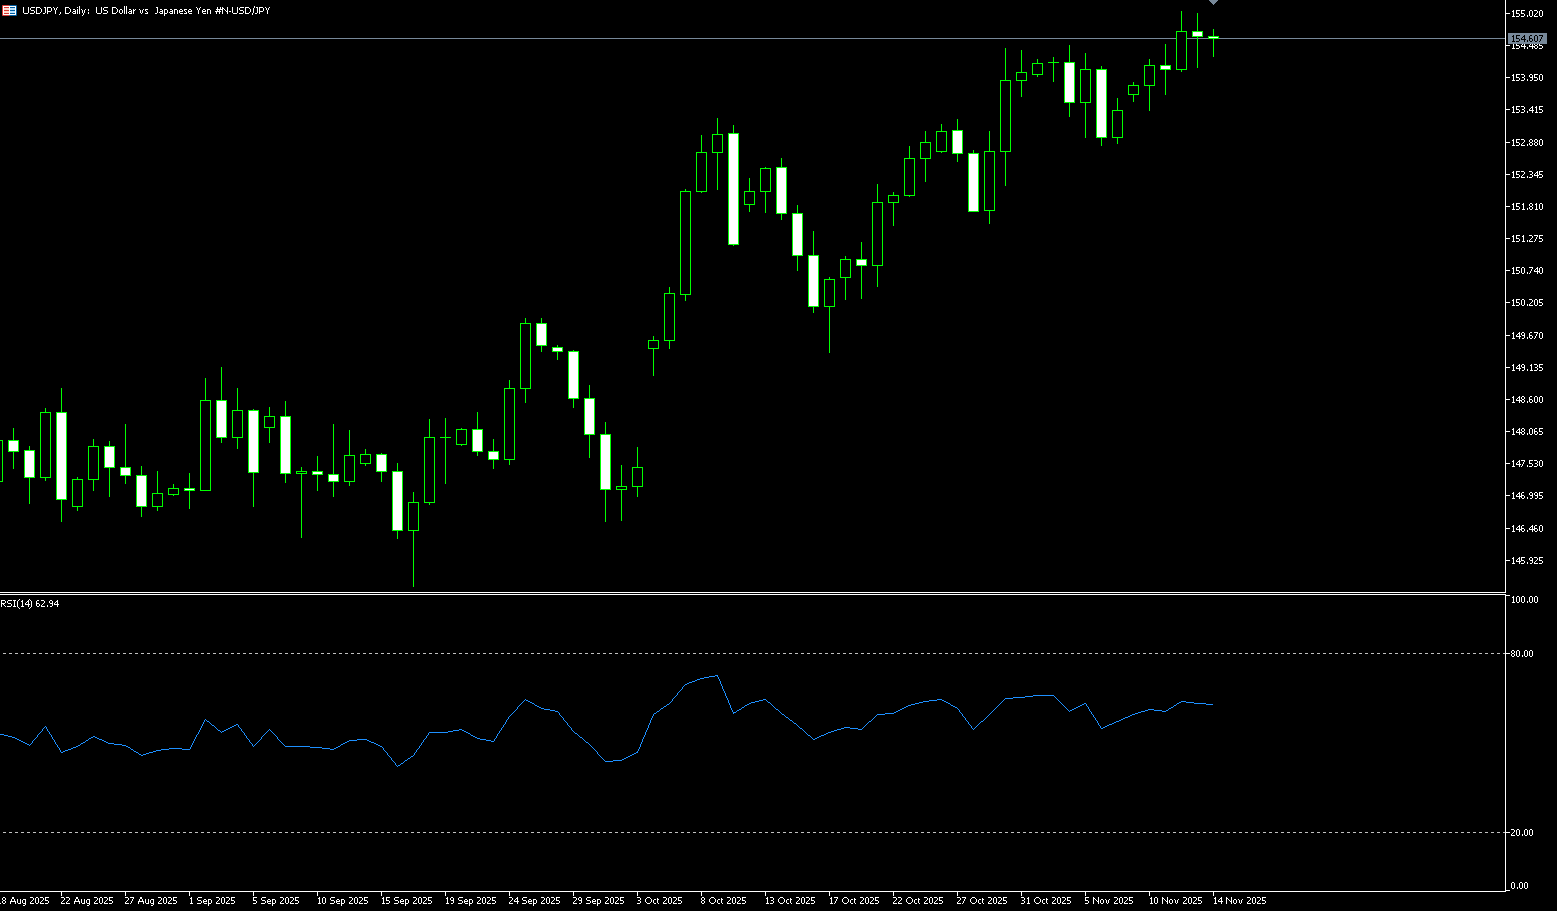
The yen weakened last week to 157.89 yen per dollar, its lowest level this year, as investors prepared for the announcement of Sanae Takashi's stimulus package, expected to exceed 20 trillion yen. This massive spending plan sparked concerns about Japan's fiscal health, driving a "yen-selling" trade and pushing the yen and bond prices lower. Traders now expect authorities to intervene again if the yen approaches 160 yen per dollar, consistent with past intervention levels. Despite the pause, the yen is expected to fall nearly 1.20% this week. Market concerns about potential government intervention led some short covering before the end of last week, but the overall weak structure remains intact. The massive supplementary budget has raised questions about Japan's fiscal sustainability, pushing government bond yields to multi-decade highs. Coupled with a contraction in the third quarter, the market widely expects the Bank of Japan to postpone interest rate hikes. Meanwhile, strong US data and a firm dollar have kept the USD/JPY pair on an upward trend. However, in the overall context, the yen's weakness is still influenced by Japan's deteriorating fiscal situation and unstable economic growth, and the lack of substantial positive factors makes it difficult to reverse the current trend. The current yen's movement reflects not only differences in monetary policy but also the complex interaction between fiscal expansion, weak economy, and changing market expectations. While the massive supplementary budget will stimulate the economy in the short term, structural debt pressures will suppress the yen's performance in the long term.
Unless there is explicit intervention from the Japanese government or a policy shift by the Bank of Japan, the yen's weakness is likely to continue. Technically, the USD/JPY's 14-week RSI has fallen below overbought levels (currently at 69.50), limiting the bulls' willingness to push higher. The market may need to consolidate at higher levels or experience a moderate pullback to build momentum for the next move. If the exchange rate corrects, the 156.00 level may become the first support level; a break below 156.00 could trigger further technical selling pressure, leading to a deeper pullback to the 155.00 level and the 154.25 level (the 5-week simple moving average). A break above this level would target the psychological level of 154.00. If the price continues to rise, 157.89 (last week's high) becomes a key resistance level in the near term; a break above this level could lead to another test of the 158.00 level. Higher resistance lies near 158.88 (early year high); a break above this level could see the price move towards the psychological level of 160.00.
Today, consider shorting the US dollar near 156.60; Stop loss: 156.80; Target: 155.50; 155.30
EUR/USD
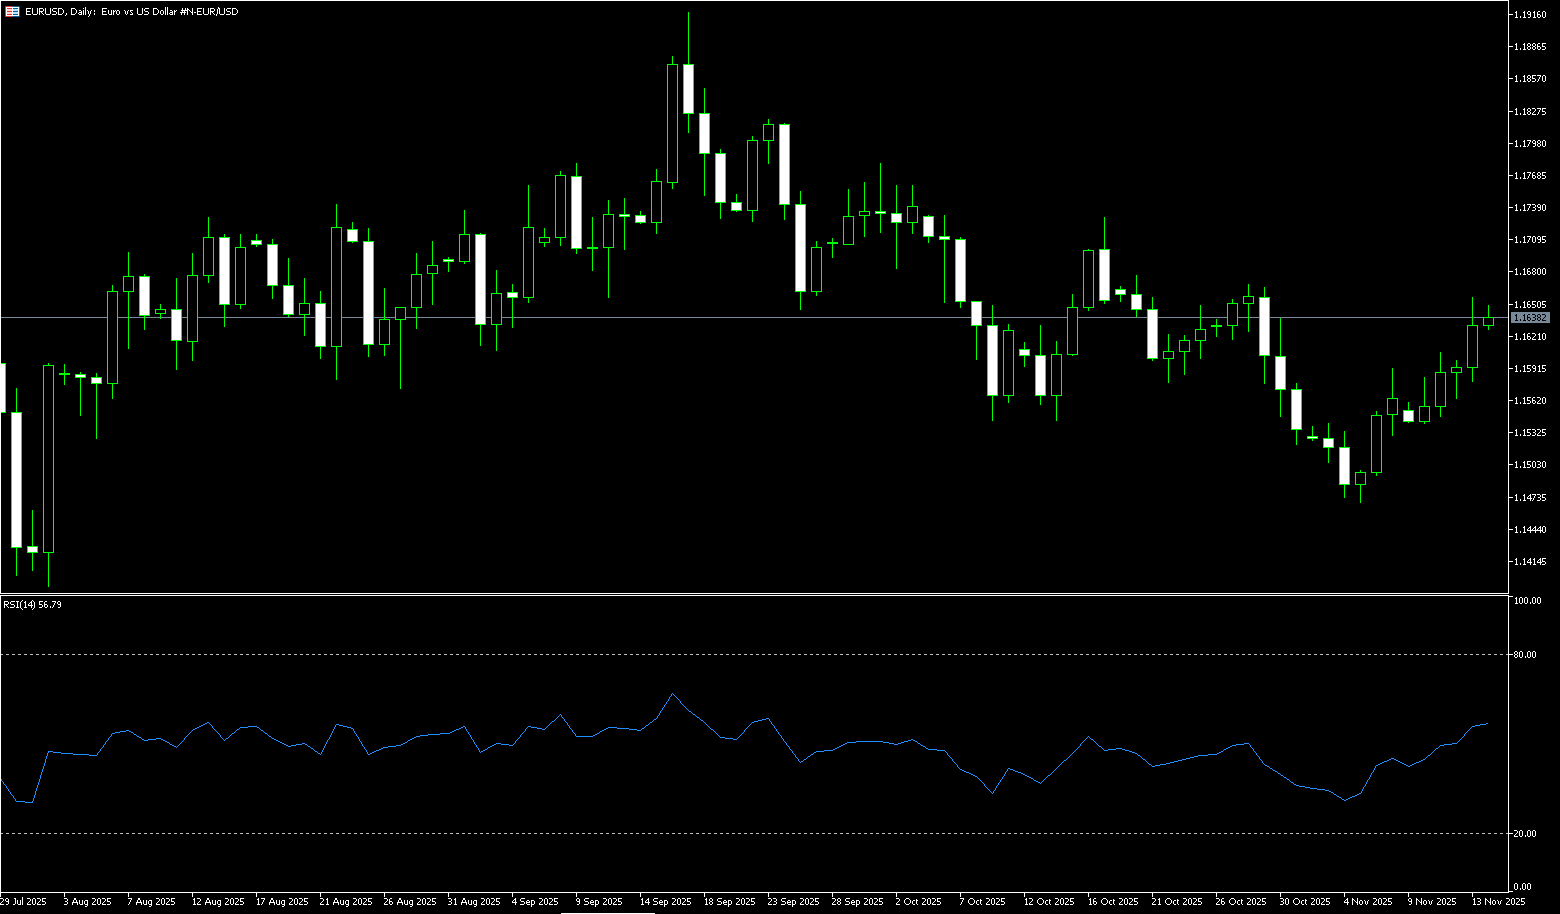
The euro/dollar fell to $1.1491 before the end of last week, its lowest level in nearly three weeks, dragged down by a stronger dollar as traders lowered their expectations for a 25 basis point rate cut by the Federal Reserve in December. This shift in sentiment followed the cancellation of the October jobs report and the FOMC minutes showing policymakers divided on whether further policy easing was needed. In contrast, the European Central Bank is expected to keep interest rates unchanged until the end of 2026, with inflation close to its 2% target, stable economic growth, and record low unemployment. However, the recent impact on the euro against the dollar is not solely due to interest rate and inflation fundamentals, but rather a combination of macroeconomic factors and risk sentiment. On one hand, market expectations for a December rate cut by the Federal Reserve have slightly increased, reflecting concerns about a slowdown in US economic momentum; on the other hand, the recent sell-off in global stock markets has significantly strengthened risk aversion. In an environment of cooling risk appetite, the dollar, as a traditional safe-haven currency, has attracted capital inflows. While reducing holdings in stocks and some high-risk assets, funds have increased their allocation to cash and highly liquid instruments. This "safe-haven dollar buying" often outweighs the negative impact of weakening interest rate expectations in the short term, keeping the dollar index strong at high levels and putting pressure on the euro against the dollar below 1.16.
Looking at the daily chart, the euro against the dollar has fallen from its September high of 1.1918, with a temporary low of 1.1468 in November. The overall market remains in a top-down adjustment structure. The current exchange rate is hovering around 1.1500, slightly below the previous densely traded area of 1.1600-1.1607, exhibiting short-term characteristics of low-level sideways consolidation. The 1.1700 level above is a significant resistance point, having been repeatedly tested previously. On the downside, watch the 1.1500 psychological level and the current month's low of 1.1468, while the 1.1400 level provides support. Technically, the MACD histogram is gradually shortening from its low and turning upwards, with the fast and slow lines showing signs of converging and attempting to recover towards the zero line, reflecting a weakening of downward momentum, but not yet a complete reversal of the medium-term weak trend. The 14-day RSI is oscillating below 40.00, indicating a slight recovery in short-term sentiment but limited momentum. Overall, the current situation resembles a technical consolidation phase following the previous decline. Further trend development will depend on the price's performance within the aforementioned support and resistance zones.
Consider going long on the Euro today around 1.1505; Stop loss: 1.1493; Target: 1.1560; 1.1570
Disclaimer: The information contained herein (1) is proprietary to BCR and/or its content providers; (2) may not be copied or distributed; (3) is not warranted to be accurate, complete or timely; and, (4) does not constitute advice or a recommendation by BCR or its content providers in respect of the investment in financial instruments. Neither BCR or its content providers are responsible for any damages or losses arising from any use of this information. Past performance is no guarantee of future results.
Lebih Liputan


Pendedahan Risiko:Instrumen derivatif diniagakan di luar bursa dengan margin, yang bermakna ia membawa tahap risiko yang tinggi dan terdapat kemungkinan anda boleh kehilangan seluruh pelaburan anda. Produk-produk ini tidak sesuai untuk semua pelabur. Pastikan anda memahami sepenuhnya risiko dan pertimbangkan dengan teliti keadaan kewangan dan pengalaman dagangan anda sebelum berdagang. Cari nasihat kewangan bebas jika perlu sebelum membuka akaun dengan BCR.
BCR Co Pty Ltd (No. Syarikat 1975046) ialah syarikat yang diperbadankan di bawah undang-undang British Virgin Islands, dengan pejabat berdaftar di Trident Chambers, Wickham’s Cay 1, Road Town, Tortola, British Virgin Islands, dan dilesenkan serta dikawal selia oleh Suruhanjaya Perkhidmatan Kewangan British Virgin Islands di bawah Lesen No. SIBA/L/19/1122.
Open Bridge Limited (No. Syarikat 16701394) ialah syarikat yang diperbadankan di bawah Akta Syarikat 2006 dan berdaftar di England dan Wales, dengan alamat berdaftar di Kemp House, 160 City Road, London, City Road, London, England, EC1V 2NX. Entiti ini bertindak semata-mata sebagai pemproses pembayaran dan tidak menyediakan sebarang perkhidmatan perdagangan atau pelaburan.

 English
 简体中文
简体中文
 繁體中文
繁體中文
 Bahasa
Melayu
Bahasa
Melayu
 Tiếng
Việt
Tiếng
Việt
 ไทย
ไทย
 日本語
日本語
 한국어
한국어
 ភាសាខ្មែរ
 español