


0
US Dollar Index
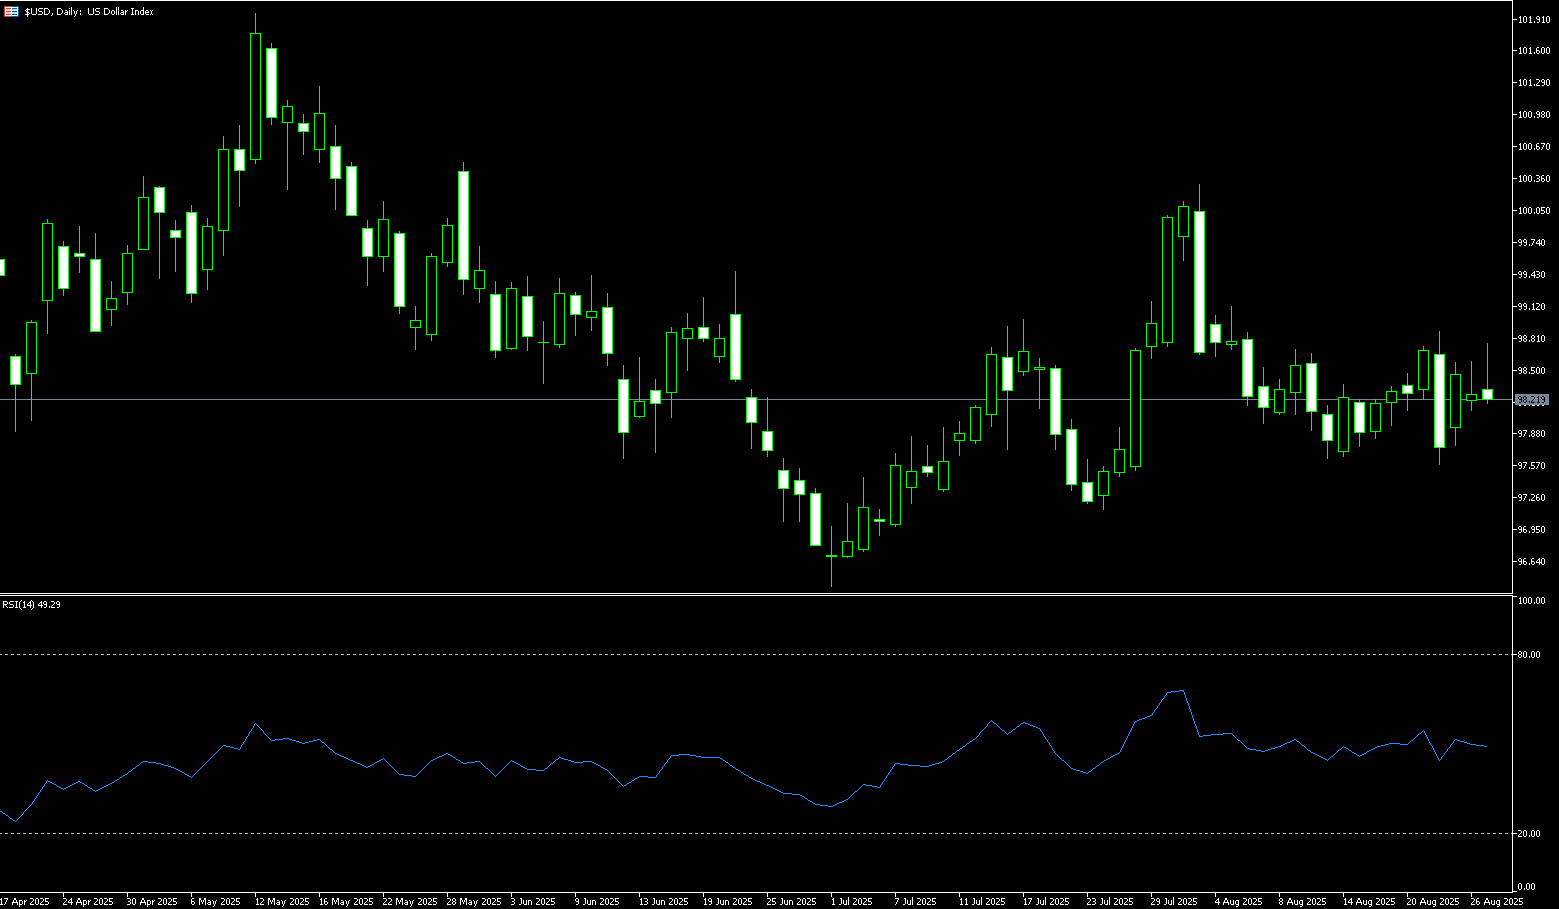
The US dollar index is recovering recent losses and briefly traded above 98.70 during Wednesday's session. The dollar's upside may be limited due to growing trader concerns about the Federal Reserve and the prospect of a more dovish central bank. Earlier this week, President Trump announced he would remove Federal Reserve Governor Lisa Cook from her position due to allegations of mortgage fraud, although Cook's lawyer stated she would pursue legal action to block the dismissal. Cook's potential removal could increase the likelihood of an earlier rate cut, giving Trump greater influence over the central bank. The market is currently pricing in an 87% probability of a 25 basis point rate cut by the Fed in September. Looking ahead, investors are looking forward to Friday's release of the PCE price index, the Fed's preferred inflation measure, for additional clues about the policy outlook. From a technical perspective, the US Dollar Index is currently consolidating above its 50-day moving average at 98.06 and the 98.00 round-figure level, but is generally trading in a narrow range between support at 97.70 (early week low) and resistance at 98.81 (100-day simple moving average). Earlier this month, bulls briefly broke through 100.25 but failed to hold. Since then, the US Dollar Index has struggled to reclaim 99.00, let alone test the psychological resistance level of 100.00. The US dollar is currently facing tangible resistance from political risks, but has yet to show signs of a breakdown. The 97.70 area provides solid support, which bears have yet to break. A clear break below this support level could lead to further declines to 97.00, while upside potential is limited at 98.81. Unless the US Dollar Index closes above this level and continues to push towards 99.00, the upward trend will be difficult to maintain.
Consider shorting the US Dollar Index at 98.35 today, with a stop-loss at 98.48 and a target of 97.80 or 97.70.
WTI Spot Crude Oil
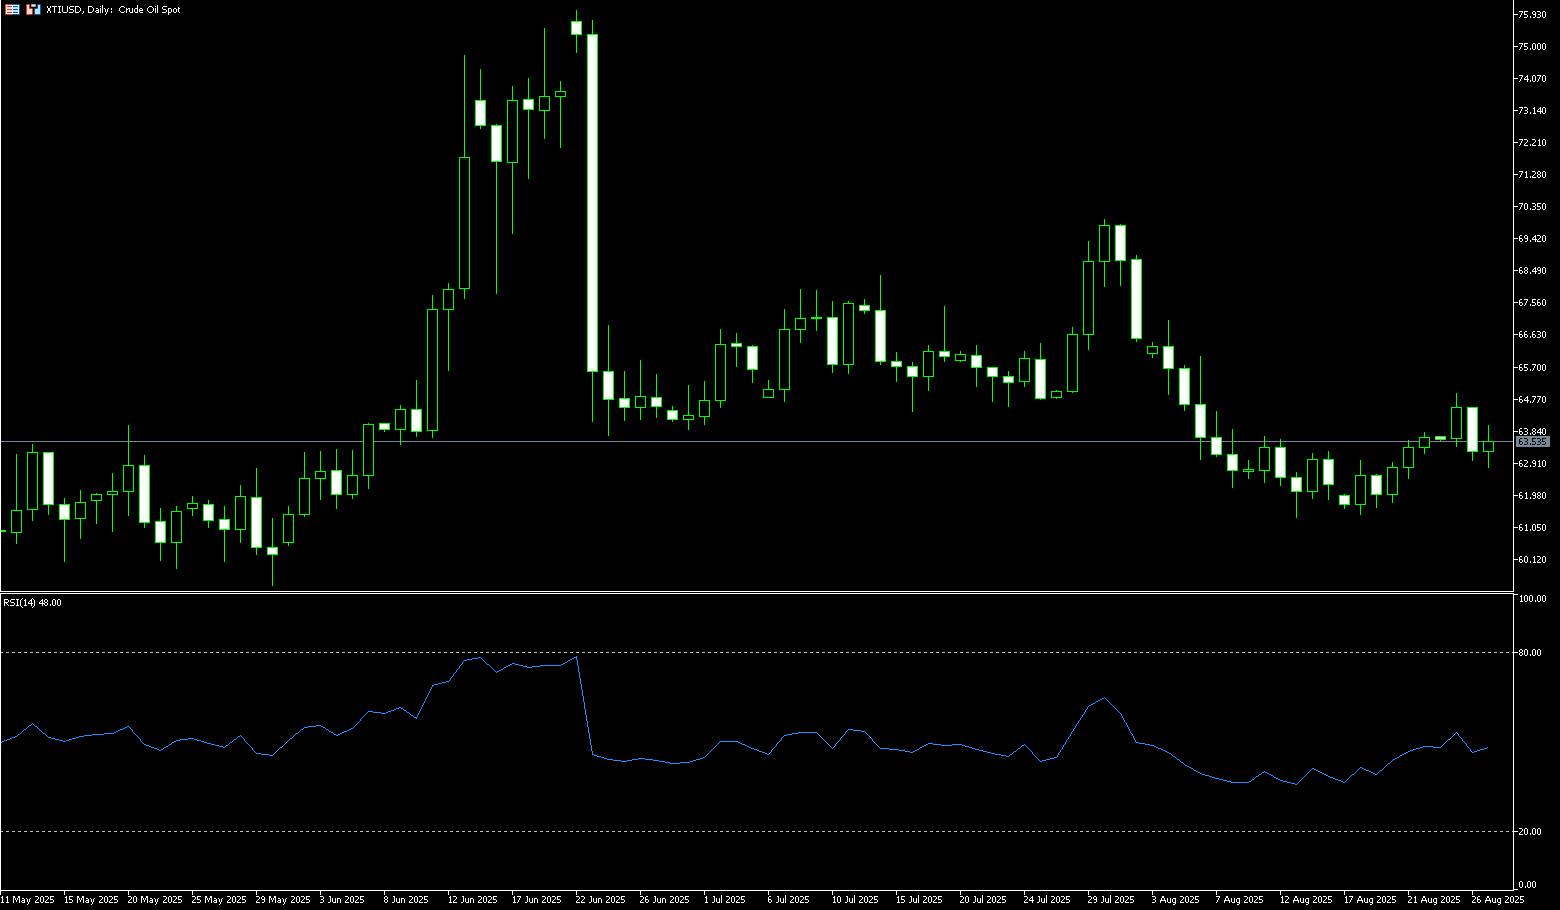
WTI crude oil prices hovered around $63.60 per barrel on Wednesday, down over 2% from the previous day, as investors assessed geopolitical risks and uncertainty surrounding the tariff dispute. Focus remained on developments between Russia and Ukraine, with both sides recently escalating attacks on each other's energy infrastructure. Meanwhile, the United States plans to raise tariffs on certain Indian goods to 50% today due to India's oil trade with Russia. Although analysts note that supply concerns are limited, as the Indian government has not yet ordered a halt to purchases of Russian crude oil, and refiners plan to continue most purchases. Investors are also monitoring broader market uncertainty stemming from the Federal Reserve's independence. Meanwhile, API data showed that US crude oil inventories fell by nearly 1 million barrels last week, less than the expected 1.7 million barrels.
In the short term, the market will continue to be influenced by a combination of geopolitical conflicts, Russian-Indian energy cooperation, and US tariff strategies. Oil prices are expected to continue to fluctuate between support and resistance, with the long-term trajectory depending on whether India seeks greater autonomy in the global energy market. On a daily basis, WTI crude oil has become a key trading point for both bulls and bears around $63.06 (the 9-day simple moving average), but significant pressure is evident above $65.76 (the 50.0% Fibonacci retracement level from $54.78 to $76.74). Technical indicators show a flattening of short-term moving averages, a narrowing MACD, and a neutral relative strength index (RSI), suggesting a lack of clear market direction. A break above $65.76 could lead to further gains towards the 200-day simple moving average at $67.13. However, a break below $63.06 could trigger a retest of the August 18 low of $61.45. The overall market is range-bound, awaiting further guidance from fundamental news.
Consider going long on crude oil at 63.40 today. Stop-loss: 63.20. Target: 64.80, 65.00.
Spot Gold
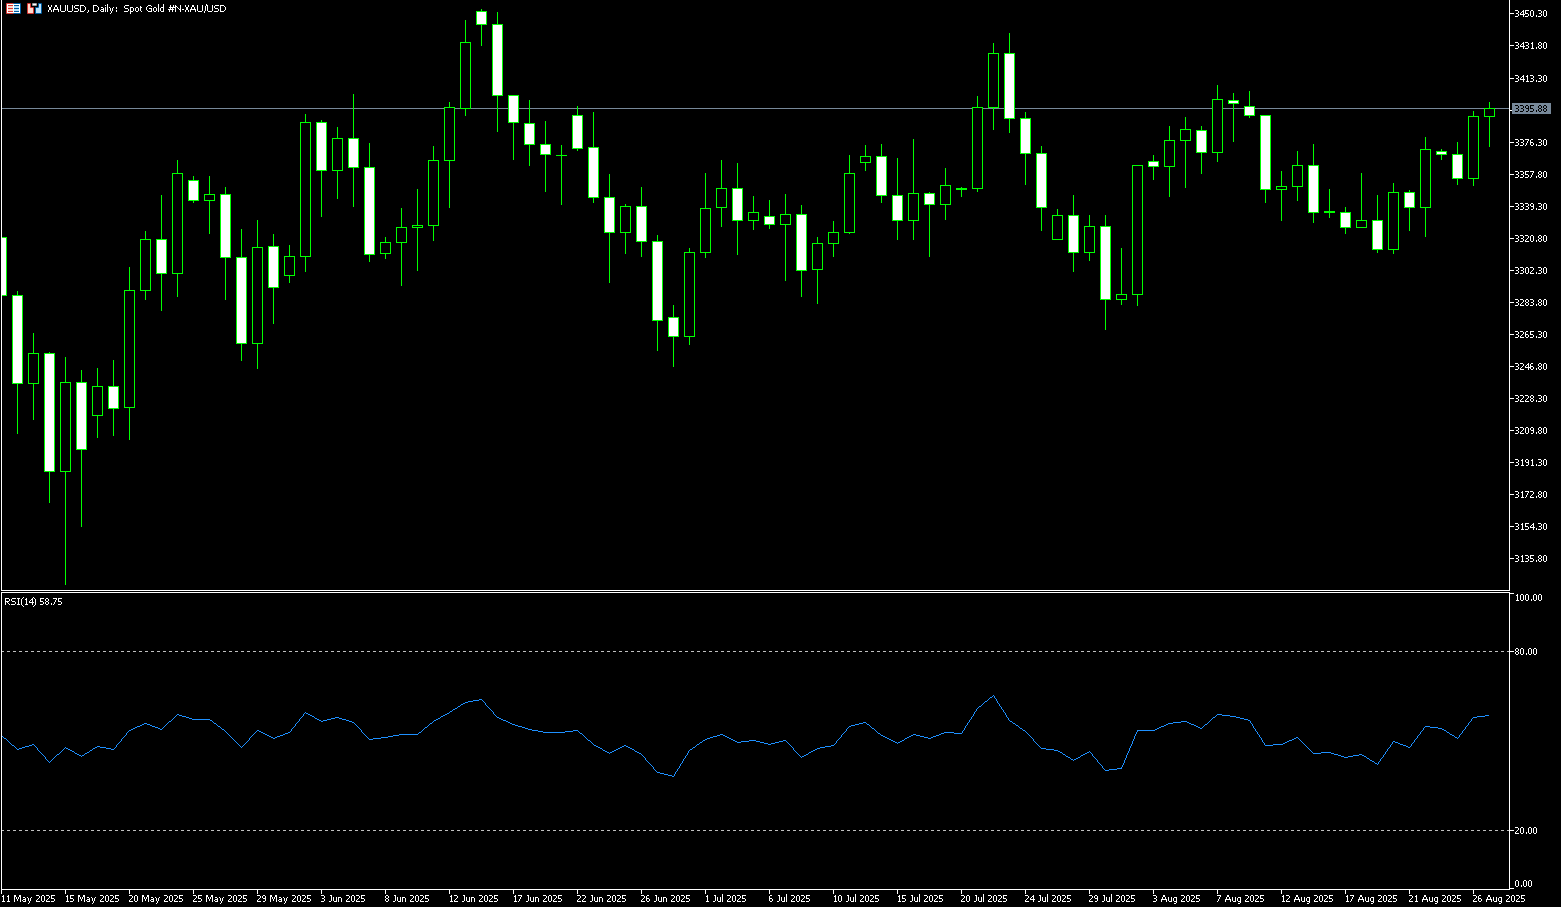
Gold fell to around $3,373 per ounce on Wednesday before rebounding to $3,395, near a two-week high, supported by its safety appeal amid concerns about the Federal Reserve's independence. President Trump signaled a legal challenge after attempting to remove Governor Lisa Cook, reigniting concerns about the Fed's autonomy and political pressure. Analysts warn that her removal could accelerate interest rate cuts, in line with Trump's push for easing policy. The market now sees a roughly 80% probability of a quarter-point rate hike in September. On the trade front, a US official indicated that the chances of reaching a deal with India before the deadline are slim, with tariffs on Indian goods potentially doubling to 50%, while Indonesia received exemptions on some commodities. Trump also threatened to impose high tariffs on Chinese rare earth exports, further escalating tensions between the two superpowers. In Europe, the French Prime Minister pushed forward with an austerity plan ahead of a confidence vote, raising political risks.
Expectations of a Fed rate cut and Trump's tariff rhetoric are likely to continue weakening the US dollar, boosting gold's appeal. However, the dollar's short-term upward momentum may pose some resistance to gold prices. On the daily chart, spot gold is currently trading within an ascending triangle pattern, fluctuating around $3,380/oz with gradually narrowing ranges, indicating consolidation at high levels, awaiting a directional breakout. After breaking through the middle line of the Bollinger Band last Friday, gold has been trading sideways around it, currently trading above $3,357, indicating that short-term bullish sentiment remains dominant. The MACD formed a golden cross, signaling bullish short-term momentum. The RSI, at 55.50, remains within overbought territory, suggesting a consolidation phase that is strong but not overheated. This suggests continued bullish momentum, but caution is advised against a potential pullback if a breakout fails. Key support levels include the Bollinger Band's middle line at $3,357, followed by the 50-day moving average at $3,346. Key resistance levels include the $3,400 round-figure mark and the upper Bollinger Band line at $3,412. A break below this level could see the $3,439 level (July 23 high).
Consider going long on gold at $3,390 today, with a stop-loss at $3,385 and a target of $3,420-3,426.
AUD/USD
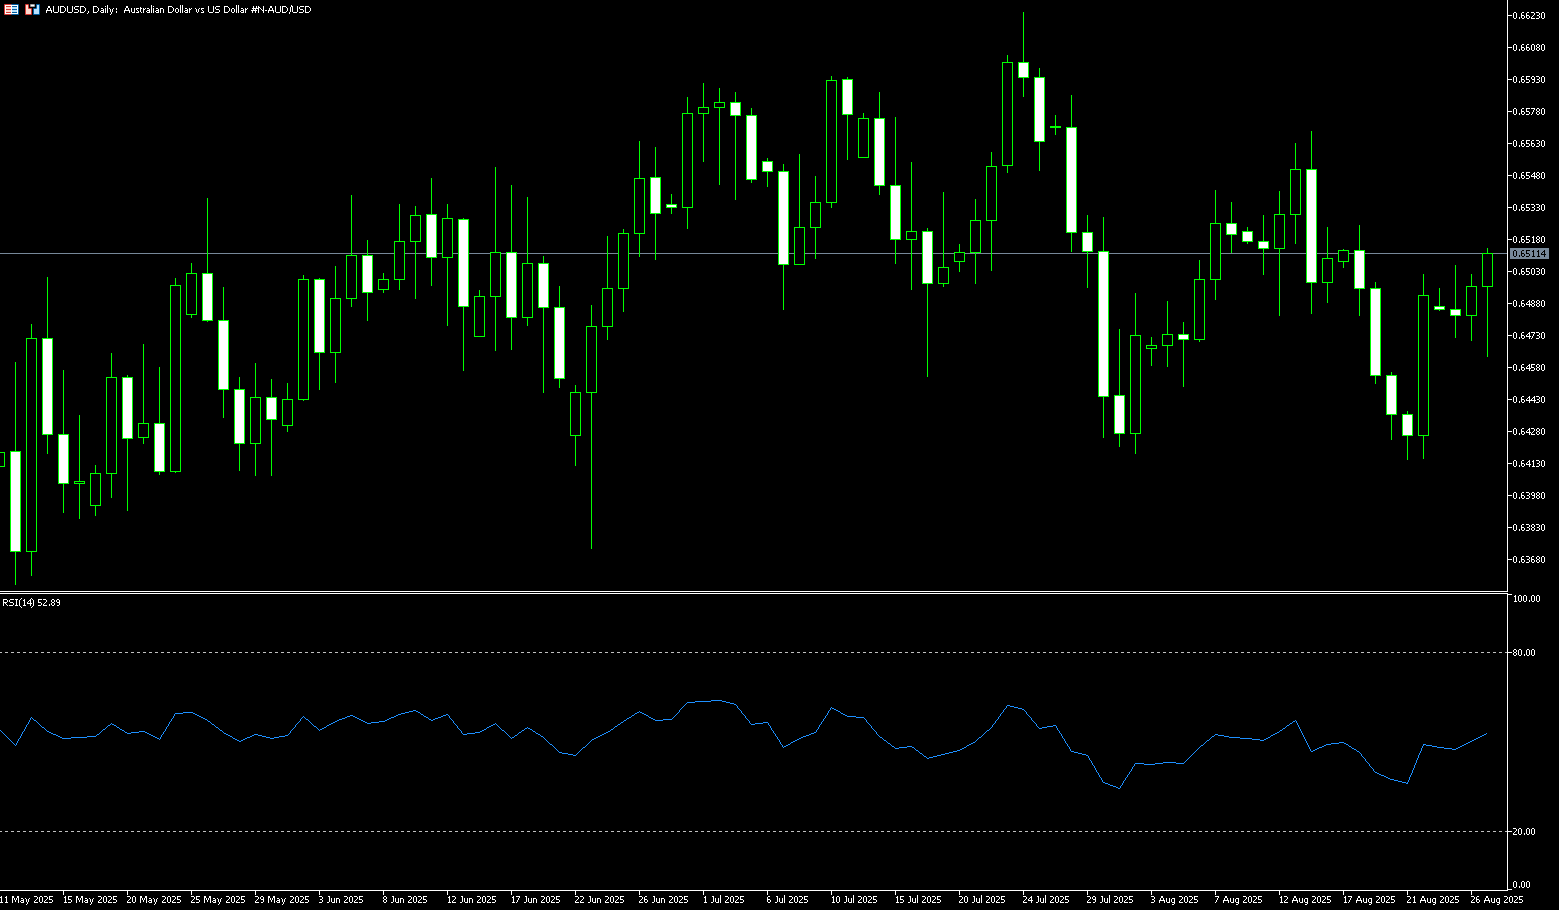
The Australian dollar came under pressure following the release of the monthly Consumer Price Index (CPI) on Wednesday. Downward pressure on the AUD/USD pair came as the US dollar recovered from the previous session's losses. The Australian Bureau of Statistics (ABS) reported a 2.8% year-on-year increase in the monthly Consumer Price Index in July, compared to a 1.9% increase in June. The market consensus was for a 2.3% increase for the same period. Meanwhile, Australia's second-quarter construction work completion rate improved to 3%, exceeding expectations of a 0.8% increase. Traders remained cautious after US President Donald Trump warned of 200% tariffs on Chinese goods if Beijing refused to provide magnets to the United States (US), according to Reuters. It is noteworthy that any changes in the Chinese economy could affect the Australian dollar, as China and Australia are close trading partners.
AUD/USD traded around 0.6500 on Wednesday. Technical analysis on the daily chart shows that the pair is trading above its 100-day simple moving average of 0.6446, indicating strengthening short-term price momentum. On the upside, a successful break above the psychological level of 0.6500 could support the pair to explore the area around 0.6553 (the upper Bollinger Band line) and the monthly high of 0.6568 reached on August 14. Further gains could lead the pair to test the nine-month high of 0.6625 recorded on July 24. Near-term support lies at the 100-day simple moving average of 0.6446. A break below these levels would weaken short- to medium-term price momentum and exert downward pressure on the pair, potentially leading back to the two-month low of 0.6415 recorded on August 22.
Consider a long AUD at 0.6490 today, with a stop-loss at 0.6480 and a target of 0.6550 or 0.6540.
GBP/USD
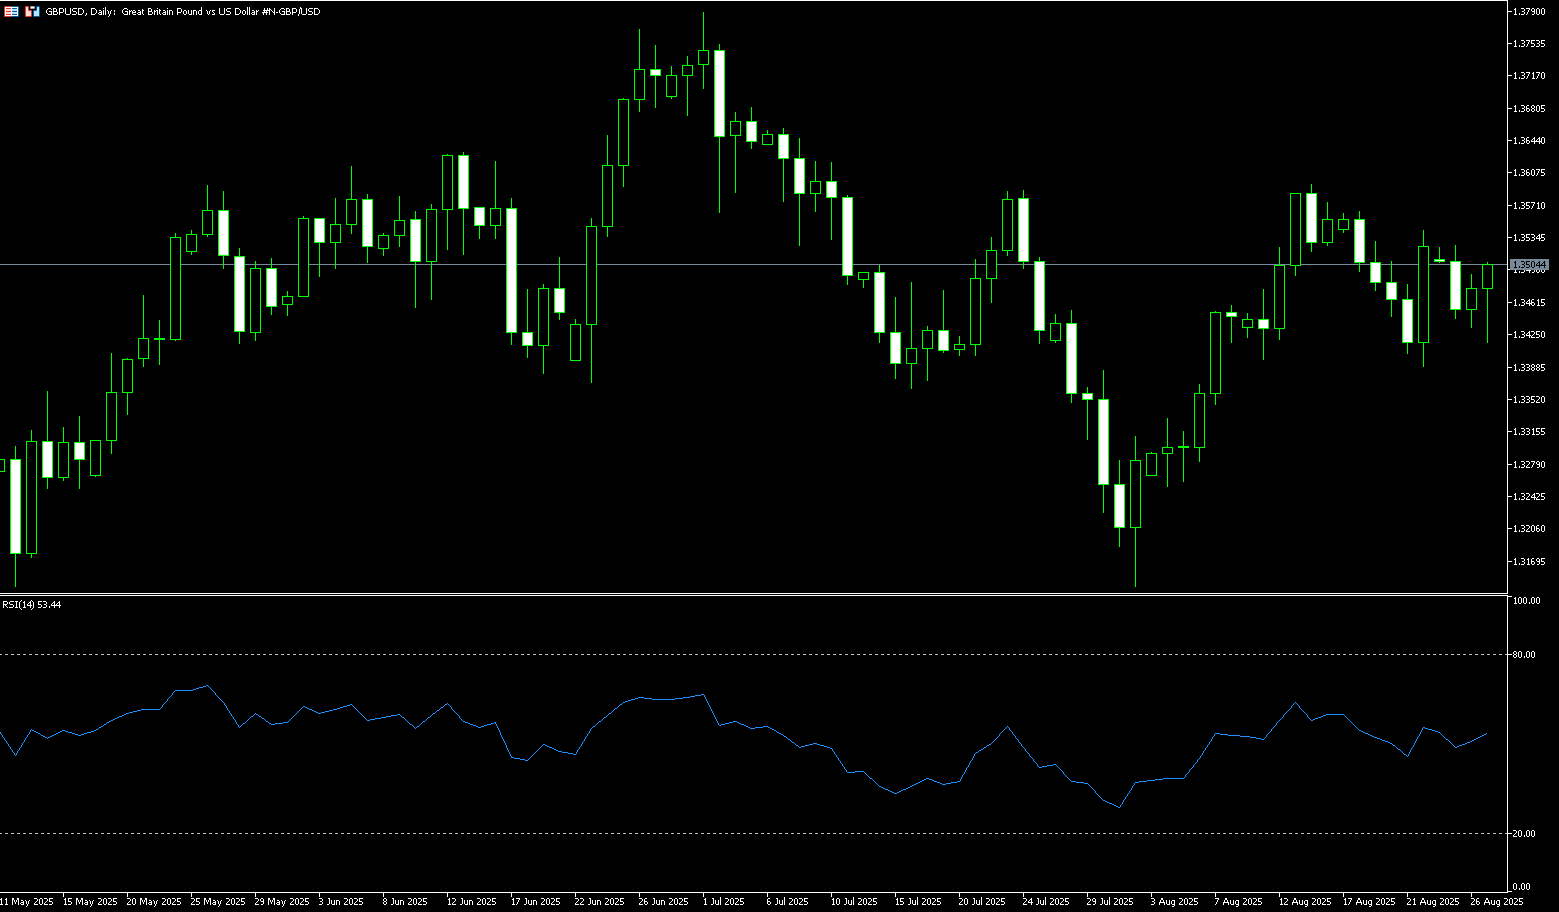
Wednesday's trading will be quiet; GBP/USD rose slightly earlier, trading around 1.3498. Meaningful economic data from both sides of the Atlantic is largely absent. Investors will be watching for further political headlines from the Trump administration as traders await the outcome of President Trump's Monday attempt to directly "fire" Federal Reserve Board member Dr. Lisa Cook. The midweek data lull will end on Thursday with the release of the latest US gross domestic product (GDP) growth data. Quarterly US GDP growth is expected to rise to an annualized 3.1%, but the key data point this week will be Friday's US Personal Consumption Expenditures (PCE) inflation data. PCE inflation is expected to edge higher again, and rising inflationary pressures will make it difficult for the Federal Reserve to continue its pace of rate cuts on September 17.
On the daily chart, GBP/USD is consolidating between approximately 1.3400 and 1.3600. Currently, traders appear to be in a "wait for clarity" mode, with the market pricing in the Fed's dovish tone and a weaker US dollar, providing support for the GBP's consolidation. Currently, the pair has found support above the key 105-day simple moving average of 1.3409 and 1.3400 (round number mark). A break below this level paves the way for 1.3345 (August 7 low). As long as the move above 1.3500 holds, the technical outlook remains constructive and could reignite resistance towards last week's high of 1.3544. A break above 1.3544 would target the August 14 high of 1.3594, followed by 1.3600.
Consider a long position on GBP at 1.3485 today, with a stop loss of 1.3470 and a target of 1.3540 or 1.3550.
USD/JPY
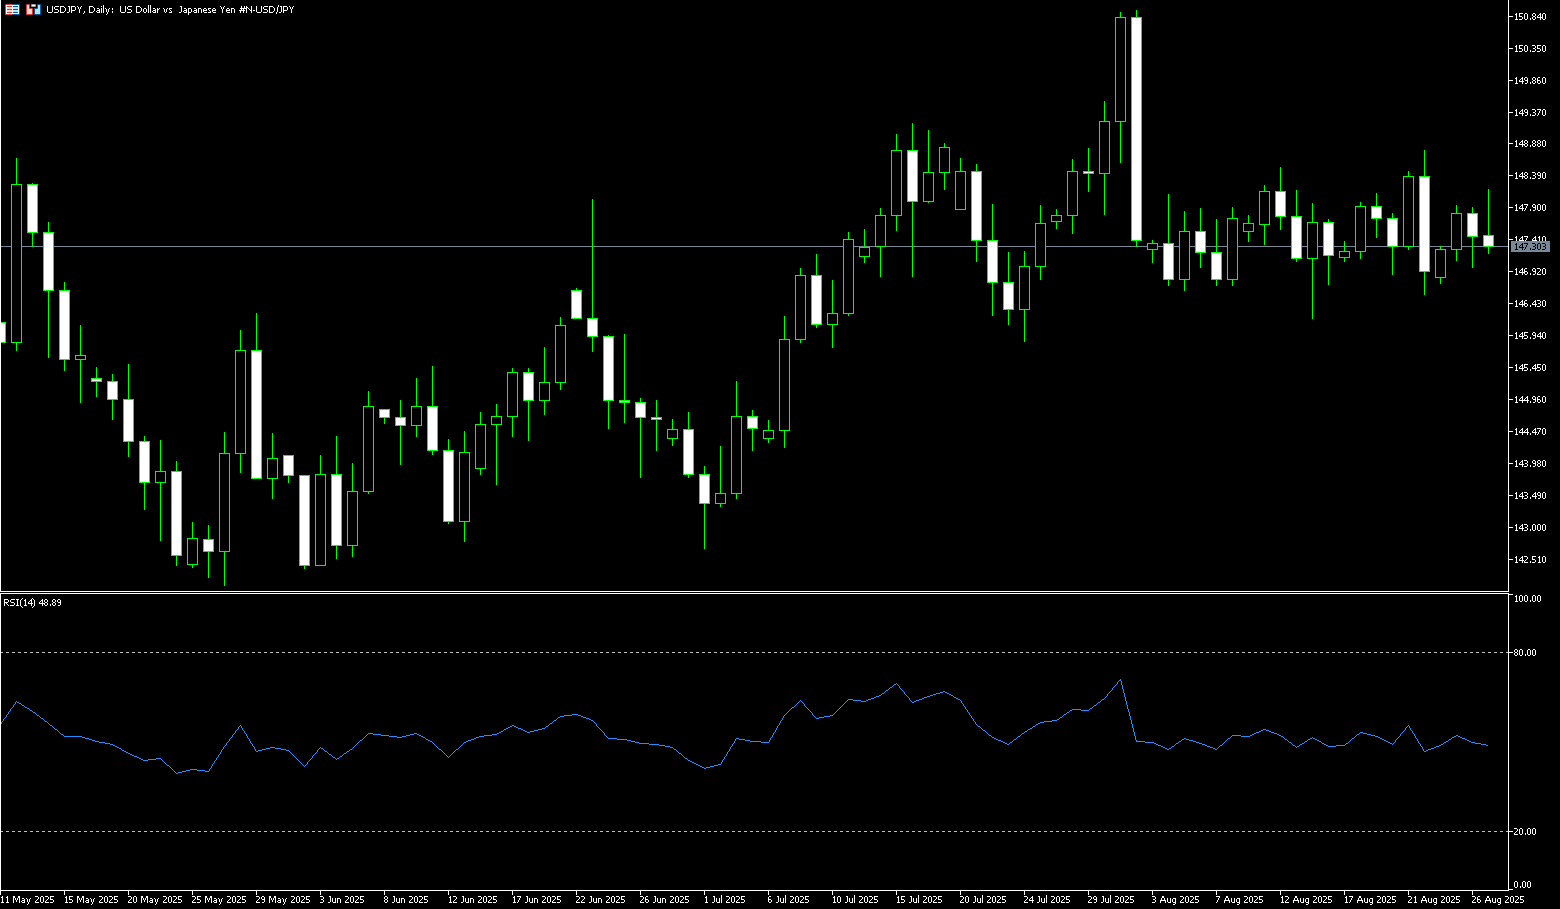
On Wednesday, the yen traded around 147.50 against the dollar, holding a sideways range as investors awaited a series of economic reports that could shape expectations for Bank of Japan policy. Data due later this week include industrial production, retail sales, and consumer confidence. Over the weekend, Bank of Japan Governor Kazuo Ueda stated that he expects Japanese wages to rise further as the labor market tightens, suggesting that conditions are maturing for another rate hike. At its July meeting, the Bank of Japan kept interest rates unchanged but raised its inflation forecast and issued a more optimistic economic outlook. Externally, market sentiment remained uncertain as President Trump's announcement of plans to fire Federal Reserve Governor Lisa Cook reignited concerns about the Fed's independence.
USD/JPY has remained above the psychological 148.00 level and is currently trading at 148.78 (the August 22 high). The market is closely watching the resistance level of 149.00 (200-day simple moving average), while support is forming around 146.00. On the daily chart, USD/JPY remains locked in neutral territory, ranging between the key support level of 146.00 and the key resistance level of 149.00. On the downside, the 147.00 round-number mark and the 146.96 (50-day moving average) area are closely watched, as a decisive breakthrough could open the door to a decline towards the 146.00 (round-number mark) and 145.48 (100-day simple moving average) areas. On the other hand, a sustained break above the 148.00 mark could see buyers re-targeting last week's high of 148.78. A break above this level could target the 200-day simple moving average of 149.00.
Consider shorting the US dollar at 147.65 today. Stop-loss: 147.90, target: 146.60, 146.40.
EUR/USD
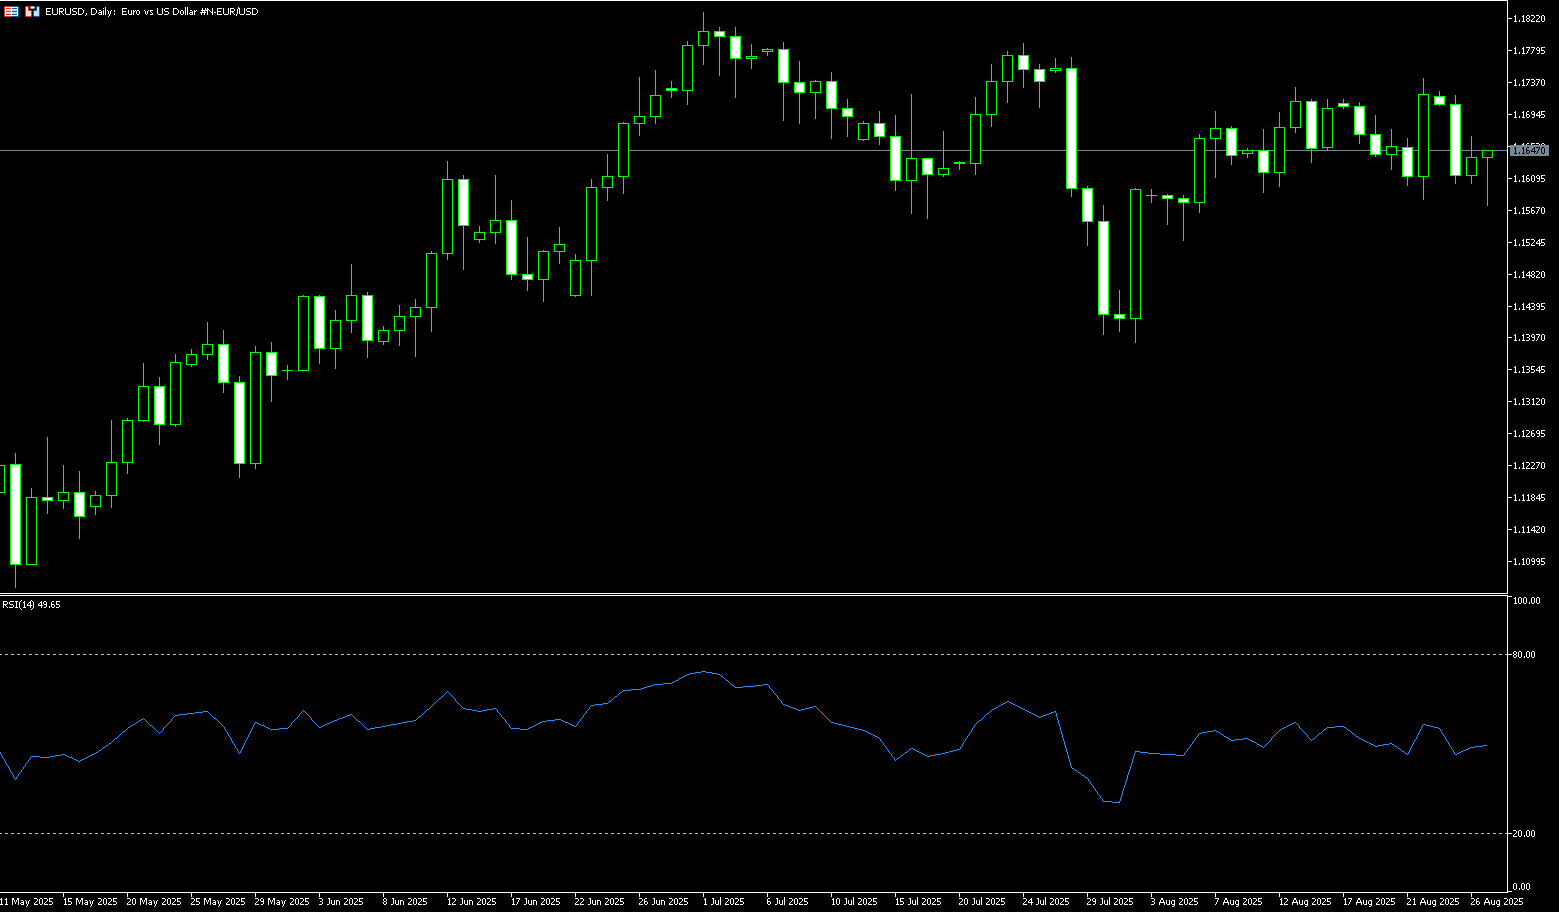
EUR/USD fell on Wednesday, testing the bottom of its three-week trading range. It recently traded back above 1.1600 after hitting 1.1580 during European trading. Market concerns about the collapse of the French government weighed on the euro on Tuesday, offsetting any dollar weakness stemming from US President Trump's attempts to influence the Federal Reserve. France was a key focus for European markets as Prime Minister François Bailleul's minority government failed to secure support in a confidence vote on September 8th to approve deep spending cuts. This could lead to a cabinet collapse and a resurgence of euroskepticism from opposition parties, a scenario that has spooked investors. In this context, the euro has failed to gain any significant support from the weak US dollar, despite the ongoing battle between Trump and the Fed.
EUR/USD's daily chart shows it remains above its flat 75-day simple moving average at 1.1562, reflecting a lack of directional interest among market participants. Meanwhile, the 14-day Relative Strength Index (RSI) is hovering near its 47-day midline, lacking directional strength. The weekly low of 1.1577 is an immediate support level, followed by the 75-day simple moving average at 1.1562. A break below the latter could encourage bears to test the 80-day simple moving average at 1.1537. On the other hand, the first resistance level lies at 1.1655 (the 9-day simple moving average). A break below this level would send EUR/USD directly towards the 1.1700 level.
Consider a long position on the euro at 1.1625 today, with a stop-loss at 1.1610 and targets at 1.1675 and 1.1685.
Disclaimer: The information contained herein (1) is proprietary to BCR and/or its content providers; (2) may not be copied or distributed; (3) is not warranted to be accurate, complete or timely; and, (4) does not constitute advice or a recommendation by BCR or its content providers in respect of the investment in financial instruments. Neither BCR or its content providers are responsible for any damages or losses arising from any use of this information. Past performance is no guarantee of future results.
Lebih Liputan


Pendedahan Risiko:Instrumen derivatif diniagakan di luar bursa dengan margin, yang bermakna ia membawa tahap risiko yang tinggi dan terdapat kemungkinan anda boleh kehilangan seluruh pelaburan anda. Produk-produk ini tidak sesuai untuk semua pelabur. Pastikan anda memahami sepenuhnya risiko dan pertimbangkan dengan teliti keadaan kewangan dan pengalaman dagangan anda sebelum berdagang. Cari nasihat kewangan bebas jika perlu sebelum membuka akaun dengan BCR.

 English
 简体中文
简体中文
 繁體中文
繁體中文
 Bahasa
Melayu
Bahasa
Melayu
 Tiếng
Việt
Tiếng
Việt
 ไทย
ไทย
 日本語
日本語
 한국어
한국어
 ភាសាខ្មែរ
 español