


0
US Dollar Index
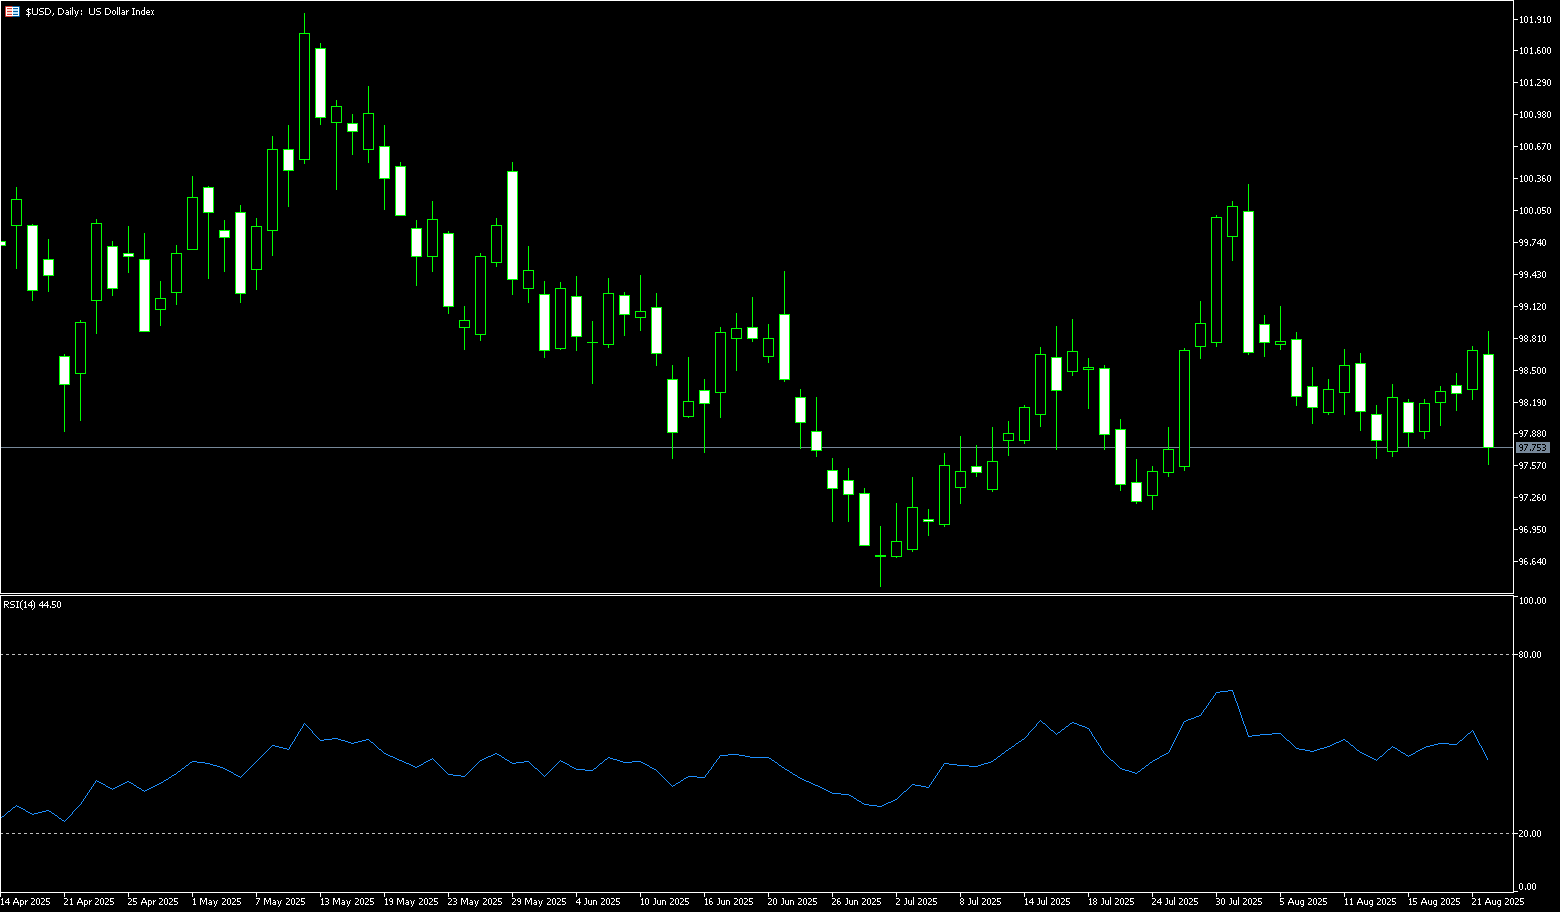
The US dollar index fell below 98 for the third consecutive week last week, dropping to a near one-month low of 97.56, after Federal Reserve Chairman Jerome Powell hinted at a possible rate cut in his speech at Jackson Hole. Powell noted that while unemployment remains low, risks to the labor market are rising and policy remains "restrictive," suggesting adjustments may be needed. He highlighted shifts in tax, trade, and immigration policies as factors reshaping the outlook. Markets reacted quickly, with futures pricing in a 91% probability of a 25 basis point rate cut in September, driving stocks and bonds higher. The dollar was little changed this week, following two consecutive periods of decline. Earlier, the dollar index briefly climbed above 98.80, near a two-week high. Federal Reserve Chairman Powell's remarks at the Jackson Hole central bank symposium reinforced market expectations for a September rate cut, with Powell's remarks being much more dovish than expected. The dollar is plummeting, the odds of a September rate cut are rising, and market participants are clearly preparing for more easing to come.
The US dollar index fell to a near one-month low of 97.56 last week. Federal Reserve Chairman Powell indicated the possibility of a rate cut at the September meeting but stopped short of committing to one. Following Powell's speech, the index traded around 97.70, marking a slight weekly decline. Technically, the US dollar index rebounded to a high of 98.83 last week, its highest level since August 6. The daily chart shows weakening technical momentum, with the 14-day relative strength index (RSI) falling to approximately 45.00. The average directional index (ADX) suggests a correction in the recent uptrend. Last Friday's close formed a bearish "penetration" pattern. If the US dollar index falls below 97.56 (last week's low), the next targets would be 97.19 (July 23 low) and 97.00 (round number). A break below these levels could lead to a test of 96.38 (July 1 low). Conversely, if it breaks above 98.00 (round mark) and 98.10 (9-day simple moving average), it could potentially target 98.75 (89-day simple moving average) and 99.00 (round mark).
Today, consider shorting the US Dollar Index at 97.85, with a stop-loss at 98.98 and targets at 97.40 and 97.30.
WTI Spot Crude Oil
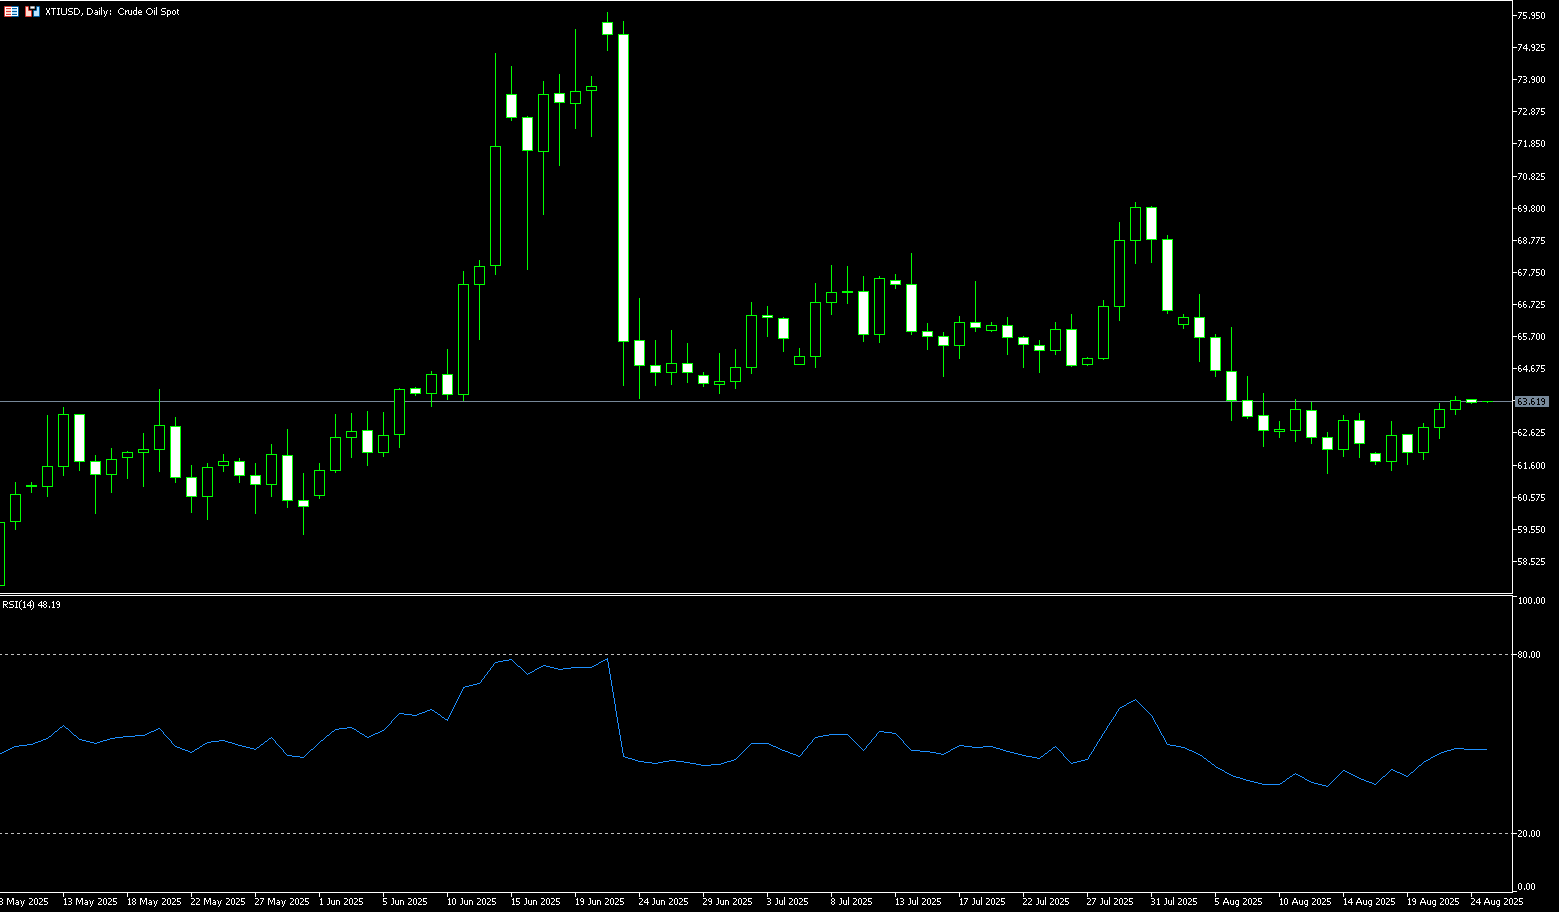
WTI crude oil rebounded after hitting a recent low of $61.35 early last week, rising above $63 per barrel, marking its third consecutive weekly gain. Supported by signs of strong US demand and uncertainty surrounding the Russia-Ukraine peace talks, the latest US inventory report showed the largest national draw since mid-June. While continued increases at Cushing indicate weak underlying demand, the larger decline is partially due to increased refinery runs and stronger exports. Meanwhile, investors are closely watching the Russia-Ukraine talks. Despite Washington's push for direct engagement, the Kremlin has remained silent. The United States has also increased pressure on India over its purchases of Russian crude oil, announcing a 25% tariff on Indian goods, effective August 27th. Oil accounts for nearly 35% of India's total imports. Traders are also awaiting Federal Reserve Chairman Powell's speech at Jackson Hole later today for clues on monetary policy that could impact global demand.
From a recent technical perspective, WTI crude oil prices have upward momentum in the short term. The daily MACD indicator, a technical momentum indicator, has narrowed its green bars, forming a golden cross below the zero axis. The 5-day (62.83) and 10-day (62.74) simple moving averages have turned upward below the price, forming a "golden cross" pattern. Oil prices are trading at the upper end of their recent trading range. The 20-day SMA at $64.41 is the first resistance level. A move to this level could support a recovery towards the 50.0% Fibonacci retracement level of $65.76 (from $54.78 to $76.74). A break below this level could lead to a test of the 200-day SMA at $67.20. On the other hand, if oil prices break below the support range of the 5-day SMA at $62.83 and the 10-day SMA at $62.74, further declines to $61.43 (last week's low) are possible, followed by a potential challenge of the psychologically important $60.00 level.
Consider going long on crude oil at $63.50 today. Stop-loss: $63.30. Target: $64.80, $65.00.
Spot Gold
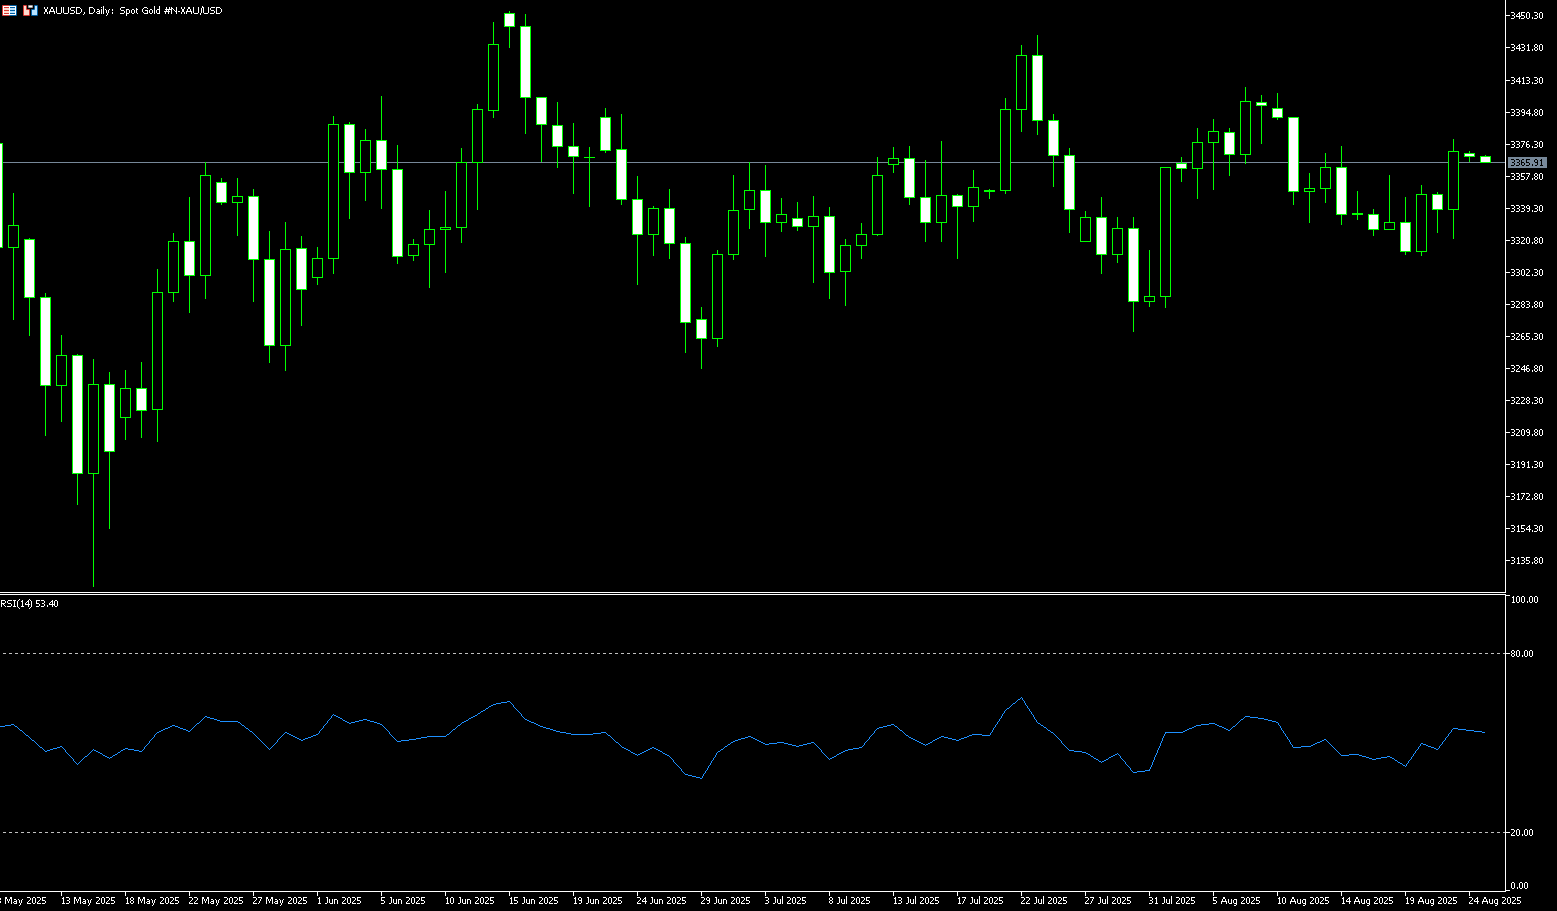
Gold rose to $3,378 per ounce, having traded in a narrow range since repeatedly testing the record high of $3,500 in April. This was amidst signs of a dovish shift by the Federal Reserve and strong demand for safe assets. Fed Chairman Powell noted that the central bank sees a shift in the balance between the risks of a slowing labor market and the persistent threat of inflation, citing revised payroll figures and rising unemployment rates. This may necessitate a monetary policy adjustment, which will translate into a 25 basis point rate cut at the upcoming September policy meeting. Furthermore, traders are beginning to bet on a total of three rate cuts this year, supporting prices for non-interest-bearing metals. Geopolitically, hopes for a Russia-Ukraine peace agreement have dimmed. Gold is expected to rise over 1.0% this week. Markets are focused on dimming hopes for a Russia-Ukraine peace agreement, with Moscow accusing Kyiv of rejecting the prospect of a "lasting and fair solution." For gold prices, the prospect of peace talks could significantly reduce safe-haven demand. However, the two sides face significant differences on legality and key issues, making the road to peace talks a long and arduous one. Any news of a setback in the negotiations could reignite risk aversion, providing support for gold prices.
Gold broke out above the top of its recent range of $3,310 to $3,360 last week, reaching a near two-week high of $3,378.90. Gold prices appear to be protecting their immediate downside ahead of the 50-day simple moving average at $3,346. Any follow-through selling pressure below the 100-day simple moving average at $3,316.30 or last week's low of $3,311.50 would be a key trigger for a gold short. A subsequent decline could drag gold prices below the psychologically important $3,300 level, heading towards strong horizontal support at the August 1 low of $3,282 and the 115-day simple moving average at $3,282.50. A break above the $3,282.00-$3,282.50 area would suggest a gold price peak and pave the way for further depreciation. This is suggested by slightly positive oscillators on the daily chart. The $3,400.00 (round-number mark) and $3,409.50 (August 8 high) areas now appear to be strong immediate resistance levels. A break above this level could trigger a new wave of covering gains, pushing gold prices towards the resistance zone of the July 23 high of $3,439.00. Momentum could extend further towards the previous all-time high of $3,500.
Consider a long position in gold at $3,368 today, with a stop-loss at $3,364 and targets at $3,390 or $3,395.
AUD/USD
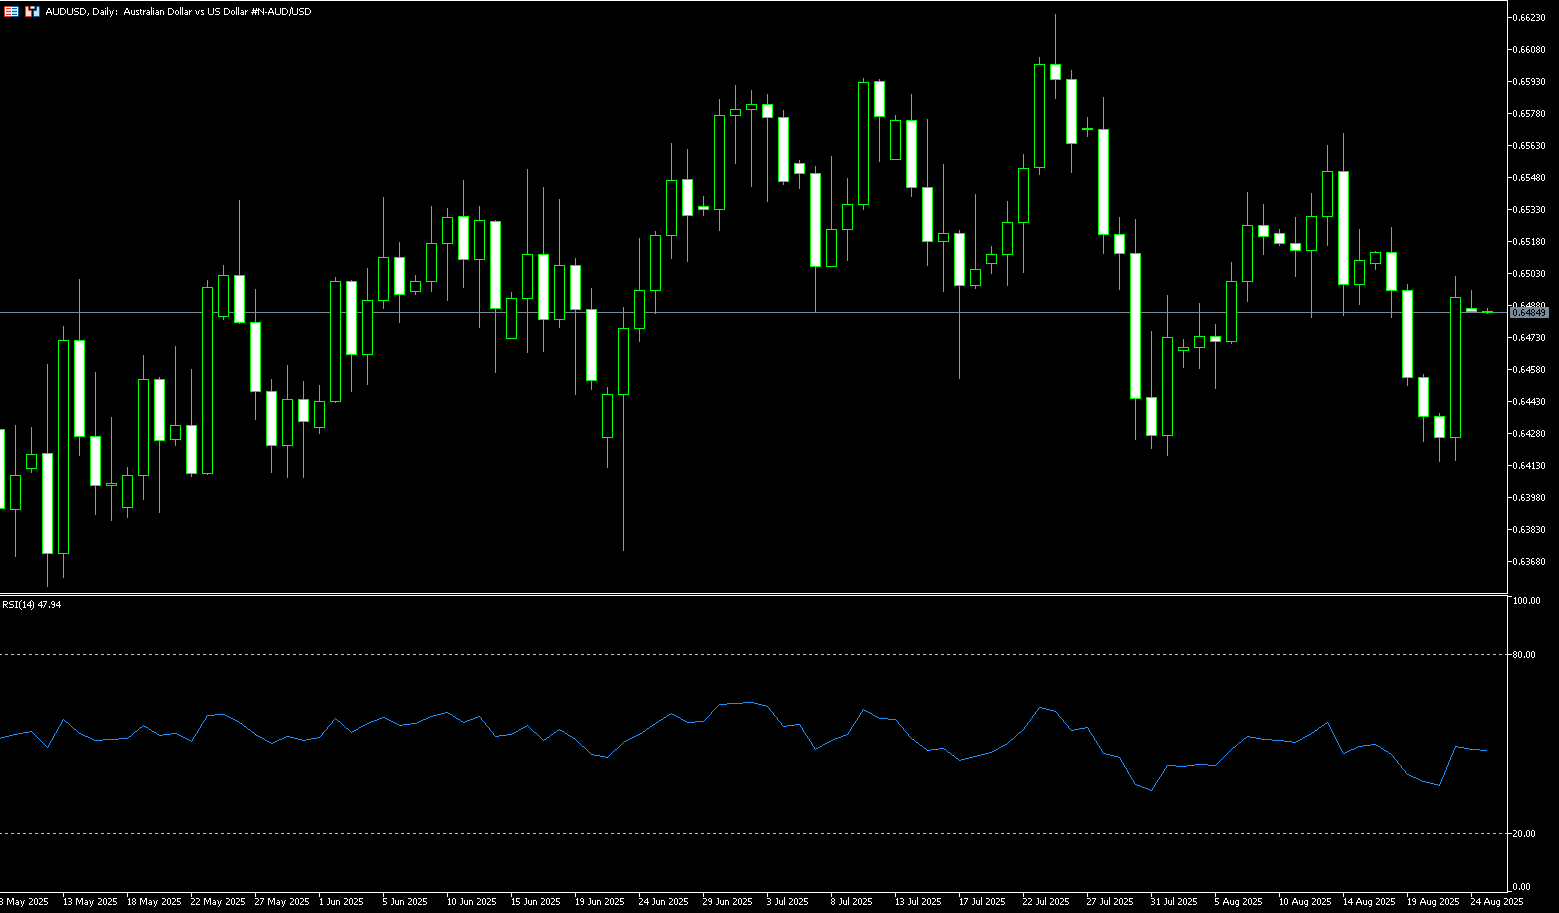
Following last week's bearish trend, AUD/USD reversed course in the US market before the weekend, climbing to around $0.6500, partially erasing last week's losses. At the annual Jackson Hole Symposium last Friday, Federal Reserve Chairman Jerome Powell announced the adoption of a new flexible inflation-targeting policy framework and the elimination of the "make-up" inflation strategy. Furthermore, Powell stated that downside risks to the labor market are rising, while noting that it's reasonable to expect the impact of tariffs on inflation to be short-lived. Following these comments, the US dollar came under heavy selling pressure, with the US dollar index falling to a weekly low of 97.56. Previously, weak US jobs data had fueled hopes for aggressive rate cuts, but cautious Fed comments and persistent inflation risks have led markets to anticipate a smaller September rate cut. Domestically, the market is almost fully pricing in another 25 basis point rate cut by the Reserve Bank of Australia to 3.10% in September. Meanwhile, a significant increase in business activity provided some support for the Australian dollar, with traders anticipating the Reserve Bank of Australia to remain cautious following last week's rate cut.
Over the weekend, the AUD/USD pair fell to a near two-month low of 0.6414 following Fed Chairman Powell's announcement to eliminate the "make-up" inflation strategy. Despite a sharp short-term climb to the 0.6500 level, the AUD/USD pair still recorded its second weekly decline. Technical analysis on the daily chart shows the pair currently trading near its 8-day and 89-day simple moving averages of 0.6479 and 0.6483, respectively. This has formed a bearish "death cross" pattern. Furthermore, the 14-day relative strength index (RSI) is below 50, indicating a persistent bearish market bias. On the downside, AUD/USD could target the two-month low of 0.6414 reached on August 21st, the 0.6400 (round number) area, followed by the 200-day simple moving average of 0.6383, and further towards the three-month low of 0.6372 reached on June 23rd. A break below this level would target the 0.6300 level. On the upside, AUD/USD could target key resistance at 0.6483, the 0.6500 level, followed by 0.6524 (last week's high). A break above these levels could improve short- and medium-term price momentum and push AUD/USD towards the monthly high of 0.6568 reached on August 14, as well as the psychologically important 0.6600 level.
Consider a long AUD at 0.6478 today, with a stop-loss at 0.6465 and targets at 0.6540 and 0.6550.
GBP/USD
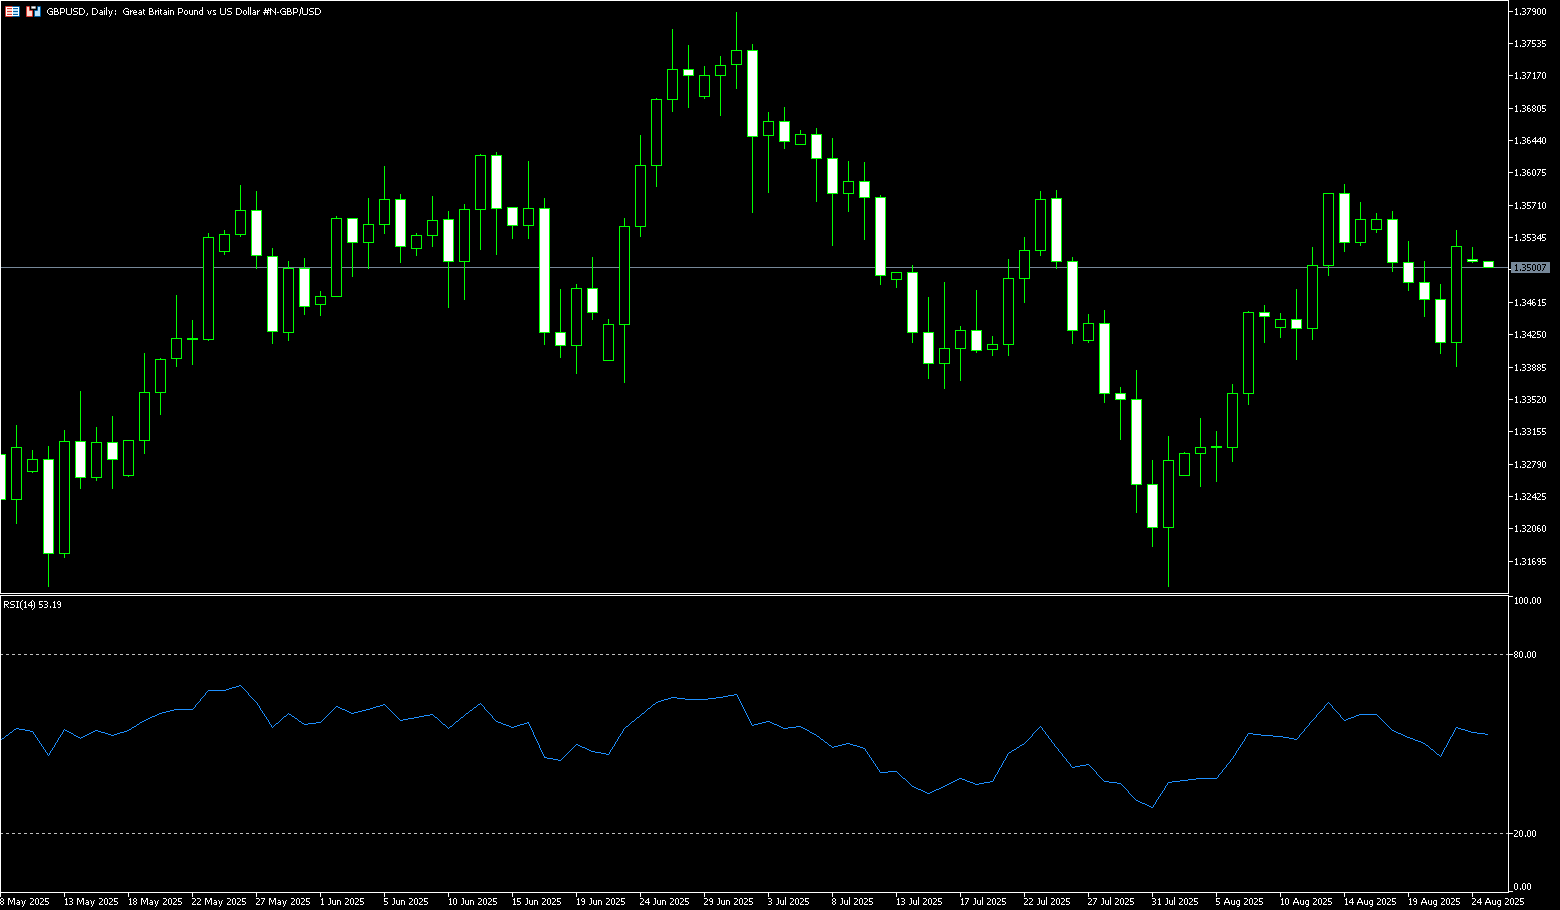
GBP/USD rallied over the weekend following Federal Reserve Chairman Powell's speech at the Jackson Hole Symposium. The pair traded above 1.3500 after Powell hinted that the Fed may be ready to resume its easing cycle in September. Fed Chairman Jerome Powell's comments raised the odds of a rate cut at the September meeting. Market participants have fully priced in a 50 basis point interest rate cut before the end of the year, while the probability of a 25 basis point cut in September has risen from 75% to 90%. The British pound hit a two-week low against the US dollar at around 1.3390 during last week's trading session. Meanwhile, the British pound remained broadly stable against major currencies on Friday following Thursday's release of the upbeat S&P Global Purchasing Managers' Index (PMI) for August. However, continued layoffs and private sector price hikes due to increased National Insurance (NI) costs will remain key concerns for Bank of England officials.
The daily chart shows that GBP/USD climbed sharply above 1.3500 before the weekend, reaching a near one-week high of 1.3544, opening the door to further gains. The 14-day Relative Strength Index (RSI) rose to 55.00, indicating that the GBP/USD exchange rate is in neutral to positive territory and bullish momentum is beginning to increase. A break above 1.3544 (last week's high) would target the August 14 high of 1.3594 and the psychologically important 1.3600 area. If bulls break above these levels, the next key resistance level will be 1.3788 (the July 1 high). Conversely, if the pair falls back below 1.3500, the next area of demand will be the 89-day simple moving average at 1.3456. A break below this level would open the door to a test of the 1.3400 round-figure mark, followed by a further test of the August 7 low of 1.3345.
Consider going long on the British pound at 1.3510 today, with a stop-loss at 1.3500 and targets at 1.3570 and 1.3580.
USD/JPY
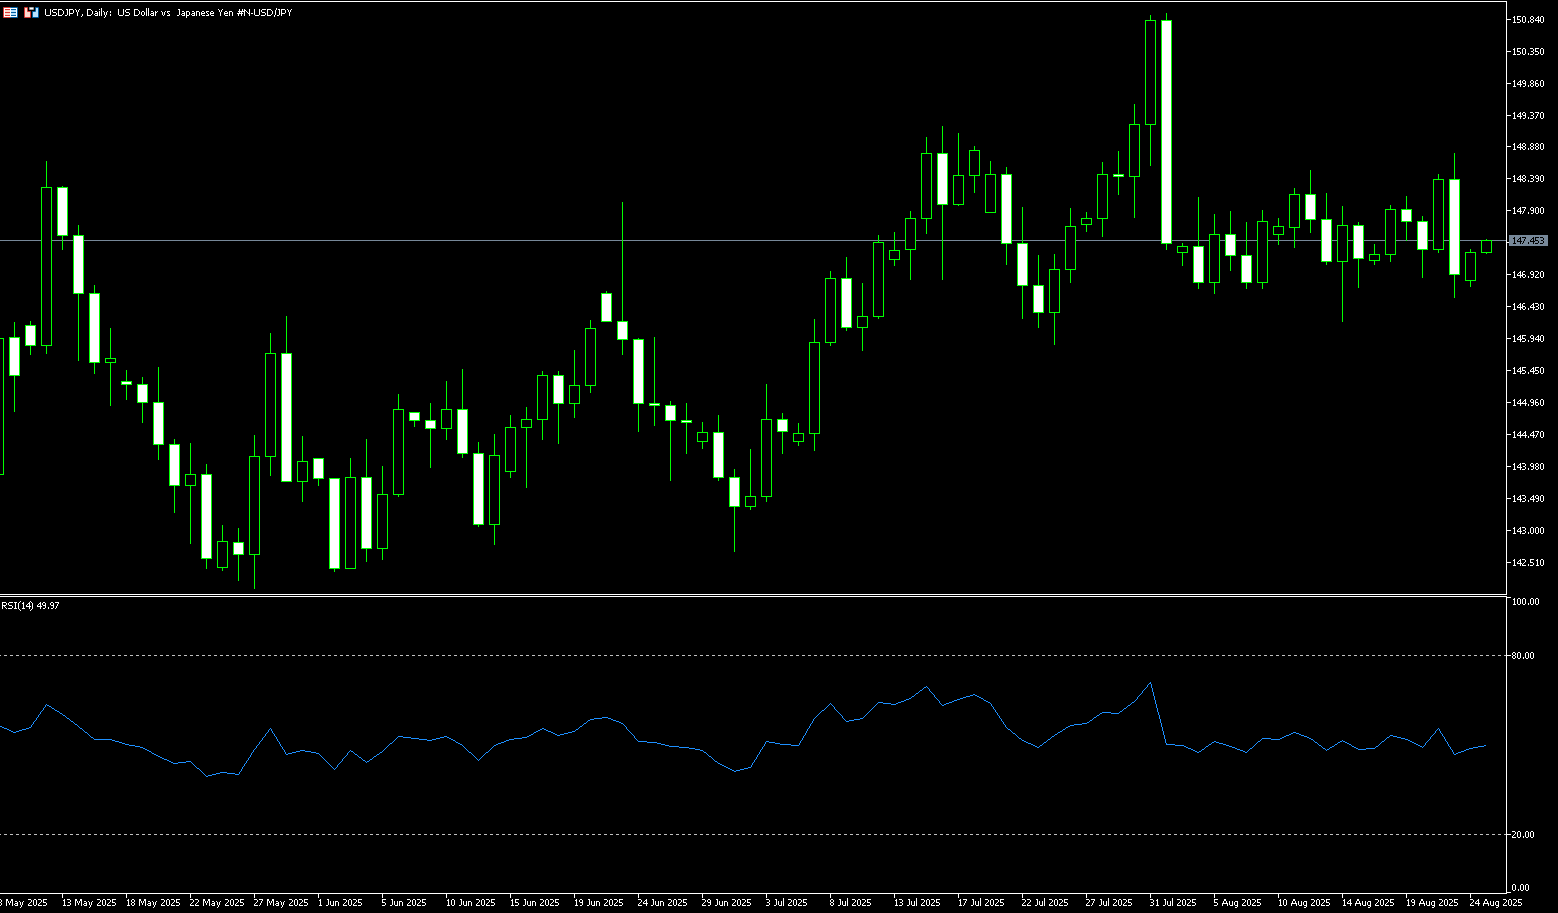
The USD/JPY pair experienced a period of rapid growth last week, weakening to a one-week low of around 146.58 before reaching a high of 148.72, its highest level in three weeks. The pair fell slightly by 0.18% for the week. This pullback marked a reversal of the pair's three-week strength as investors closed out their dollar positions following cautious remarks from Federal Reserve Chairman Powell at the Jackson Hole symposium. Powell's Jackson Hole speech fueled speculation that the Fed was preparing to recalibrate monetary policy, as he acknowledged upside risks to employment and noted the uncertainty surrounding higher tariffs. While he did not commit to action in September, his balanced tone prompted a significant increase in market expectations for a rate cut, leading to a drop in government bond yields and a broad sell-off in the dollar. At its July meeting, the Bank of Japan raised its inflation forecasts and indicated a willingness to raise interest rates before the end of the year. Despite this, Governor Kazuo Ueda maintained a cautious stance, emphasizing that "underlying inflation" has yet to stabilize in line with the 2% target. The yen also faced external pressure from a stronger US dollar, as markets worried that Federal Reserve Chairman Jerome Powell might oppose expectations of a near-term rate cut in his speech at Jackson Hole.
From a technical perspective, a breakout above the 147.00 level for USD/JPY is seen as a key trigger for USD/JPY bulls. The subsequent rise and positive oscillators on the daily chart suggest that the path of least resistance for the spot price remains upward. Therefore, some follow-through strength towards a test of the 148.00 round-figure mark, currently at 148.00, and the 25-day simple moving average at 147.73, appears a distinct possibility. Some follow-through buying should lead the pair to another attempt to reclaim the psychological 150.00 level. A break below this level would target 150.92, the August 1 high. On the other hand, any corrective pullback could attract new buyers and find good support around 146.87, last week's low. Following closely behind are horizontal supports in the 146.00 (round-number mark) and 145.97 (115-day simple moving average) areas. Below this support, USD/JPY could eventually fall to the 145.47 (100-day simple moving average). A break below the latter would negate the positive outlook and shift the short-term bias toward bearish traders.
Consider shorting the USD at 147.20 today. Stop-loss: 147.50, target: 146.30
EUR/USD
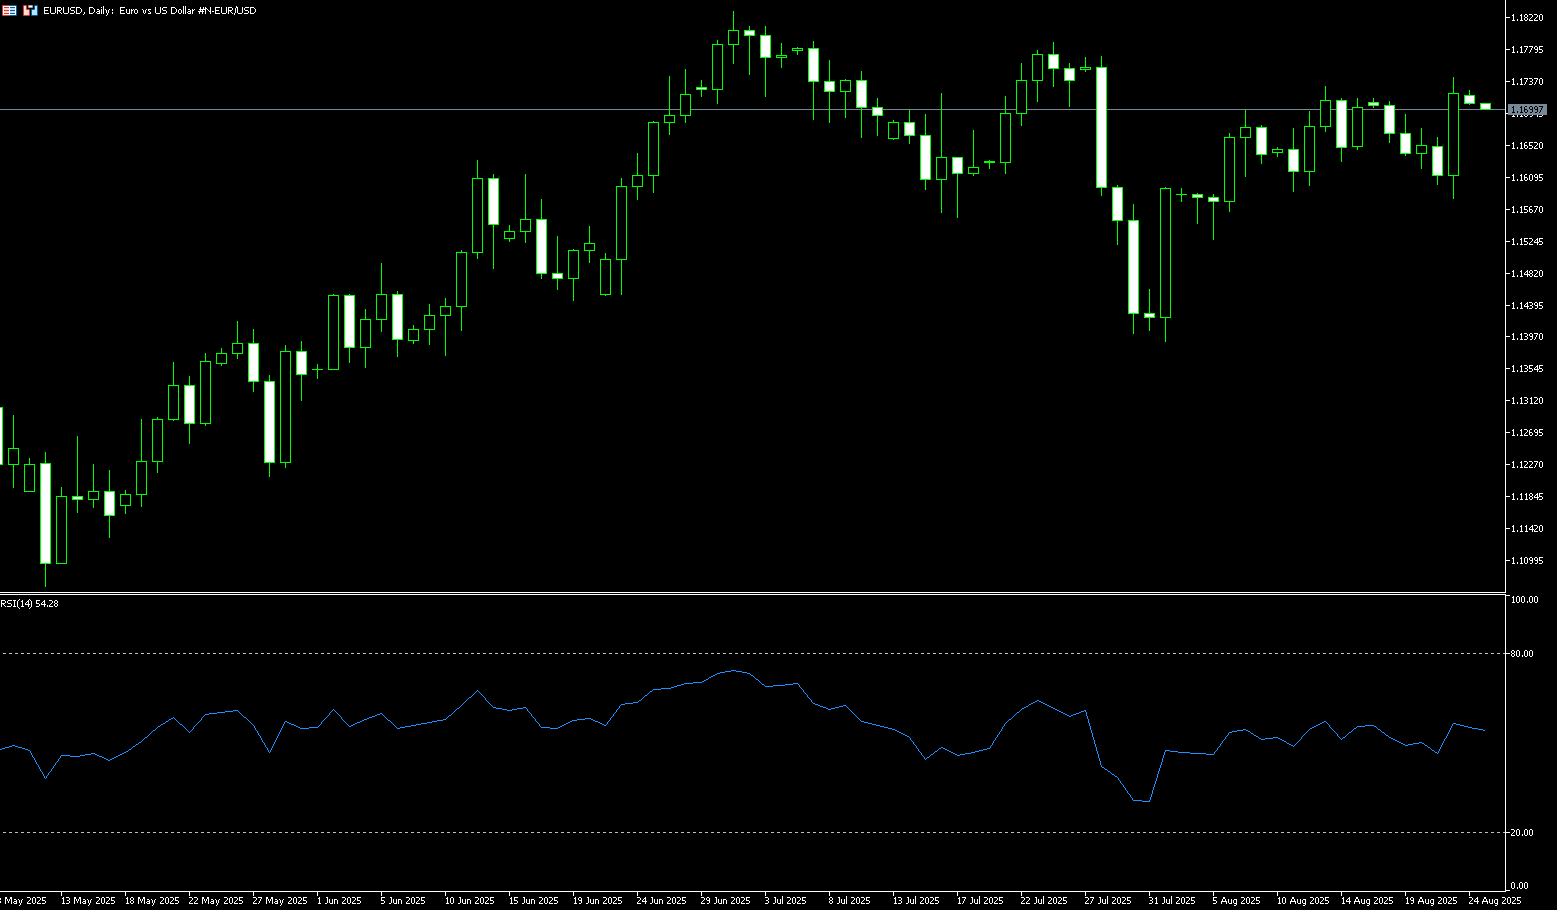
The euro surged in pre-weekend trading after Federal Reserve Chairman Jerome Powell struck a dovish tone in his Jackson Hole speech, raising the possibility of an easing cycle. Currently trading at 1.1718, the pair has gained for the third consecutive week. Market participants are beginning to anticipate a September rate cut by the Fed, with Powell stating, "The stability of the unemployment rate and other labor market indicators allows us to proceed cautiously as we consider changes in the stance of policy." Despite this abrupt shift, the outcome of the September meeting remains uncertain. Two inflation reports are due before the monetary policy decision—July's core personal consumption expenditures (PCE) price index and August's consumer price index (CPI)—as well as August's non-farm payroll data. Meanwhile, new insights into the EU-US trade deal suggest that most European goods will be subject to a 15% tariff, although autos, pharmaceuticals, and chips may be spared the higher sectoral tariffs threatened by the US. The euro has risen 11% against the dollar this year as EU countries signal they will increase spending to stimulate industry, infrastructure, and defense, while uncertain US economic policies and fiscal pressures have triggered a sell-off against the greenback.
EUR/USD's uptrend resumed before the weekend, reaching a higher high of 1.1742, raising hopes for a move towards 1.1800. The 14-day relative strength index (RSI) on the daily chart shows a bullish trend, rising and poised to surpass its latest high. Earlier, EUR/USD briefly broke below the key psychological level of 1.1600 to 1.1583. Currently, the 50% Fibonacci retracement level of the August 1 to 13 rally at 1.1560 may offer some support. However, the 1.1520-1.1530 area, representing the confluence of the August 5 low and the 61.8% Fibonacci retracement level of the same period, appears to be a more solid target. On the other hand, the pair faces initial resistance at 1.1742 (last week's high), followed by 1.1800 (a psychological level). If broken through, the next target would be the year-to-date high of 1.1830.
Today, you can consider going long on EUR at 1.1705, stop loss: 1.1690, target: 1.1760; 1.1770
Disclaimer: The information contained herein (1) is proprietary to BCR and/or its content providers; (2) may not be copied or distributed; (3) is not warranted to be accurate, complete or timely; and, (4) does not constitute advice or a recommendation by BCR or its content providers in respect of the investment in financial instruments. Neither BCR or its content providers are responsible for any damages or losses arising from any use of this information. Past performance is no guarantee of future results.
Lebih Liputan


Pendedahan Risiko:Instrumen derivatif diniagakan di luar bursa dengan margin, yang bermakna ia membawa tahap risiko yang tinggi dan terdapat kemungkinan anda boleh kehilangan seluruh pelaburan anda. Produk-produk ini tidak sesuai untuk semua pelabur. Pastikan anda memahami sepenuhnya risiko dan pertimbangkan dengan teliti keadaan kewangan dan pengalaman dagangan anda sebelum berdagang. Cari nasihat kewangan bebas jika perlu sebelum membuka akaun dengan BCR.

 English
 简体中文
简体中文
 繁體中文
繁體中文
 Bahasa
Melayu
Bahasa
Melayu
 Tiếng
Việt
Tiếng
Việt
 ไทย
ไทย
 日本語
日本語
 한국어
한국어
 ភាសាខ្មែរ
 español