


0
Currency & Commodity Analysis:
US Dollar Index
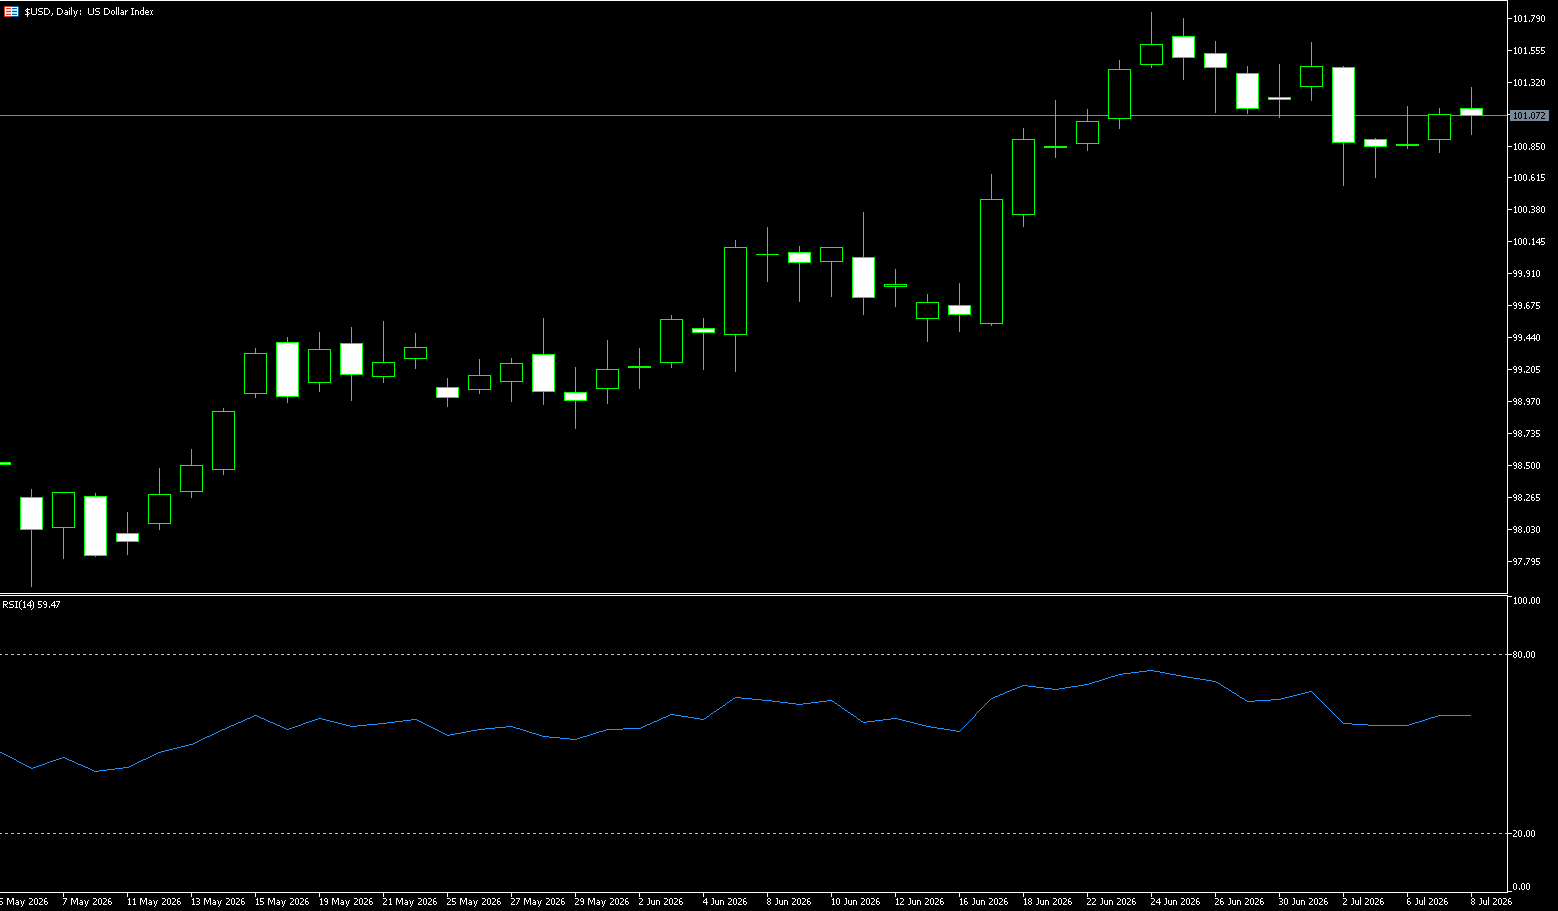
The US dollar index remained above 101 on Wednesday, after rising in the previous session, supported by a new round of US airstrikes against Iran, fueled by renewed safe-haven demand following recent attacks on ships transiting the Strait of Hormuz. The latest escalation threatens the interim peace agreement between the US and Iran to end the war, pushing up oil prices, exacerbating inflation concerns, and increasing the prospect of interest rate hikes. Meanwhile, investors await the minutes of the Federal Reserve's June meeting for further clues about the policy outlook, after the central bank adopted a more hawkish tone at its June policy meeting. The market now prices a roughly 50% probability of a Fed rate hike in September, up from about 46% the previous day. Furthermore, Tuesday's data showed that the US trade deficit widened to $77.6 billion in May, the largest since March 2025.
The US dollar index remains very strong and is likely to remain so for a considerable period. From a debt repayment perspective, the strength of the dollar is influenced by the relationship between GDP growth and the 10-year Treasury yield. If the US can maintain GDP growth and keep the 10-year Treasury yield low, then from a debt repayment perspective, there is no way to short the dollar. The current turning point for the dollar index may be more of a geopolitical or stock market turning point. According to the daily chart, structurally, 101.80 (the high on June 24th) is a strong short-term resistance level; a break below this level would target 102.00 (a psychological level). The 25-day moving average at 100.62 is a key defensive level for the bulls. If this support holds, after a period of consolidation at higher levels, there is potential for another test of the previous high; however, a decisive break below the 25-day moving average at 100.62 would initiate a phase of correction, with the next support level at the psychological level of 100.
Today, consider shorting the US Dollar Index at 101.15, with a stop-loss at 101.25 and targets at 100.70 and 100.60.
WTI Crude Oil
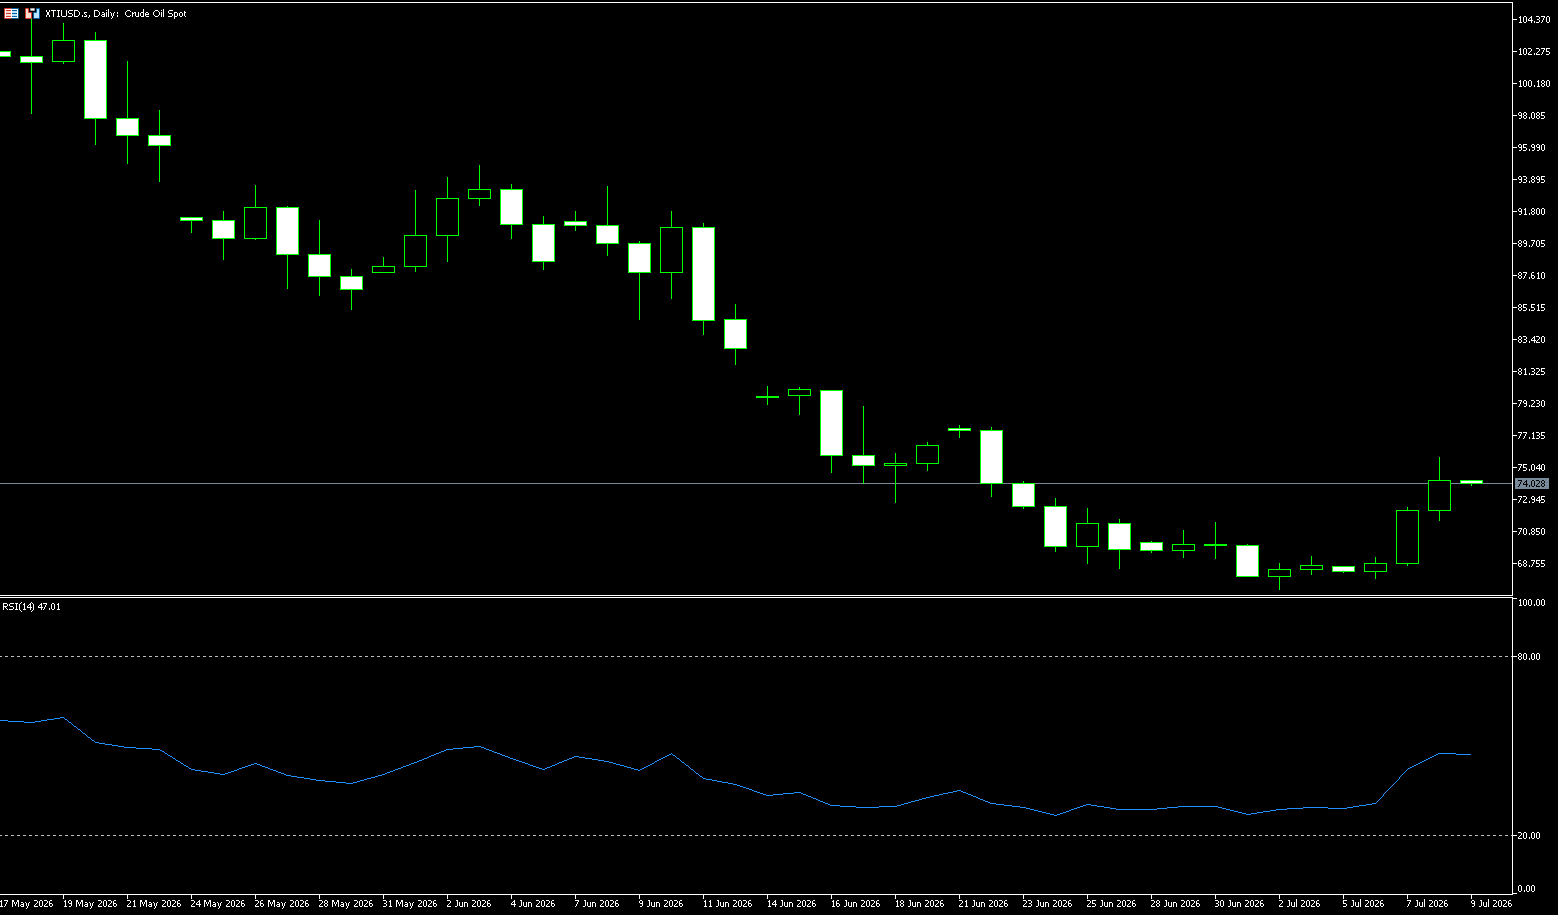
On Wednesday, crude oil prices rose as much as 7% to $75.70 a barrel as escalating tensions in the Middle East fueled concerns about further supply disruptions. President Trump stated that, for him, the ceasefire was over and threatened additional strikes and new sanctions against Iran. Yesterday, the US revoked a waiver allowing Iran to sell crude oil after attacks on ships transiting the Strait of Hormuz. These actions followed a series of recent attacks on ships transiting the Strait of Hormuz. Tehran also stated that it had struck 85 US military bases in Bahrain and Kuwait in response to what it called US violations of the ceasefire agreement. The renewed conflict has increased the likelihood of further disruptions to global energy supplies, making shipowners and regional producers reluctant to use this vital waterway. This escalation contrasts sharply with earlier expectations of a supply glut, following OPEC+'s increase in production quotas and Middle Eastern producers' ramp-up output.
If the US launches cross-border military action in response to the series of attacks, the US-Iran standoff will escalate rapidly. The market will then reprice geopolitical risks and supply gaps, potentially leading to a rapid rebound in oil prices, which have been suppressed in the short term. The market's focus will subsequently be on two key signals: the US military response and ship traffic data in the Strait of Hormuz. Technically, WTI crude oil's break below the key $70 level did not trigger panic selling and further declines. Oil prices are currently consolidating and choosing a direction. A breakout in either direction could trigger stop-loss orders or aggressive buying from outside investors. However, given the ongoing attacks on merchant ships in the Strait of Hormuz, the probability of an upward move is higher. Therefore, the key resistance level to watch is $75.73 (Wednesday's deducted point), with a break above this level targeting $76.65 (the 25-day moving average). On the downside, watch $73.04 (June 24 high) and $71.60 (Wednesday low).
Consider going long on crude oil today at $74.38, with a stop loss at $74.20 and targets of $76.00 and $76.50.
Spot Gold
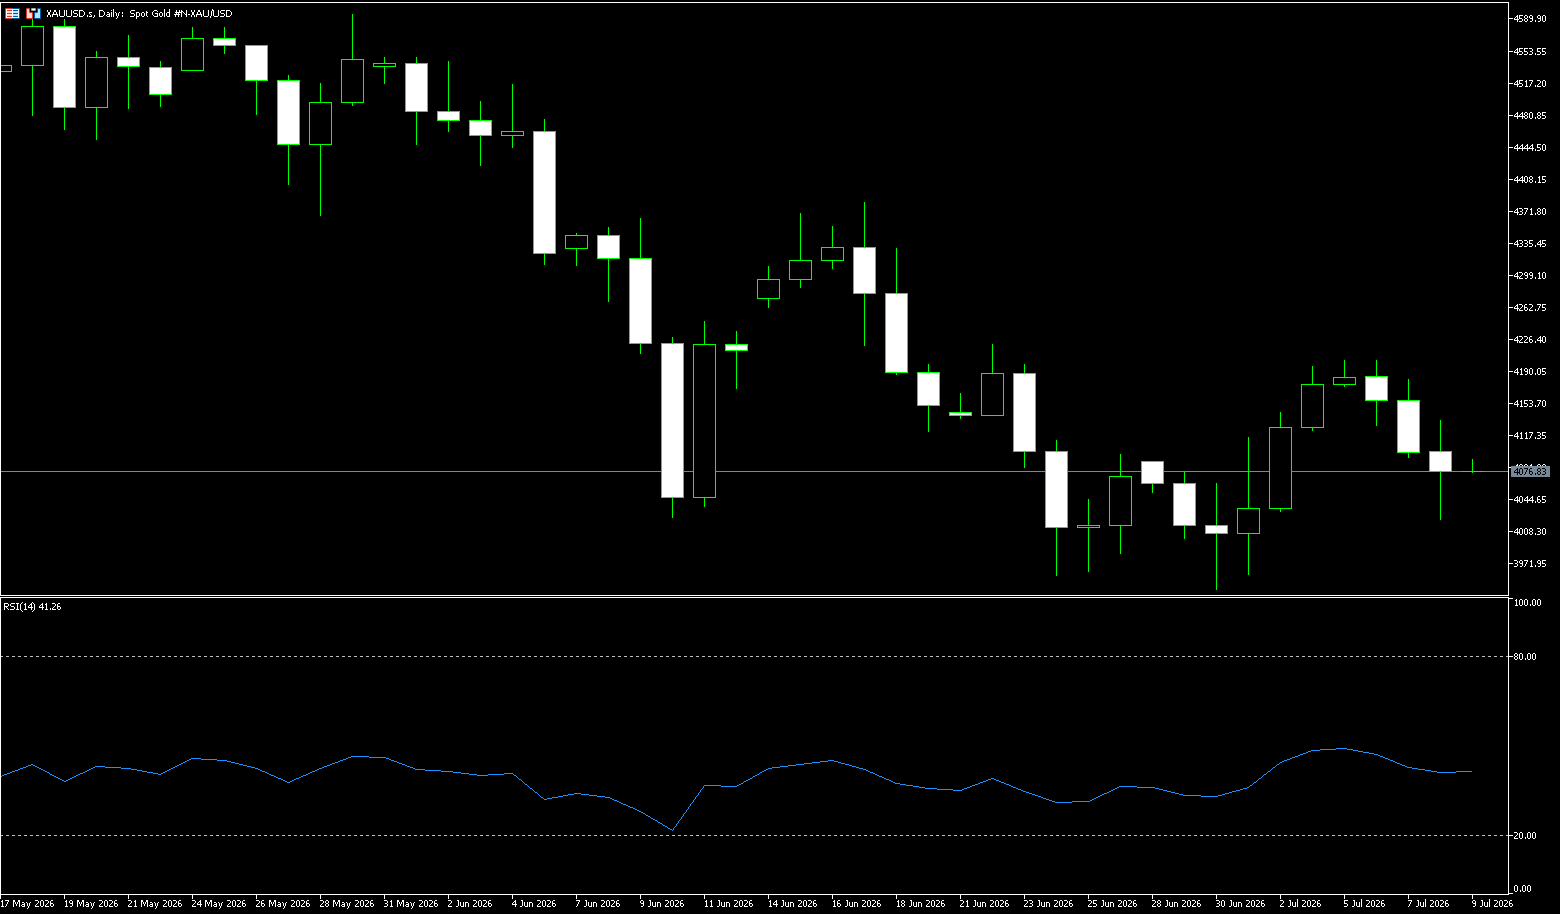
On Wednesday, spot gold traded near $4,100/oz, and may test the $4,050/oz level during the day. Superficially, the attack on ships near the Strait of Hormuz should have strengthened safe-haven buying, but the gold market did not show a one-sided upward surge; instead, it fell back for the second day. This indicates that the dominant variable in current gold trading is not simply geopolitical risk, but rather the secondary transmission of geopolitical risk to energy prices, inflation expectations, Treasury yields, and the US dollar index. This is also the reason for the complex reaction of gold in this round; conflict risk does not lack a premium, but rather the premium is swallowed up by the higher opportunity cost of holding. For traders, the current gold market is not driven by a traditional single-factor safe-haven demand, but rather by a rebalancing effect of safe-haven demand, oil prices, inflation, interest rates, and the US dollar. Gold typically benefits from tail risks, but when risk events are concentrated in the energy transportation chain, the market is likely to trade first on rising oil prices, rising inflation, and persistently high interest rates, rather than unconditionally buying gold.
Looking at the daily chart, spot gold previously rebounded from around $3.943.65 per ounce, reaching a high of $4,202.09 per ounce, but the price is still trading below the Bollinger Band middle line of around $4,142 per ounce. The Bollinger Band upper line is at $4,333 per ounce, and the lower line is at $3,950 per ounce, indicating that the medium-term trading range remains wide, but the short-term rebound has not yet reclaimed the Bollinger Band middle line of $4,142. More importantly, the area around $4,200 per ounce has formed a short-term psychological resistance level, and the daily candlestick pattern shows insufficient continuation above this area. MACD data shows that downward momentum has subsided, but trend indicators remain in negative territory, rather than indicating a resumption of the bullish trend. Therefore, frequent struggles around $4.130 per ounce suggest the market is assessing whether there is room for repricing after the previous safe-haven premium was retraced. If it cannot effectively reclaim the $4,180-$4,200 per ounce range, the technical rebound is likely to be interpreted as a correction after the decline. On the downside, significant support lies at $4.032, near the July 2nd low, and the psychological support level of $4,000. Further price declines at these levels will likely encounter strong buying demand.
Today, consider going long on gold at $4,072, with a stop-loss at $4,065 and targets of $4,120 and $4,130.
AUD/USD
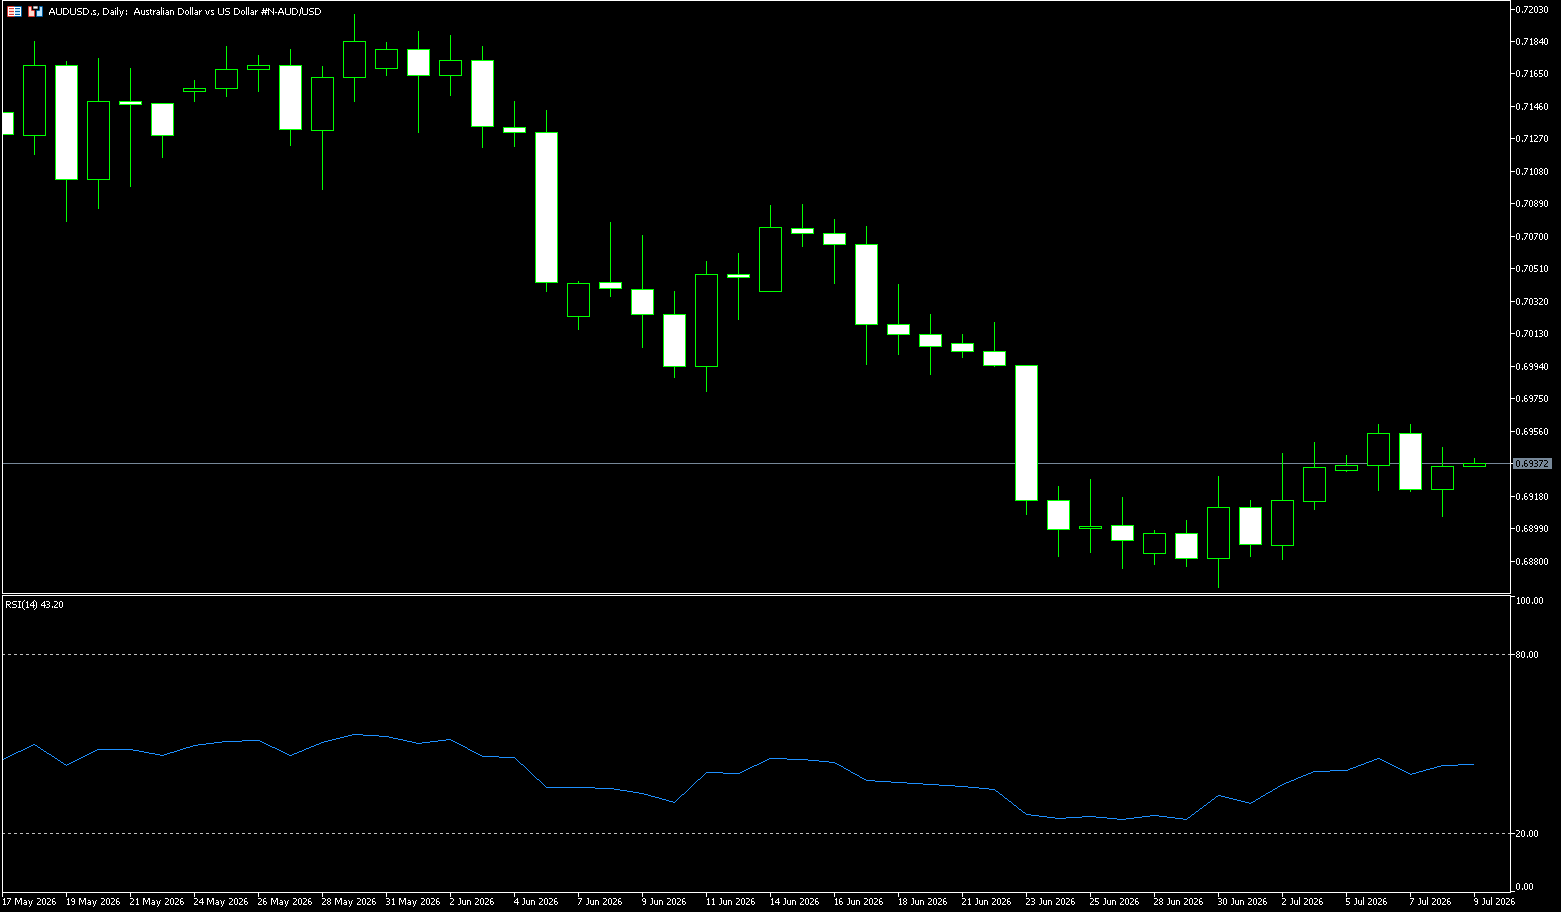
The Australian dollar recently fell to around US$0.6930, retreating to a three-month low, as renewed tensions between the US and Iran dampened global risk sentiment. Traders flocked to the safe-haven US dollar, while oil prices surged after the US launched a new round of strikes against Iran and revoked its licenses to sell oil, further exacerbating concerns about energy supply disruptions following attacks on tankers in the Strait of Hormuz. Meanwhile, Reserve Bank of Australia Assistant Governor Sarah Hunt stated that the recent oil price shock has weakened consumer and business confidence, but noted that the Australian economy remains resilient. She also reiterated that the central bank will act as needed to restore inflation to its target level and maintain sustainable full employment. Despite this, the market still expects the Reserve Bank to keep the cash rate unchanged in August, following three rate hikes this year, and the likelihood of another hike has diminished, with the market currently pricing in a roughly 40% rate increase in November.
The overall backdrop for the Australian dollar remains constructive, although momentum has weakened. Meanwhile, the Reserve Bank of Australia's cautious stance should continue to provide some support on pullbacks. However, the Australian dollar remains a currency highly dependent on market sentiment. It performs well when confidence is strong and tends to dominate when uncertainty increases. Therefore, while the medium-term trend remains constructive, the short-term outlook is less clear. An uptrend should emerge, but confidence is not yet fully established. The 14-day Relative Strength Index (RSI) is around 60, indicating relatively weak downward momentum. Initial resistance is located near the psychological level of 0.7000, followed by horizontal resistance at the 100-day simple moving average of 0.7069 and the 55-day simple moving average at 0.7088. Immediate support is seen around the psychological level of 0.6900, followed by horizontal support at the 200-day simple moving average of 0.6872.
Consider going long on the Australian dollar at 0.6915 today, with a stop loss at 0.6905 and targets at 0.6960 and 0.6970.
GBP/USD
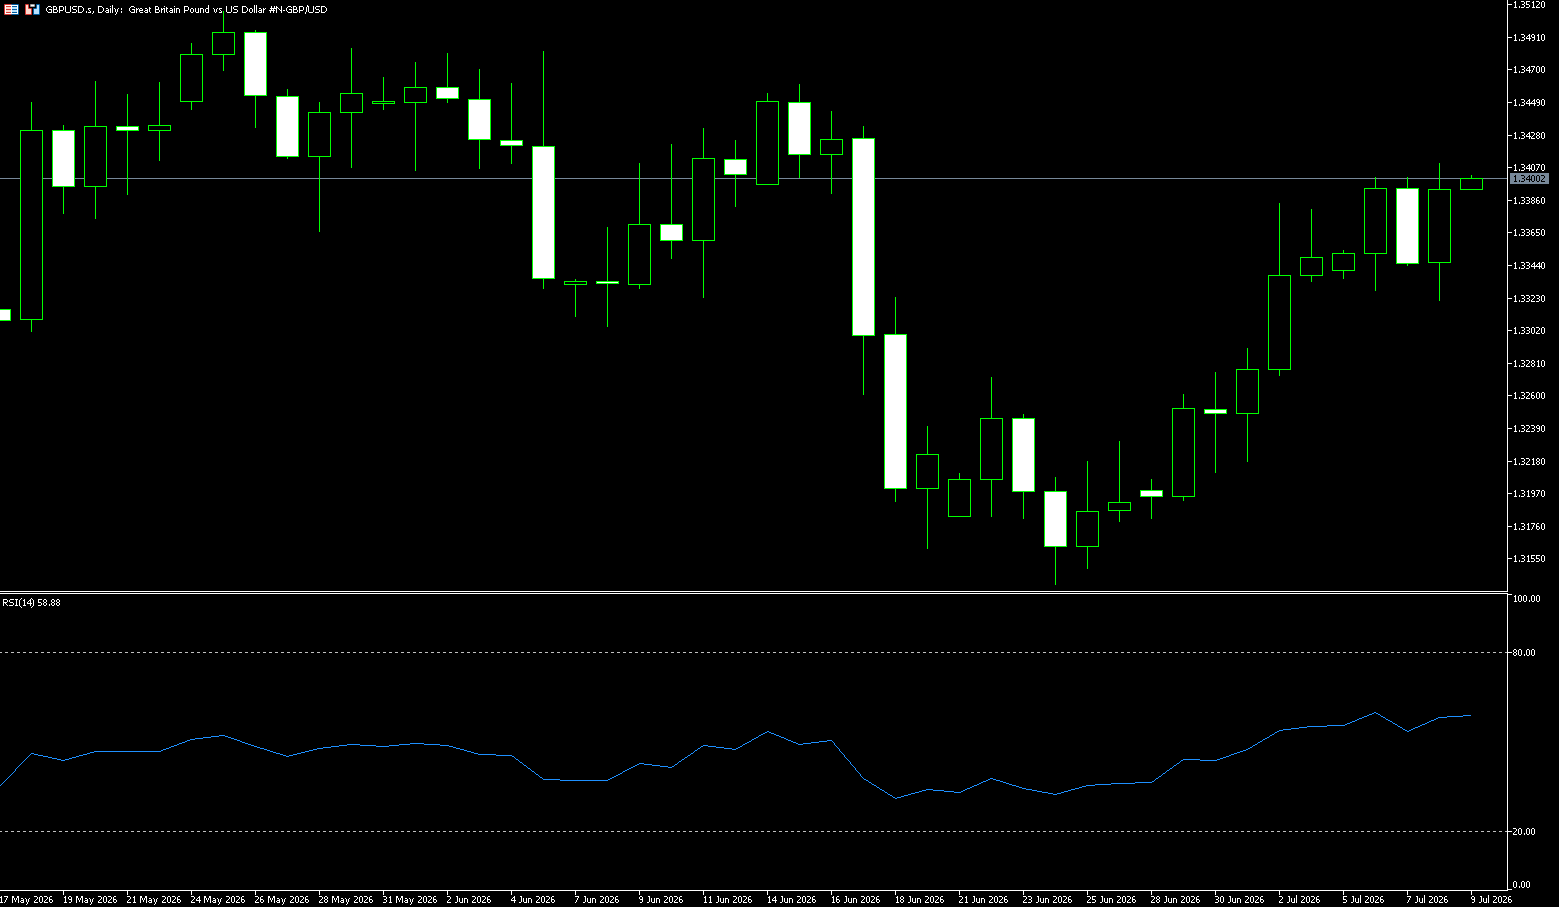
The pound accelerated its rise against the dollar, breaking through the key 1.3400 level on Wednesday. Despite continued tensions in the Middle East, the pound hit a multi-week high due to renewed dollar selling pressure. Reuters reported that Washington launched a new round of strikes against Tehran on Tuesday and revoked the country's oil sales licenses after three oil tankers were attacked in the Strait of Hormuz. Geopolitical concerns rose as a result, supporting the dollar's status as a safe-haven asset. The formal election to succeed incumbent Prime Minister Keir Starmer will begin on July 9. Leading candidate Andy Burnham is widely expected to become Prime Minister by July 20. The pound may receive some support as the British political landscape stabilizes. Investors are unwinding domestic risk premiums, and Burnham is solidifying his position as the candidate to succeed Starmer.
GBP/USD is trading around 1.3380, maintaining a short-term bullish bias, although the failure to break through the 1.3400 (psychological level) and 1.3401 (early week high) area keeps the overall bearish structure intact. Momentum indicators suggest waning bullish pressure, with the 14-day Relative Strength Index (RSI) converging towards the 50 midline and the MACD indicator crossing below the signal line, indicating a bearish trend. Bulls are facing resistance at the trendline from the late May high, located near the lows of June 12th and 16th, and slightly below the key 200-day simple moving average around 1.3398. A break above this resistance would confirm a trend reversal and could potentially challenge the June 15th high of 1.3460 and the highs of May 25th and 26th, the latter above 1.3500. On the downside, Thursday's low of 1.3300 (a psychological level) may provide support, followed by the 10-day simple moving average low of 1.3274 and the bottom of the aforementioned channel, currently around 1.3220 (the July 1st low).
Consider going long on GBP today at 1.3378, with a stop loss at 1.3365 and targets at 1.3430 and 1.3440.
USD/JPY
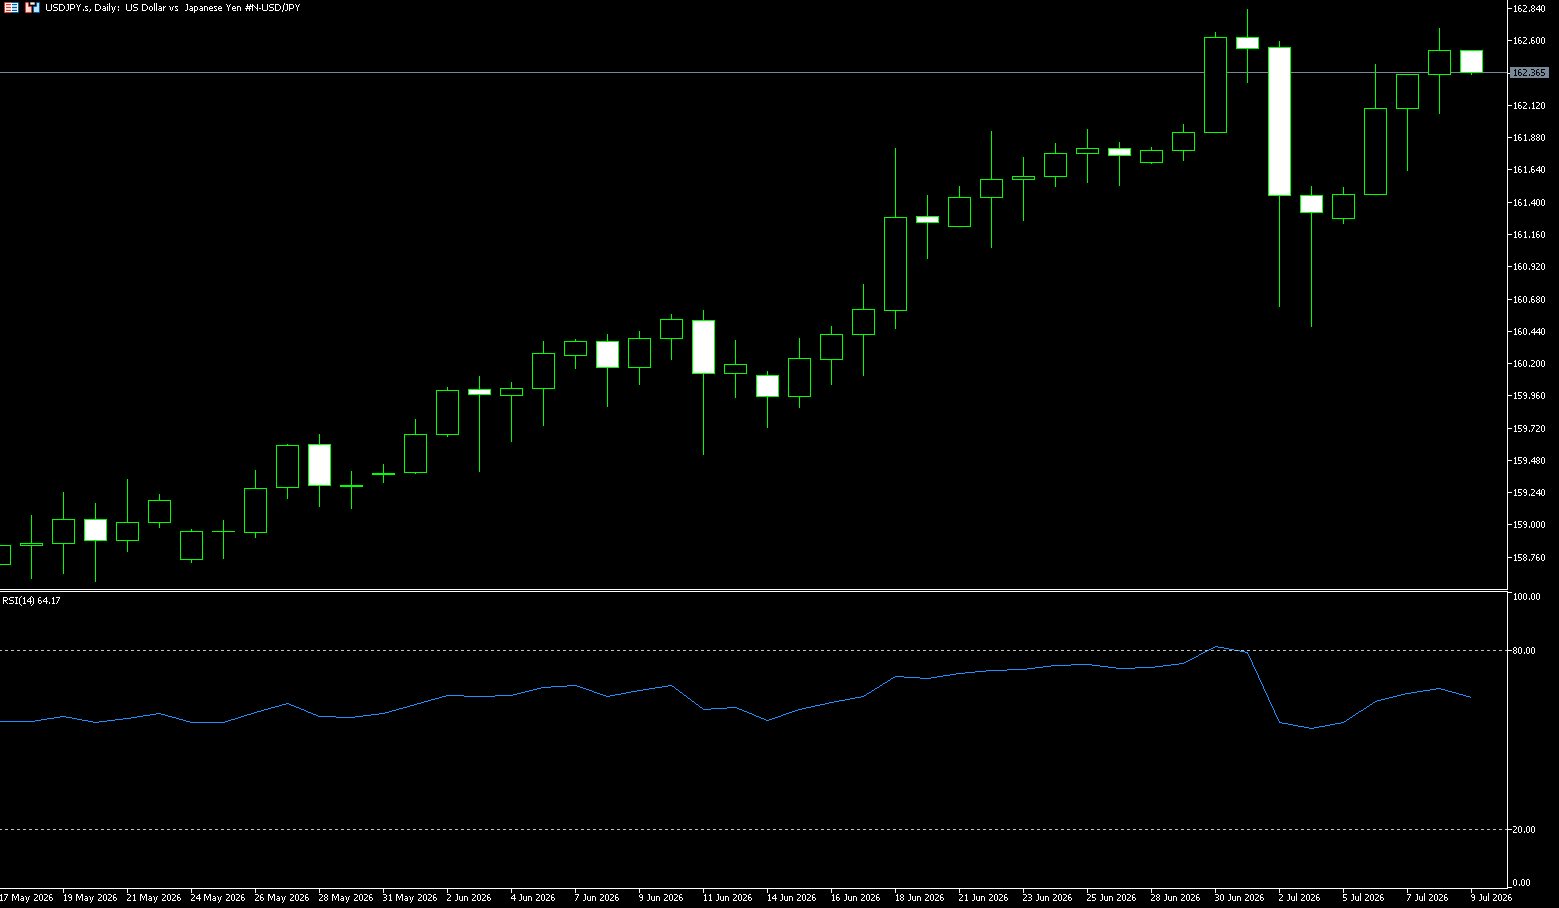
The yen weakened against the dollar on Wednesday to 162.50, falling to a near 40-year low, as the dollar rebounded due to safe-haven demand following a new round of US airstrikes against Iran in response to recent attacks on ships transiting the Strait of Hormuz. The escalating tensions pushed up oil prices, reigniting inflation concerns and putting pressure on the Japanese economy and currency, as the country is heavily reliant on Middle Eastern oil imports. Meanwhile, traders continued to bet on a weaker yen due to a lack of intervention from Japanese authorities. Despite this, the market remains wary of any potential currency support measures from Tokyo, although many investors doubt that intervention alone can provide lasting relief. Finance Minister Satsushige Katayama recently reiterated that officials are prepared to intervene in the foreign exchange market if necessary, adding that Japan maintains close communication with the United States on monetary policy.
From a daily chart perspective, the USD/JPY pair has recently maintained a high-level consolidation pattern. Although the price has retreated from its recent highs, it remains within an overall upward trend zone. Currently, the exchange rate is adjusting due to short-term dollar weakness and expectations of Japanese intervention, but no clear trend reversal signal has yet formed. The technical structure indicates that the bullish trend remains, but the upward momentum has slowed. Key resistance is seen around 162.84 (the high of July 1st); a break above this level could lead to a retest of the psychological level around 163.50. Support is seen around 161.00; a break below this area could lead to further pullback to the 159.50-160.00 area. The MACD indicator shows signs of weakening bullish momentum, indicating the market has entered a consolidation phase at higher levels.
Consider shorting the US dollar at 162.75 today, with a stop loss at 162.90 and targets at 161.90 and 161.80.
EUR/USD
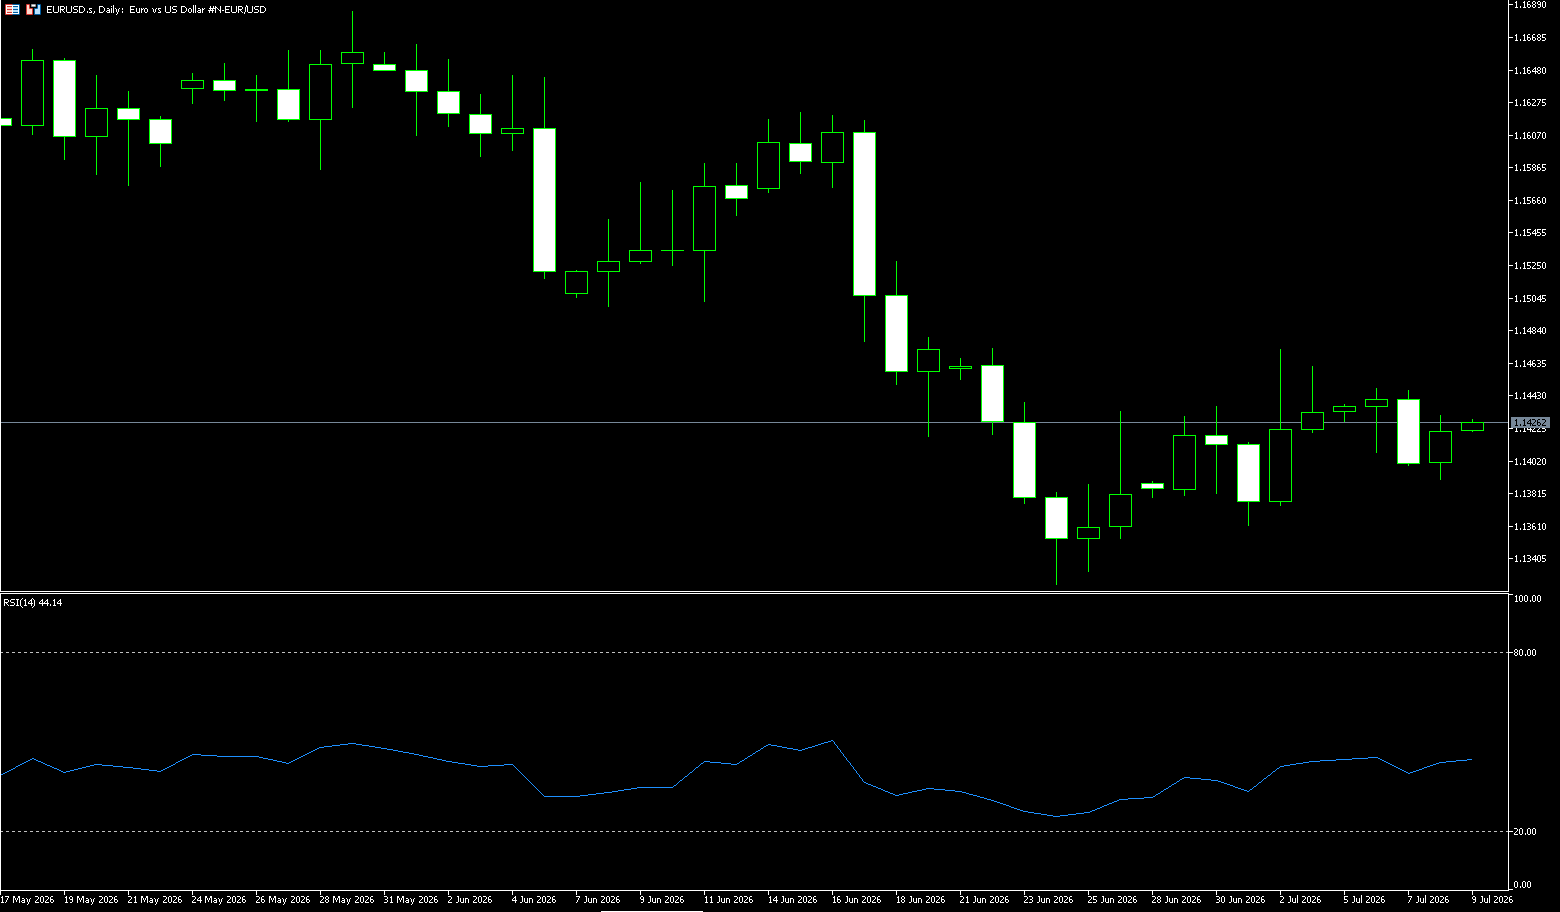
The euro/dollar pair remained stable after a slight decline the previous day, trading around 1.1410 in Asian trading on Wednesday. Traders are focused on the release of the Federal Reserve meeting minutes on Wednesday, the first meeting minutes chaired by new Chairman Kevin Warsh, with the market anticipating key clues about the future path of US interest rates. The euro/dollar pair held a slight gain, while the dollar edged lower after experiencing volatility. The dollar may regain support as safe-haven demand rises and geopolitical tensions escalate. Bets on a European Central Bank (ECB) rate hike have increased after Governing Council member Isabel Schnabel warned that the conflict in Iran is keeping core inflation high. European Central Bank policymaker and Bank of Italy Governor Fabio Panetta warned that inflation risks in the Eurozone remain high due to uncertainty surrounding energy supplies from the Strait of Hormuz.
The euro/dollar exchange rate has given back some of its recent losses as demand for the dollar has cooled. On the one hand, easing concerns about the Middle East war and its consequences have driven investors away from the dollar's safe-haven appeal. On the other hand, weak US data has put pressure on the currency. Meanwhile, momentum indicators suggest a slightly constructive backdrop. In fact, the 14-day Relative Strength Index (RSI) is hovering below 50, while the Moving Average Convergence Divergence (MACD) histogram is slightly positive. However, it remains prudent to wait cautiously for sustained strength above the 20-day moving average (1.1453) before making new long positions in the euro/dollar exchange rate and positioning for a continuation of the recent rally that began in the 1.1325 area (the lowest point since May 2025). The next relevant resistance level is locked at the psychological level of 1.1500, followed by resistance at 1.1550. On the downside, the first support level appears at 1.1372, the low of July 2nd. If bearish pressure persists, the psychological level of 1.1300 will become the secondary support level.
Today, consider going long on the Euro at 1.1405, with a stop loss at 1.1393 and targets at 1.1460 and 1.1450.
Stock Analysis:
Australian ASX 200 Stock Index
Basic Market Overview:
The Australian Securities Exchange (ASX) 200 index fell 19 points, or 0.2%, to close at 8785 on Wednesday, marking its third consecutive day of decline, as US stock index futures weakened and tensions in the Middle East escalated. Washington launched a series of airstrikes against Iran on Tuesday in response to attacks on three merchant ships in the Strait of Hormuz. Market sentiment remained tense ahead of key data releases from China, a major trading partner, on Thursday, including June's Consumer Price Index (CPI) and Producer Price Index (PPI). However, early losses eased after comments from Reserve Bank of Australia Assistant Governor Sarah Hunt, who noted that economic activity remained resilient despite weakened consumer and business sentiment due to the oil price shock. Most sectors were under pressure, with electronics, non-energy mining, and industrial services sectors showing weakness.
BHP's shares fell 2.3% after workers announced a planned strike on July 16 at its Western Australian iron ore terminal, demanding recognition of skills and costs. Other notable decliners included Evolution Mining (-4.2%), Mineral Resources (-3.4%), and Greatland Resources (-2.8%).
Sector Performance:
Leading Sectors (from highest to lowest gain)
Energy +3.26% (strongest performer)
Catalyst: US airstrikes on Iran and the cancellation of waivers for Iranian oil exports fueled a surge in Brent crude, with concerns about Middle East supply intensifying.
Representative Stocks: Santos +4.9%, Woodside Energy +3.3%, Beach Energy +3%, Yancoal. Coal companies also performed strongly.
Utilities +1.22% Defensive funds flowed in for safe-haven gains, with Origin and AGL rising slightly.
Consumer Staples +1.04% Supermarket giants Coles and Woolworths closed steadily higher, highlighting their safe-haven and defensive characteristics.
Financials +0.70% Weakened across the board in the morning session, but funds flowed back in the afternoon, with all four major banks turning positive. Macquarie recovered most of its losses by the close.
Leading Sectors (from largest to smallest decline):
Materials (Mining/Precious Metals): The biggest drag on the market.
Iron ore, copper, and gold all came under pressure. A stronger dollar and rising US Treasury yields weighed on resources: BHP -2.31%, Rio Tinto -2.55%; BHP's stock price was pressured by expectations of a July 16th port strike; Gold mining companies plummeted: Evolution Mining -4.2%, Northern Star -1.7%, Newmont weakened.
Technology -1.90%
Profit-taking from earlier gains led to a sharp overnight decline in US AI chip stocks, impacting market sentiment:
WiseTech Global, a heavyweight stock, fell 7.28% (its chairman's resignation triggered selling pressure), while Xero, TechnologyOne, and NEXTDC all closed lower.
Telecommunications:
Telstra fell 3.0%, with TPG, REA, and Seek also weakening. Communication services remained under pressure throughout the day.
Healthcare -0.32%
Overall, the sector weakened slightly, with only a few individual stocks bucking the trend and rising slightly.
Technical Analysis:
The ASX200 index closed at 8,785.1, down 0.21%. It experienced significant volatility throughout the day, plunging 1.4% to a low of 8,680.8 in the morning session due to the Middle East geopolitical conflict. However, the banking and energy sectors rallied in the late session, significantly recovering lost ground and closing near the day's high. This marks the third consecutive day of slight pullback, indicating short-term weakness but with effective support below. Currently, the index has formed a long lower shadow doji candlestick, a typical bottoming-out and rebound pattern, suggesting strong buying support around 8680, making a direct break below this level unlikely in the short term. However, upward momentum is weak, failing to break above 8820, limiting the potential for a rebound. Technical indicators show that the current price of 8785 is below the 50-day moving average of 8820, indicating short-term weakness; however, it has stabilized above the 200-day moving average of 8568, suggesting the medium-term trend remains bullish, and this is a short-term pullback within a medium-term uptrend. The 5/10-day moving averages have turned downwards, forming short-term resistance. The 14-day RSI is around 36, approaching oversold territory, but has not broken below 30, indicating a potential technical rebound. The MACD fast line continues to decline below the zero line, indicating ongoing bearish momentum, but the downward slope is slowing, showing early signs of a bullish divergence. The long lower shadow doji candlestick is a typical bottoming-out and rebound pattern, indicating strong buying support around 8680, making a direct break below this level unlikely in the short term; however, the upward momentum is weak, failing to break above 8820, limiting the rebound's potential.
Trading Strategies:
The following are technical trading ideas only and do not constitute investment advice. Leveraged trading may result in losses exceeding the principal.
Intraday Short-Term Trading (Today's Closing/Tomorrow's Early Morning)
Long (Buy on Dips)
• Entry Range: 8700–8720 (near the intraday low support zone)
• Stop Loss: Below 8670 (If it breaks below today's low, this round of support is invalidated, exit the position)
• First Take Profit: 8810–8820 (50-day moving average resistance level, reduce position upon encountering resistance)
• Second Take Profit: 8870 (Strong resistance, exit all positions)
Short (Sell on Rallies with Resistance)
• Entry Range: 8810–8825 (If it touches the 50-day moving average and fails to break through)
• Stop Loss: 8855 (A valid break above the short-term moving average resistance invalidates the bearish logic)
• First Take Profit: 8750
• Second Take Profit: Exit at the 8690 support level
Key Risk Warning China's June CPI/PPI (Morning Session): Weak data will weigh on mining and Australian cyclical stocks;
US FOMC Meeting Minutes (Overnight): Hawkish tone puts pressure on global risk assets;
Whether the US-Iran situation escalates further, oil price fluctuations will directly affect energy and inflation expectations;
Whether the index can hold above 8820 (50-day moving average) will determine the sustainability of the short-term rebound.
China Shanghai Composite Index
Basic Market Overview:
On Wednesday, the Shanghai Composite Index fell slightly by 0.2% to approximately 3,984 points, while the Shenzhen Component Index fell 1.6% to 14,988 points, both marking their third consecutive day of decline and hitting a one-month low, as renewed tensions in the Middle East affected the entire Asian market and dampened risk appetite. The US increased pressure on Iran by implementing new airstrikes and revoking sanctions waivers that allowed Tehran to export oil to global markets. This move is seen as the biggest threat to the interim agreement signed by the US and Iran leaders on June 17, casting a shadow over ongoing negotiations aimed at reaching a permanent peace agreement within 60 days of its signing.
In terms of individual stocks, Industrial and Commercial Bank of China (-0.6%), China Construction Bank (-0.6%), Zijin Mining Group (-1.8%), CATL (-1.2%), NAURA Technology Group (-2.4%), and Luxshare Precision (-2.6%) all declined.
Sector Performance:
Leading Gains:
Today's Leading Sectors (Contrarian Theme, Concentrated Capital Inflow)
Computing Power / Cloud Computing / Data Center (Strongest Theme of the Day)
Logic: Policy catalysts for intelligent computing clusters, rising overseas server chip prices, stable interim earnings expectations
Oil & Gas Exploration, Oil Services, Precious Metals (Safe-Haven Defensive Sectors)
Oil & Gas: Rising international oil prices, geopolitical risk aversion, state-owned oil stocks providing support
Gold: Increased risk aversion, Zhaojin Gold hits daily limit, hedging against market correction risk
Banking, Telecommunications, Media, Tourism & Hotels
Banking: Undervalued defensive, northbound funds slightly increased positions against the trend, hedging against high-level thematic profit-taking
Telecommunications Equipment: Net inflow of 4.859 billion yuan, benefiting upstream computing power suppliers
Culture & Tourism: Policy benefits from the "15th Five-Year Plan for a Strong Tourism Nation," low-level consumption rotation recovery
Today's Lagging Sectors (High-Level Tracks Concentrated Profit-Taking, Large Sell-Offs)
Energy Metals / Lithium Mining & Power Batteries (Leading Declines Throughout the Day)
Tianqi Lithium, Rongjie Shares, and Shengxin Lithium Energy all hit their daily limit down, indicating a capital outflow across the entire lithium battery industry chain; stocks that had previously seen large gains and weak interim earnings expectations were seen as institutions adjusting their portfolios and taking profits at the end of the first half of the year.
Humanoid Robots & Automation Equipment
Estun, Dayang Electric, and Rifeng Precision Machinery all hit their daily limit down, indicating a collective correction in high-flying themes and short-term capital withdrawal.
Photovoltaic Energy Storage, Cultivated Diamonds, Rare Earth Permanent Magnets, Building Materials, and Pharmaceuticals
Characteristics: Previously popular growth sectors and overvalued small-cap stocks generally experienced sharp declines, with small-cap stocks falling far more than heavyweight blue-chip stocks.
Technical Analysis:
The Hang Seng Index closed at 3,970.88 points, down 19.36 points, or -0.49%, for the day; total turnover in the two markets was approximately 2.56 trillion yuan, with volume shrinking for two consecutive days, indicating strong investor caution. On Tuesday, the index broke below the psychological level of 4,000 points. On Wednesday, after a slight opening higher, it trended downwards, closing with a medium-sized bearish candle on low volume. It effectively broke below all short-term moving averages (5/10/20 days), officially breaching the previous ascending triangle consolidation trendline. The 4,000-point level has now become a strong resistance level. The index has seen its highs and lows move lower for three consecutive days, officially entering a short-term downtrend. Only the 120-day and 250-day moving averages remain in a bullish alignment, indicating that the medium-term trend has not completely deteriorated. The current situation is a high-level correction, not a one-sided bear market. Trading volume has been declining over the past three days: 1.69 trillion on July 1st → 1.196 trillion on July 7th → 1.192 trillion on July 8th. This decline on lower volume suggests that panic selling pressure has not been fully released, and outside funds are unwilling to enter the market to buy on dips. Market Trends: Only a surge in trading volume (total turnover in both Shanghai and Shenzhen markets exceeding 3 trillion yuan) and sustained net inflows of northbound capital can confirm short-term stabilization; low-volume rebounds are extremely weak and tend to be characterized by oscillating declines.
Trading Strategy:
Short-term intraday trading (T+1, light position for a rebound, total position ≤ 20%)
1. Buying on dips (only for oversold correction, quick in and quick out)
Entry criteria: Two conditions must be met simultaneously:
The index retraces to the 3966-3970 support range, and the intraday chart does not make new lows, with continuous buy orders appearing;
The semiconductor/computing power sector bucks the trend and turns positive, not following the market's plunge.
Target profit: 3995-4000 resistance zone; unconditionally reduce position by half upon reaching this level;
Hard stop-loss: A valid break below 3965 (closing price or intraday volume break below), exit and observe; do not hold onto losing positions.
2. Short Selling and Position Reduction Strategy (Core Operation for Holders)
For all high-flying stocks with speculative themes and no strong fundamentals, reduce positions in batches when the price rebounds to the 3995-4000 range:
If the rebound touches 4000 points and encounters resistance, immediately liquidate short-term profits;
If the rebound in held stocks is weak and the sector continues to experience outflows, reduce positions by half to mitigate the risk of a pullback.
Risk Warnings:
During the interim earnings season, stocks without strong fundamentals are prone to concentrated sell-offs;
If the index breaks below the 3927 support level with significant volume, the downside potential is around 3900, increasing the risk of a systemic pullback;
In a low-volume, zero-sum market, rebounds are unlikely to be sustainable and are highly susceptible to sharp rises followed by falls; avoid chasing highs;
Volatility in overseas markets and continued outflows of northbound capital will amplify the short-term correction in A-shares.
Disclaimer: The information contained herein (1) is proprietary to BCR and/or its content providers; (2) may not be copied or distributed; (3) is not warranted to be accurate, complete or timely; and, (4) does not constitute advice or a recommendation by BCR or its content providers in respect of the investment in financial instruments. Neither BCR or its content providers are responsible for any damages or losses arising from any use of this information. Past performance is no guarantee of future results.
Lebih Liputan





Pendedahan Risiko:Instrumen derivatif diniagakan di luar bursa dengan margin, yang bermakna ia membawa tahap risiko yang tinggi dan terdapat kemungkinan anda boleh kehilangan seluruh pelaburan anda. Produk-produk ini tidak sesuai untuk semua pelabur. Pastikan anda memahami sepenuhnya risiko dan pertimbangkan dengan teliti keadaan kewangan dan pengalaman dagangan anda sebelum berdagang. Cari nasihat kewangan bebas jika perlu sebelum membuka akaun dengan BCR.
BCR Co Pty Ltd (No. Syarikat 1975046) ialah syarikat yang diperbadankan di bawah undang-undang British Virgin Islands, dengan pejabat berdaftar di Trident Chambers, Wickham’s Cay 1, Road Town, Tortola, British Virgin Islands, dan dilesenkan serta dikawal selia oleh Suruhanjaya Perkhidmatan Kewangan British Virgin Islands di bawah Lesen No. SIBA/L/19/1122.
Open Bridge Limited (No. Syarikat 16701394) ialah syarikat yang diperbadankan di bawah Akta Syarikat 2006 dan berdaftar di England dan Wales, dengan alamat berdaftar di Kemp House, 160 City Road, London, England, EC1V 2NX. Open Bridge Limited bertindak semata-mata sebagai pemproses pembayaran untuk BCR Co Pty Ltd dan tidak menyediakan sebarang perkhidmatan kewangan, perdagangan atau pelaburan bagi pihaknya. Peranan Open Bridge Limited adalah terhad kepada pemprosesan pembayaran.


 English
 简体中文
简体中文
 繁體中文
繁體中文
 Bahasa
Melayu
Bahasa
Melayu
 Tiếng
Việt
Tiếng
Việt
 ไทย
ไทย
 日本語
日本語
 한국어
한국어
 ភាសាខ្មែរ
 español