0
US Dollar Index
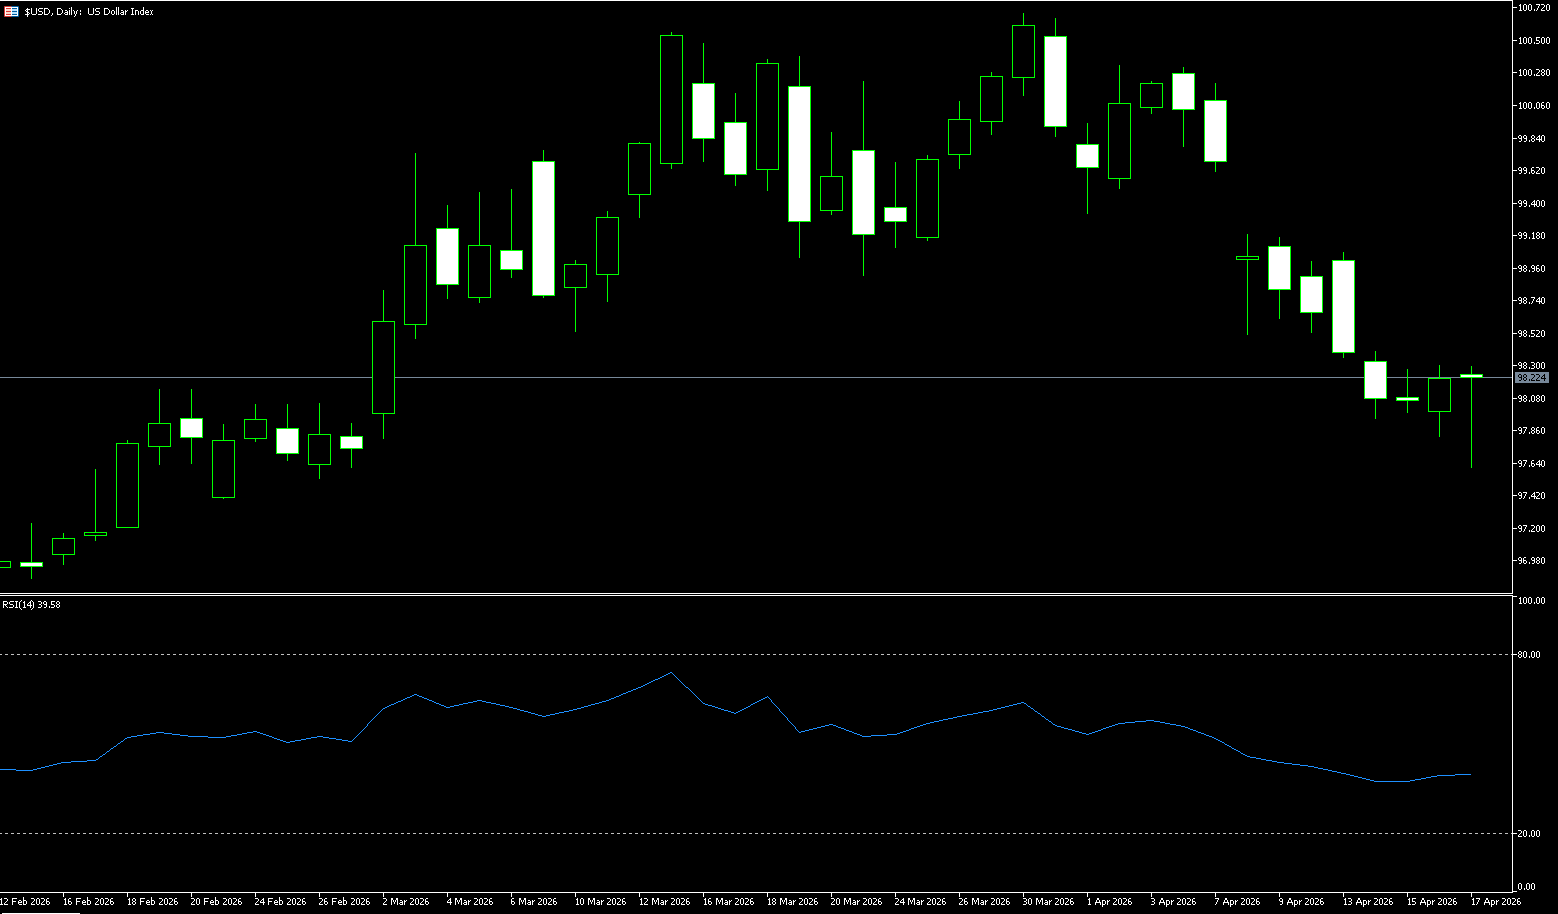
The US dollar index bottomed out at 97.83 last week and rebounded above 98.00. With six days remaining until the US-Iran ceasefire, geopolitical risks and strong US economic data are at play. The Fed's three statements provide support, and the strong rebound of the dollar indicates a renewed influx of safe-haven funds. Is a correction in global equity assets imminent? Although US President Trump stated that the conflict is "close to ending," and both sides confirmed they will restart negotiations to end the conflict, both the US and Iran denied reaching a consensus on extending the ceasefire. The specific date for the next round of talks has not yet been set, and the pace of the war remains significantly uncertain. The market had speculated that the ceasefire might be extended for two weeks, but Trump downplayed the necessity of this, emphasizing that negotiations are progressing steadily. This ambiguous signal has led to safe-haven funds adopting a wait-and-see approach.
Currently, the Strait of Hormuz remains under double blockade. As a vital transportation route for approximately 20% of the world's oil and liquefied natural gas, the restricted passage continues to push up risk premiums in the energy market. US military assets remain concentrated in the region, and the possibility of a ground offensive has not been completely ruled out. This lingering geopolitical risk serves as a short-term "safety net" for the US dollar. However, if a breakthrough is achieved in US-Iran negotiations and an agreement is reached to avoid escalation, Iran may allow ships to pass through Oman. At that point, safe-haven demand will further subside, and the dollar will face a new round of depreciation pressure. In stark contrast to the uncertainty of the geopolitical situation, the resilience of the US economy and job market continues to exceed expectations, becoming a key force supporting the dollar and suppressing one-sided short-selling sentiment. The current market consensus is that the Federal Reserve will maintain interest rates unchanged this month and for the remainder of the year. In this context, the core driver of interest rate differentials will not negatively impact the dollar.
The recent performance of the US dollar index has shown a clear negative correlation with gold. After reaching a high of 100.64 at the end of March, the dollar index experienced a one-sided decline. Fundamentally, with optimistic expectations for the Middle East situation and moderate manufacturing data, the "safe-haven premium" of the dollar index is being eliminated. The US dollar index showed initial signs of a rebound after touching previous support levels, but its rebound is expected to be limited due to the decline in US Treasury yields. The key point to watch is whether it can break through the resistance of the 200-day simple moving average at 98.53.
The core technical characteristics of the US dollar index last week were: low-level stabilization and consolidation, weakening bearish momentum, and a weak rebound. Overall, it remains in a correction phase within a medium-term downtrend. It fell continuously from around 99.00 during the week, touching a low of 97.80-98.00 mid-week, before stabilizing around 98.20 on Friday. The weekly chart is likely to close with a small bearish candle with a lower shadow, indicating buying support at the 98.00 level, but the rebound is expected to be limited. The index continues to trade below the 5-day, 10-day, and 20-day moving averages, and the medium-term bearish structure (from the high of 100.64 in early April) remains unchanged. The market is dominated by bears. After continuous declines, the first sign of a bottom appeared last week, but a reversal structure has not yet formed. The RSI technical indicator has rebounded from the oversold zone (<30) to around 40.55, indicating weakening short-term downward momentum and a need for correction. Meanwhile, the MACD histogram shows a significant decrease in green bars, and the fast line shows signs of turning upwards, indicating weakening bearish pressure. Since the weekly uptrend has been broken, with two consecutive weeks of declines, a mid-term correction from the 100.60 high has been confirmed. Therefore, on the downside, the first level to watch is 97.82 (last week's low), followed by 97.35 (February 23rd low), and the 97.00 (psychological level). On the upside, the 200-day simple moving average at 98.53 should be considered, followed by 99.00 (psychological level), and then the 99.06 (last week's high) area.
Today, consider shorting the US Dollar Index at 98.34, with a stop-loss at 98.45 and targets at 97.90 and 97.80.
WTI Crude Oil
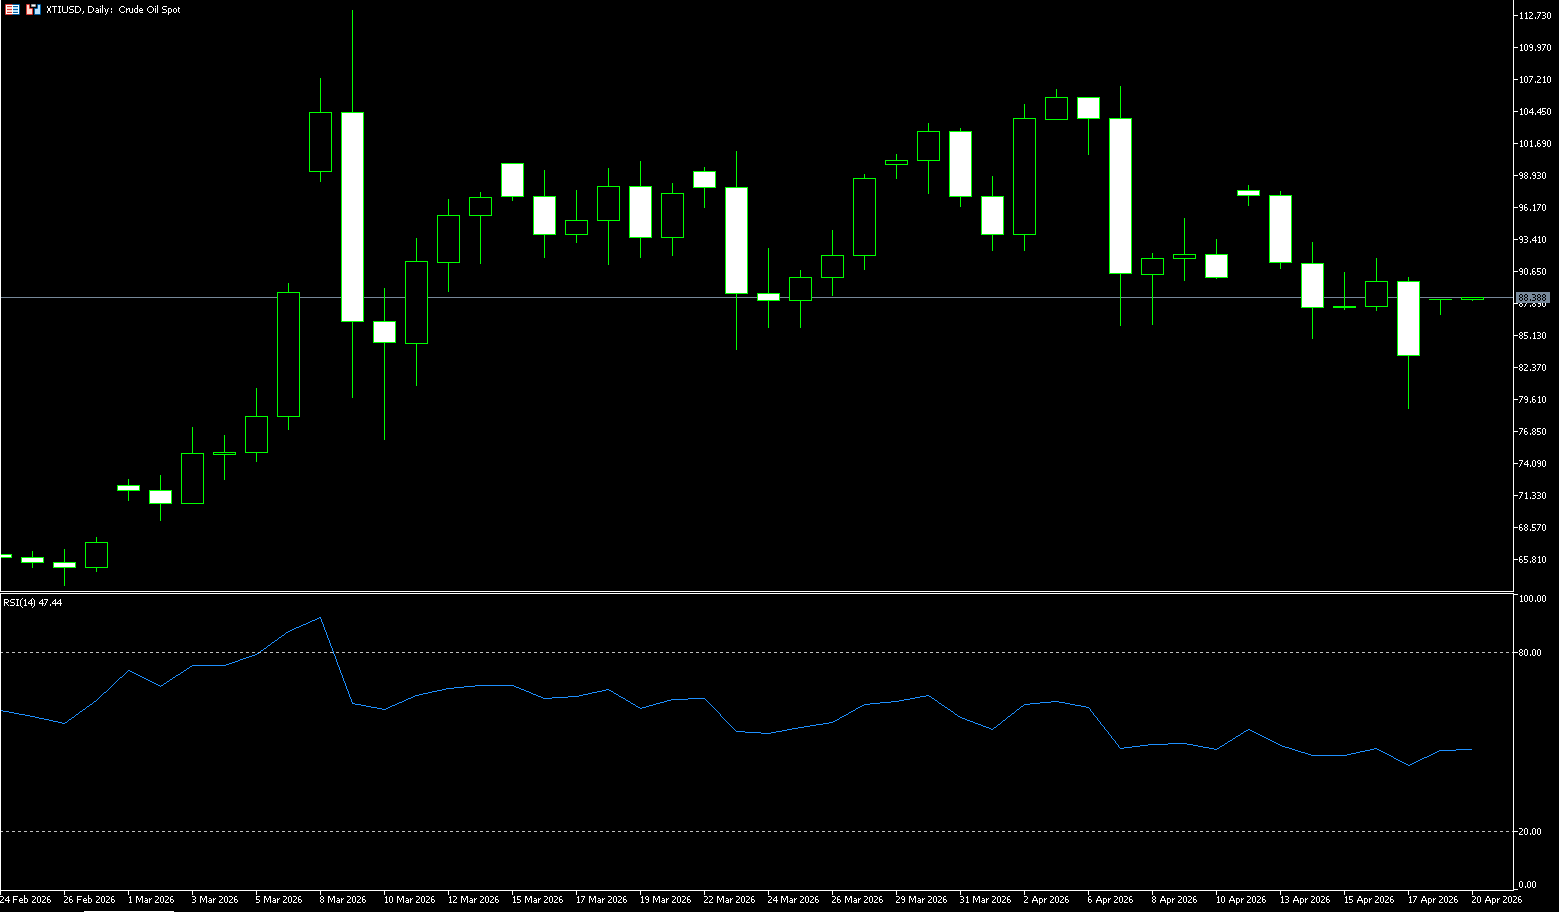
WTI crude oil prices plummeted more than 7% last week, falling below $79.00 per barrel, a near five-week low, after Iranian Foreign Minister Abbas Araqchi announced that the Strait of Hormuz had been fully reopened to commercial navigation during the ceasefire. This move boosted investor optimism, suggesting that the most severe global energy supply disruption in recent history might be easing. This statement followed earlier comments from President Trump, who indicated that concessions from Iran could pave the way for a broader peace agreement. Prices fell further after reports that the US might exchange $2 billion in frozen Iranian funds for enriched uranium stockpiles, with further negotiations expected this weekend. The market is increasingly pricing in the end of the supply conflict, which has severely impacted a significant share of global oil flows after nearly 50 days of disruption. The market is balancing high geopolitical risk premiums with diplomatic uncertainty, and short-term volatility is expected to remain high. Tensions in the Middle East have become the primary driver of current oil prices.
The current crude oil market is characterized by a combination of high geopolitical risk premiums and a tight fundamental balance. The full implementation of the Hormuz blockade and the increased US troop presence have significantly amplified concerns about supply disruptions, while the EIA report has data-driven confirmation of this concern. The surge in US crude oil exports is a direct response from the global market to Middle East risks. If the blockade leads to further actual supply disruptions, or if negotiations show clear positive signals, oil prices could experience significant two-way fluctuations. Given the highly uncertain geopolitical situation and the still fragile diplomatic window, crude oil prices will continue to be primarily driven by news.
WTI crude oil is currently in a weak, consolidating bottoming phase after a sharp drop from its highs. Short-term bearish sentiment prevails, while the medium-term trend is weakening, with a core range of $80-$100. Observing recent price movements, the trading range for WTI crude oil has gradually widened: from the initial $70-$100 to the current dynamic range of $90-$120+, with fluctuations mainly between $20-$30. Currently, a wide-range fluctuation is more likely to dominate – the interplay of tight supply and weak demand is causing prices to oscillate frequently within a wide range, rather than converge. Looking at a longer timeframe, around monthly milestones (such as May 1st): if negotiations make no real progress or the conflict escalates only to a limited extent, oil prices may rise to higher levels (120+ or even 130 USD), but a sharp drop in demand will quickly pull them back, forming a new upper limit for the "widened range."
Technical indicators such as the MACD/RSI in neutral oscillation and shrinking trading volume support this dynamically widening pattern. Currently, oil prices are trading below the 5/10/20-day moving averages, with the moving averages in a bearish alignment. The 20-week moving average has been breached, indicating a downtrend. The weekly chart shows a large bearish candle, engulfing the gains of the previous two weeks and breaking below the 20-week moving average, thus disrupting the medium-term uptrend structure. On the daily chart, after a one-sided decline, prices are consolidating at low levels, representing a continuation/weak recovery pattern within a downtrend, without a clear reversal signal. Therefore, this week, oil prices must firmly establish themselves above $84.67 (45-day moving average) and $85.00 (psychological level), and break through $90.28 (35-day moving average) and $90.12 (last week's high) to potentially reverse the weakness and reach $98.15 (last week's high), or even the psychological level of $100. Conversely, if oil prices fall below $80 (psychological level), the next target is $78.88 (last week's low); a further break will open the target of $72.40 (89-day moving average).
Today, consider going long on crude oil at $83.70, with a stop loss at $83.50 and targets of $85.00 and $86.00.
Spot Gold
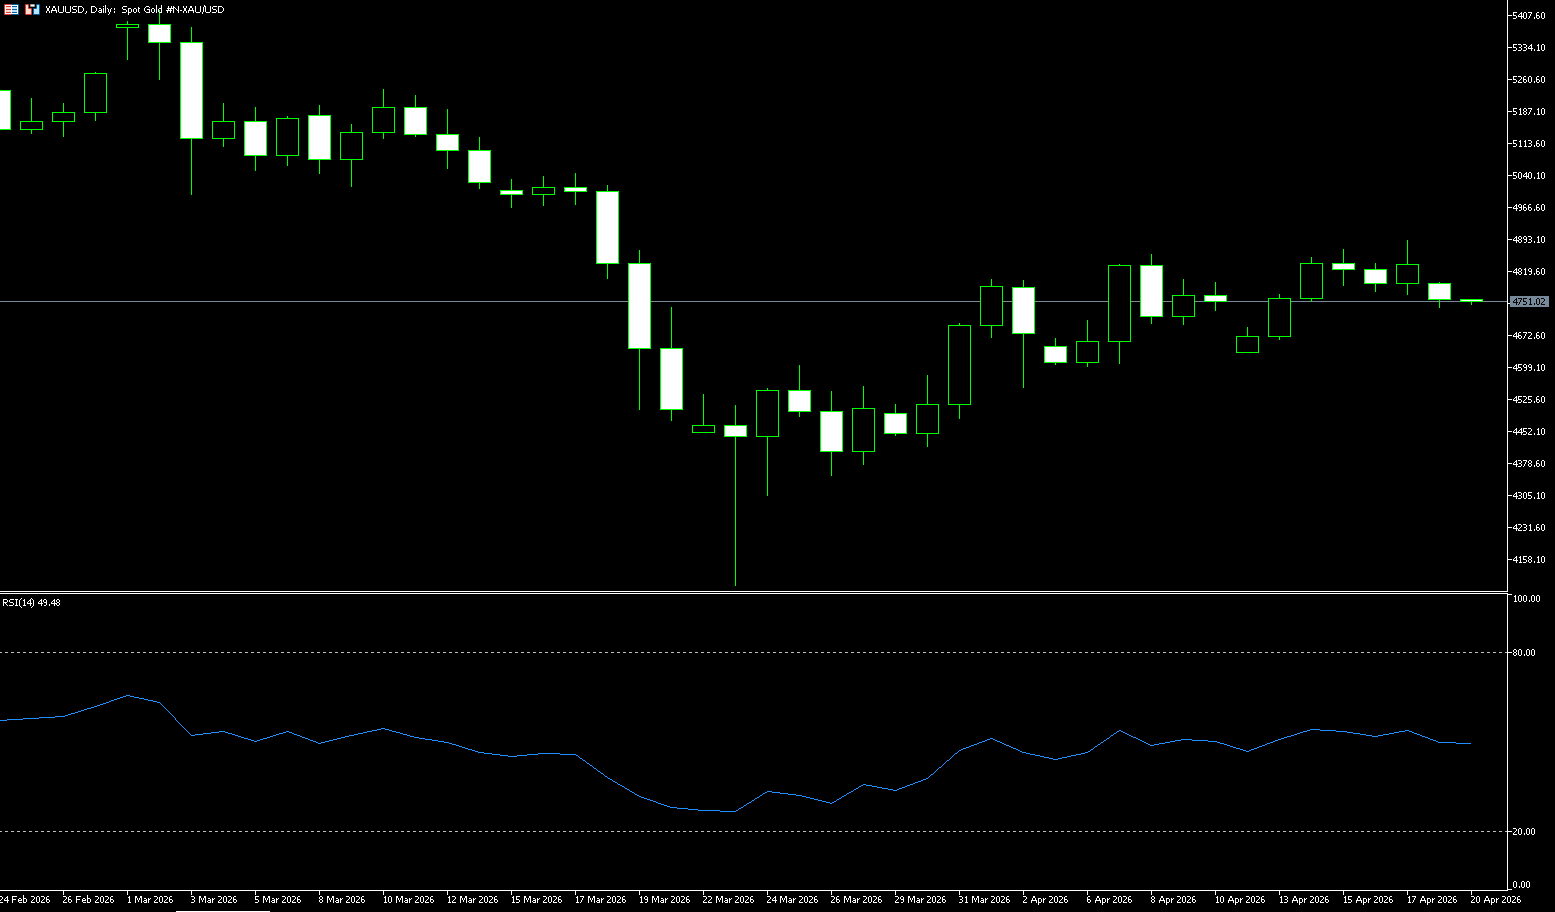
Last week, spot gold prices remained stable above $4,700 per ounce for most of the time, having earlier touched a one-month high of $4,890. The overall market sentiment has gradually recovered from the slump in March. This change is not an isolated event, but is closely linked to the dramatic turn of events in the Middle East—after the outbreak of the war between the US and Israel against Iran, gold prices were initially pressured by inflation concerns and tightening liquidity. However, President Trump's ceasefire declaration and positive signals from US-Iran peace negotiations are now injecting strong momentum into the gold market. Investors are beginning to reassess: if the war ends, energy prices fall, inflationary pressures ease, and the Fed's interest rate cut path becomes clearer, gold's appeal will once again be highlighted.
Looking back at recent trends, spot gold showed remarkable resilience in last week's trading. Although it fluctuated slightly after hitting a one-month high in the previous trading day, it remained in a high range overall, a stark contrast to the significant drop in gold prices in March. At that time, the US and Israel launched a war against Iran at the end of February, and investors' concerns about soaring inflation and market liquidity intensified, leading to a decline in the attractiveness of non-interest-bearing gold, and a significant outflow of funds from the precious metals market. However, gold prices began to quietly rebound as signs emerged that the US and Iran talks had quickly resumed after the breakdown of talks last weekend. News that the leaders of Israel and Lebanon had agreed to a 10-day ceasefire starting at 5 p.m. ET (5:00 a.m. Friday Beijing time) spread rapidly around the world. Subsequently, Trump told reporters outside the White House that the next meeting between the US and Iran might be held in Pakistan this weekend.
The yield on the 10-year US Treasury bond and the US dollar index have continued to decline since early April, which is the macroeconomic environment needed for gold to rise. The opportunity cost of holding non-yielding gold decreases as yields fall, while a weaker dollar makes it cheaper for overseas buyers to purchase gold; both factors are simultaneously beneficial to gold prices. Currently, the long-term trend of gold is mixed (RSI(14) is at 54). On March 23, gold prices successfully found support and stabilized at the 200-day simple moving average of $4096, verifying the strong support effect of this moving average; however, this stabilization occurred after the oscillating chart turned downwards. Judging the short-term trend using the 50-day simple moving average at $4,897.20, it remains in a downward trend. However, since the low of $4,098 on the 23rd of last month, gold prices have consistently formed a pattern of higher highs and higher lows, indicating a shift to an upward trend in the short term, which is the main source of current upward momentum.
Despite this contradictory trend, I remain bullish, primarily because gold prices are trading above the long-term retracement support zone of $4,744.30 (last Tuesday's low) to $4,541.80, which is a key support level. For a strong upward trend to be established, spot gold needs to first establish stronger support above the 40-day simple moving average zone of $4,871.30 (last week's high) to $4,872.60, and then break through the resistance of the 50-day simple moving average at $4,897.20. If the bulls can strongly break through this key level, gold prices are expected to rise further, targeting the psychological level of $5,000.00. Conversely, if gold prices shift from a strong to a weak downward trend, spot gold may first fall to the $4,715 (100-day simple moving average) and then the $4,700 (psychological level) area. If the bears can strongly break through this key support level, gold prices are expected to further decline, targeting the short-term support level of $4,632.60 (last week's low).
Consider going long on spot gold today at $4,825, with a stop loss at $4,820 and targets at $4,870 and $4,880.
AUD/USD
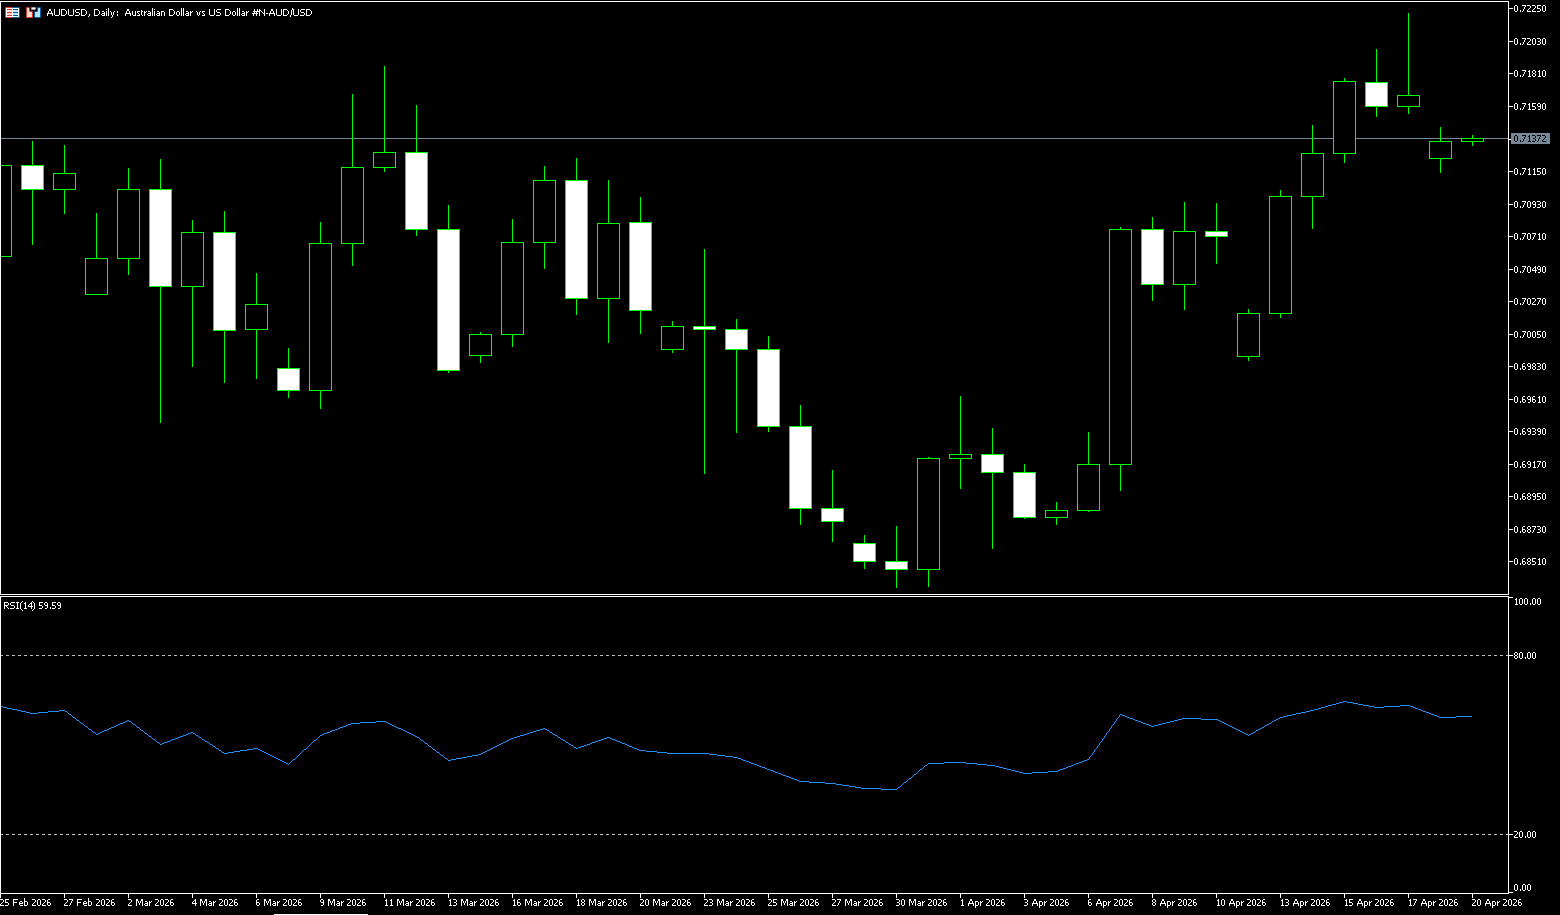
The Australian dollar has paused its upward trend against the US dollar, consolidating above 0.7150 last week due to a stronger US dollar. Meanwhile, a ceasefire between Israel and Lebanon has further fueled hopes for peace in the Middle East. This, coupled with declining market expectations for a Fed rate hike, may limit the dollar's gains and support the pair amid a hawkish outlook from the Reserve Bank of Australia. The Australian dollar held above US$0.7100 last week, near its highest level since May 2022, and generally rose against major currency pairs. The Australian dollar outperformed other currencies as market sentiment remained favorable for risk assets and hopes for a permanent ceasefire between the US and Iran remained strong. It is on track for its third consecutive week of gains, driven by improved risk sentiment fueled by hopes of a potential de-escalation in the Middle East conflict. US President Trump continued to hint at progress on a deal with Iran, adding that Iran is now more willing to abandon its nuclear ambitions and hand over enriched uranium. Meanwhile, neither side announced a timetable for a new round of negotiations. Despite key details remaining unconfirmed, the Strait of Hormuz continues to face disruptions, leading to increased volatility in energy prices.
Despite this, the Australian dollar has rebounded sharply, driven by optimism, rising more than 5% from its lows triggered by geopolitical tensions at the end of March. Meanwhile, Australia's labor market remained resilient in March, further strengthening market expectations that the Reserve Bank of Australia (RBA) may continue to tighten policy. The market currently expects a 70% probability of a third consecutive rate hike in May, with the upcoming first-quarter inflation data seen as key to the outlook. At the same time, strong growth in China in the first quarter, driven by exports and policy support, has boosted the demand outlook for Australian goods. The overall Australian dollar remains strong, and the RBA is unlikely to change its stance in the short term, which should support occasional selling pressure. Furthermore, the Australian dollar performs well when investor confidence is high, but the US dollar tends to regain its footing during market turmoil. Therefore, despite the generally positive long-term outlook, some uncertainty remains in the near term.
The Australian dollar against the US dollar last week exhibited a strong, volatile, and high-level consolidation technical pattern. After several weeks of gains, the exchange rate encountered resistance at the 0.7200 level this week, entering a short-term profit-taking and range-bound consolidation phase, but the medium-term upward trend remains intact. The Australian dollar is currently consolidating within a strong uptrend against the US dollar. The long-term and medium-term trends remain clearly bullish, but short-term fluctuations are due to its proximity to historical highs. 0.7100 is key to assessing strength, while 0.7200 is crucial for determining whether new upward movement can occur. The 14-day Relative Strength Index (RSI) is at 65, indicating solid positive momentum approaching overbought territory, although the average directional index (14) is near 20, suggesting the overall trend strength remains moderate. On the daily chart, the Australian dollar maintains a short-term bullish bias as the spot price has held firmly above the 55-day, 100-day, and 200-day simple moving averages between approximately 0.70 and 0.67.
The Australian dollar is currently trading around 0.7170, holding a constructive short-term bias, with the spot price holding above the 9-day simple moving average at 0.7098, technically supporting the latest rebound from the mid-0.68 area. On the upside, near-term resistance lies in the 0.7197 (last week's high) and 0.7200 (psychological level) area; a daily close above this level would open the way to the resistance at 0.7283 (May 2022 high) and subsequently 0.7300. Initial support is located at the 9-day simple moving average of 0.7098; a daily close below this level would indicate weakening bullish control and could trigger a deeper pullback to the recent low of 0.7000 (psychological level). As long as buyers hold this key level, the broader bias is likely to remain upward, with momentum indicators suggesting that pullbacks to support levels could still attract buying. A decisive break above the multi-year high of 0.7197-0.7200 would likely extend the rally to 0.7300.
Consider going long on the Australian dollar at 0.7160 today, with a stop loss at 0.7150 and targets at 0.7210 and 0.7200.
GBP/USD
The pound fell back to just above $1.35 before the end of last week as traders lowered their expectations for a Bank of England rate hike and increased optimism that the Middle East conflict might be nearing its end. From a fundamental perspective, the short-term stabilization of the US dollar was the direct cause of the decline in the exchange rate. Although the market remains optimistic about the easing of tensions in the Middle East, with the US and Iran preparing for a new round of negotiations before the ceasefire expires, overall risk appetite has improved, but the dollar has a need for a rebound after continuous declines. The US dollar index has risen slightly, putting short-term pressure on GBP/USD. Meanwhile, US inflation data continues to influence market judgments on the policy path. The latest PPI data was generally lower than expected, with a month-on-month increase of only 0.5%, significantly lower than the market expectation of 1.2%. This data reinforced the market's judgment that inflation is cooling and reduced the necessity for further rate hikes by the Federal Reserve, thus limiting the upside potential of the dollar.
The factors influencing the pound are more complex. On the one hand, UK government bond yields have fallen, with the 10-year yield dropping to around 4.7%, which has weakened the pound's interest rate support to some extent. The decline in yields is mainly due to the drop in oil prices, which has eased market concerns about inflationary pressures, thereby reducing expectations for aggressive interest rate hikes by the Bank of England. However, in the medium term, the market still expects the Bank of England to implement about two interest rate hikes before 2026, meaning that the pound's interest rate advantage still exists. In addition, demand for UK government bonds remains strong, with the latest 10-year bond issuance attracting subscriptions of approximately £148 billion, indicating that investor confidence in UK assets remains relatively solid, which provides some support for the pound.
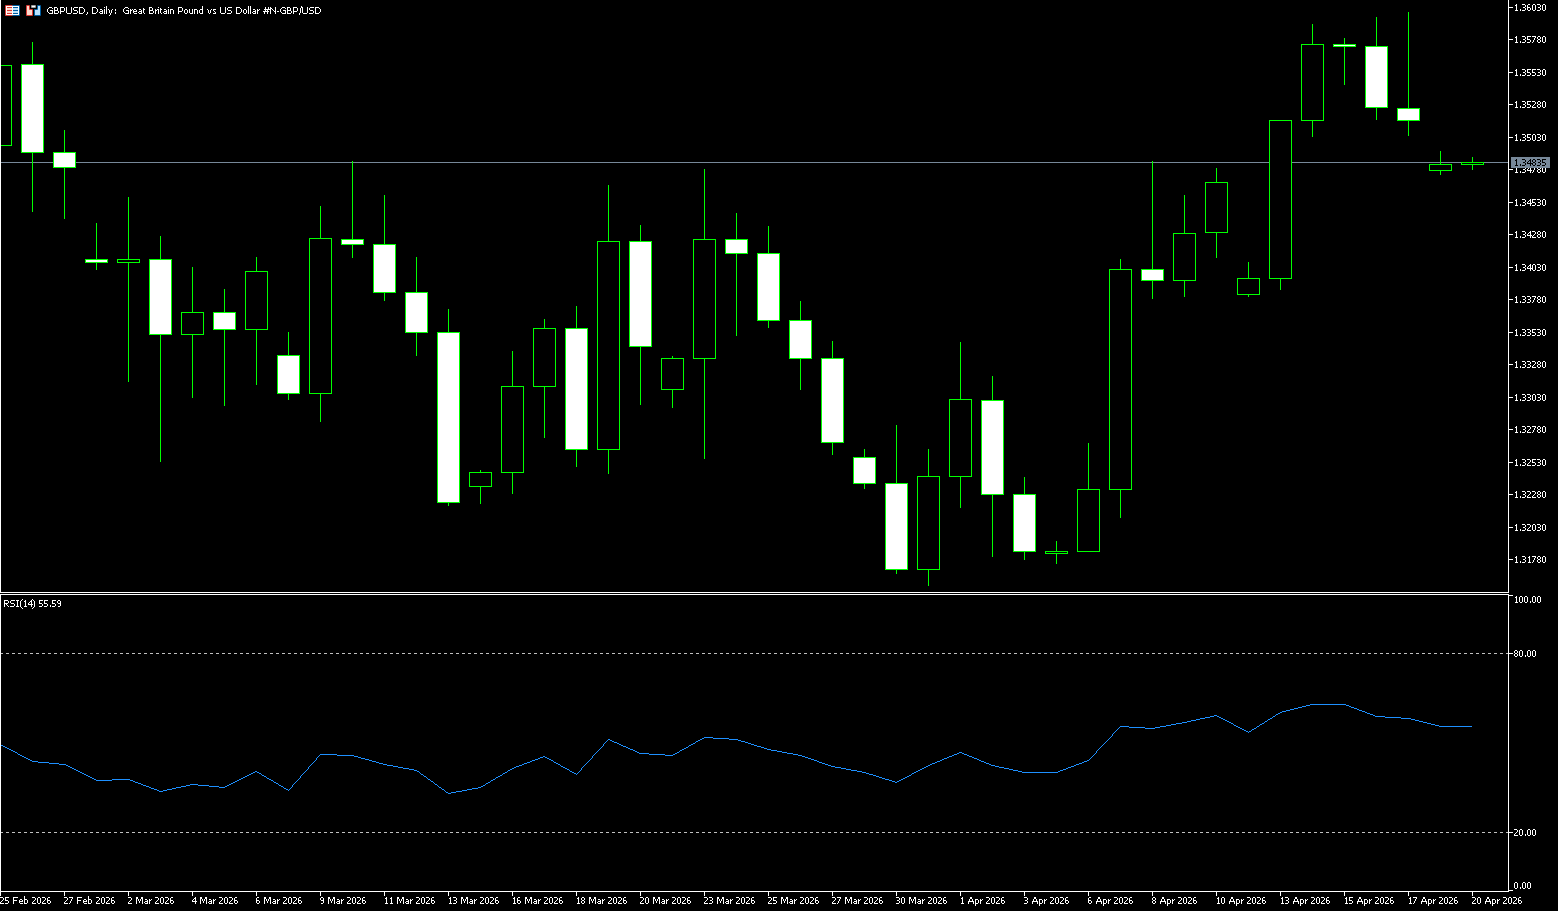
The pound against the dollar last week generally exhibited a technical pattern of high-level fluctuations, a pause in the bullish trend, and a probing by the bears. It briefly broke through the 1.3500 level mid-week, reaching a seven-week high, but encountered resistance at the strong resistance level of 1.3600 at the end of the week and fell back. The weekly chart shows a small positive candle/doji, with limited gains and significant pressure at high levels. On the daily chart, GBP/USD maintains its upward trend, with prices continuously reaching new highs, and the overall bullish structure remains intact. After a rapid rise, the exchange rate has entered a correction phase, with short-term moving averages flattening out, indicating weakening momentum. Momentum indicators show signs of decline, suggesting further room for adjustment in the short term.
GBP/USD is currently in a correction phase after its rise, with a short-term rebound in the US dollar and a decline in UK yields jointly driving the pullback. In the short term, the exchange rate may fluctuate around the 1.35-1.36 range, awaiting new fundamental drivers. The key to future movement lies in changes in expectations for Fed policy and the path of UK inflation and interest rates. If the US dollar weakens again, the exchange rate still has room to rise. However, the exchange rate has encountered significant pressure near the 1.3600 level, indicating strong resistance in this area. A subsequent break above this level could lead to further gains towards the 1.3620 (upper Bollinger Band on the daily chart) and 1.3671 (February 12 high) areas; a break above this level would target the 1.3700 (psychological level). The 1.3500 (psychological level) - 1.3472 (9-day moving average) range below forms a significant support level. A break below this level could trigger a deeper correction to the 1.3412 (200-day simple moving average) level.
Today, consider going long on GBP at 1.3505, with a stop loss at 1.3494 and targets at 1.3560 and 1.3570.
USD/JPY
Despite the uncertainty surrounding the Middle East situation, the Bank of Japan may still raise its policy rate to 1% in April, a level still below the neutral range. This level is neither restrictive nor stimulative, neither contractionary nor expansionary for the economy. Due to the uncertainty in the Middle East, market expectations for a Bank of Japan rate hike in April are weakening. The core variable currently influencing the exchange rate remains the interplay between geopolitical tensions and macroeconomic policy expectations. Although the market maintains some optimism regarding the prospects of US-Iran diplomacy, the uncertainty in the Middle East still poses potential pressure on the Japanese economy. Especially against the backdrop of continued tensions in the Strait of Hormuz, the US Navy's blockade of Iranian ports has further strained already restricted oil shipments.
Given Japan's heavy reliance on Middle Eastern oil imports, this situation has exacerbated market concerns about its economic prospects, thus weakening the yen's attractiveness. Market feedback indicates that this "imported risk" is gradually manifesting in the exchange rate. Investors worry that rising energy costs could drag down Japan's economic growth and even affect the trade balance, significantly weakening the yen's fundamental support beyond its safe-haven attributes. Against this backdrop, the USD/JPY pair has gained some upward momentum.
The yen's recent underperformance is mainly due to the persistent interest rate differential and the temporary impact of global risk events on safe-haven demand. Even with a pullback in the US dollar index, the yen has failed to rebound effectively, reflecting the complex interaction between fundamentals and policy expectations. Japanese authorities face a dual challenge: maintaining exchange rate stability while balancing economic growth and price targets. The USD/JPY pair is currently in a typical period of "fundamental divergence," with neither bullish nor bearish drivers gaining an overwhelming advantage. The Middle East situation is weakening the yen through energy channels, while declining US inflation is limiting the dollar's upside, causing the exchange rate to fluctuate within a range. In the short term, a break above the upper limit of the 159-160 range or a drop below the 155-156 support level will be key signals for determining the trend direction.
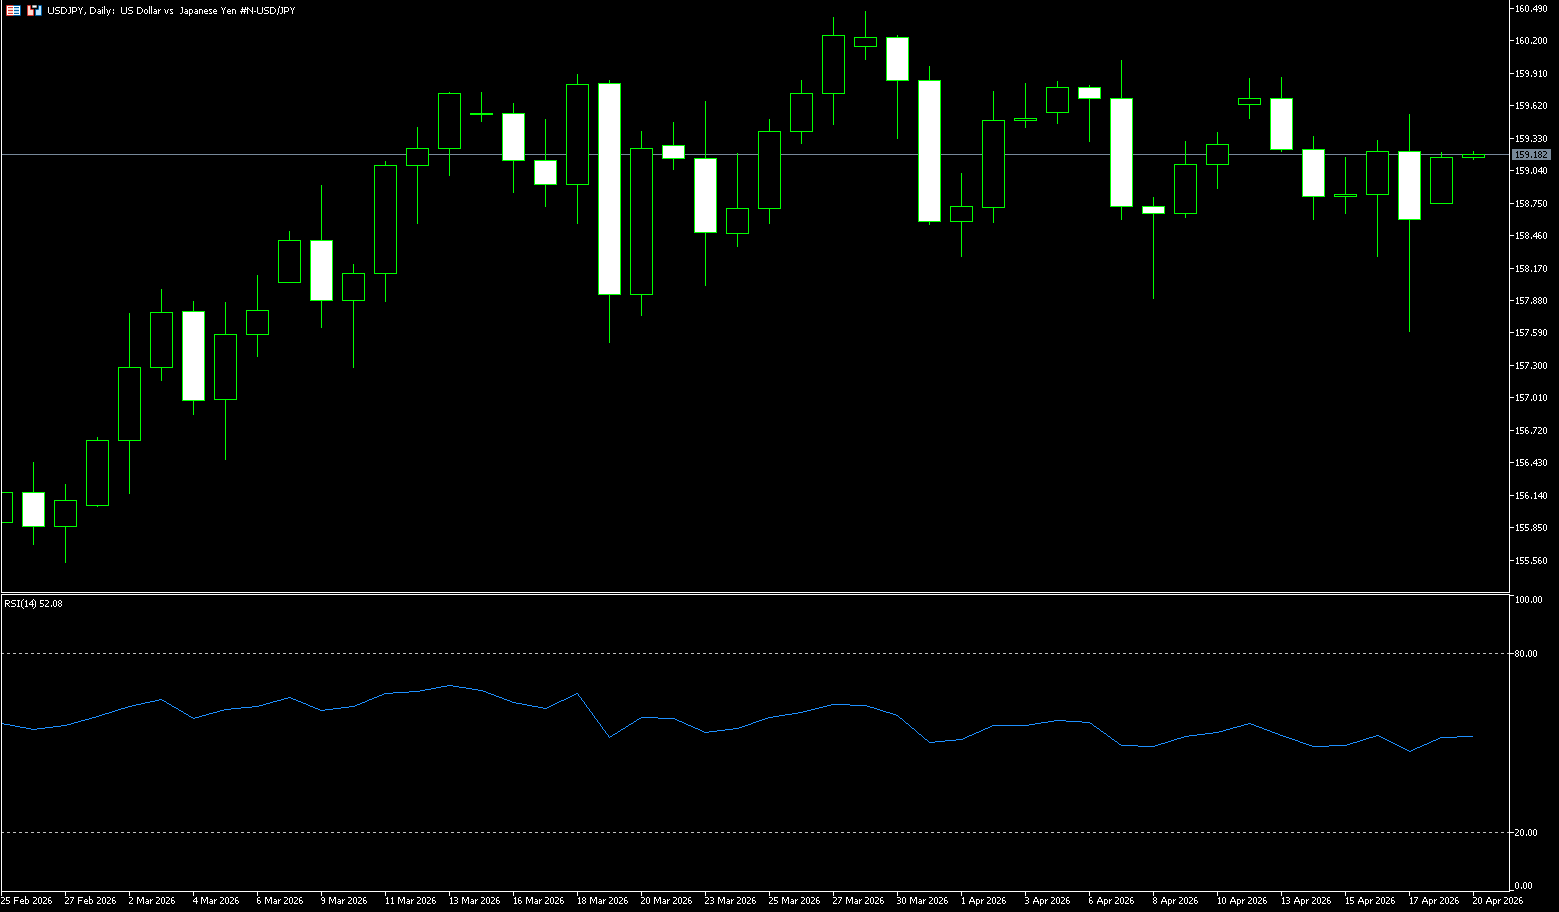
From a technical perspective, on the daily chart, USD/JPY is still in a high-level consolidation phase, with the trend shifting from a previous one-sided rise to sideways movement. The current price is trading in the upper part of the range, indicating that the bulls still have some advantage, but the momentum has clearly slowed. The weekly chart shows a third consecutive week of gains, with the exchange rate holding above all weekly moving averages, maintaining a healthy medium- to long-term bullish trend. Short-term moving averages (5/10/20-day) are in a bullish alignment, providing strong support for the price. The RSI (14-day Relative Strength Index) is in the 55-60 range, neutral to slightly bullish, and has not entered overbought territory (>70), indicating that bullish momentum remains but is not extreme. The MACD's DIFF and DEA lines have formed a golden cross above the zero line, and the histogram has turned red, indicating a renewed bullish momentum. Therefore, the first downside target is 158.27 (last week's low), followed by 157.63 (the 50-day simple moving average). On the upside, the psychological level of 160 is a key resistance; a break above this level would target 160.35 (April 2024 high) and then 161.29 (June 2024 high).
Today, consider shorting the US dollar at 158.82, with a stop-loss at 159.00 and targets at 158.00 and 157.80.
EUR/USD
Last week, the euro fluctuated around $1.18, near pre-war highs, supported by a generally weak dollar as investors grew increasingly optimistic that diplomatic efforts might end the US-Iran conflict. The report indicates that both sides are considering extending the ceasefire agreement by two weeks to allow more time for negotiations, with a second round of talks expected soon. In this context, oil prices have retreated from recent highs, helping to ease inflationary pressures and prompting traders to lower their expectations for near-term monetary tightening by the European Central Bank. The market now expects two rate hikes this year, each by 25 basis points, down from three expected a few weeks ago. Earlier in the week, ECB President Lagarde acknowledged that rising energy costs have deviated the eurozone from its benchmark economic trajectory, but she did not hint at any upcoming rate hikes.
The market has held a positive stance on the euro since the end of last week. In its latest view two days ago (April 15th, current price 1.1800), the market's current upward momentum remains modest. Nevertheless, the euro may continue to rise, but whether it can reach 1.1850 remains to be seen. The euro rose to a new high of 1.1824 before retreating. "The current price action is likely part of a consolidation phase. The euro is expected to trade between 1.1760 and 1.1805 before the end of the week. Upward momentum has weakened, but only a break below 1.1735 would indicate that the euro is not poised for further gains. Meanwhile, the euro/dollar exchange rate is trading around 1.1800 for the first time since February of last year, as optimism has significantly reduced demand for the dollar. Investors welcomed news that the US and Iran will return to the negotiating table in Islamabad later this week or early next week, meaning that tensions are unlikely to escalate, at least for the next few days.
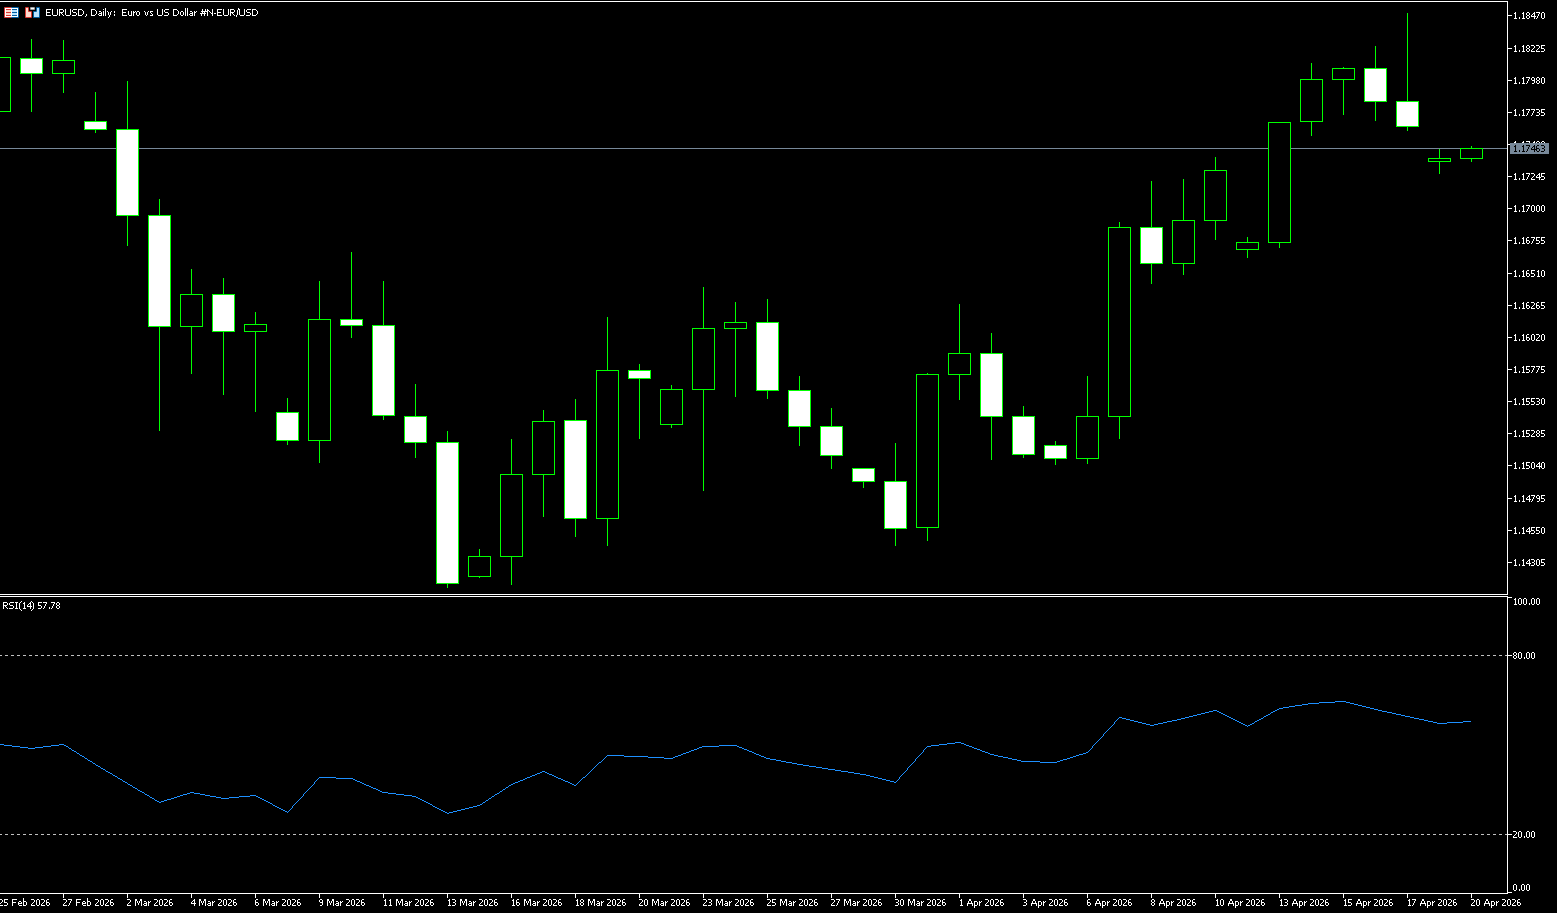
The euro/dollar pair has generally traded in a high-level consolidation this week, with weakening upward momentum, and the core trading range is between 1.1750 and 1.1824. Currently, the euro/dollar is fluctuating slightly, with the daily chart showing continuous high-level consolidation and a significantly slowed upward slope. The short-term trend is slightly bullish, with the price trading above the 5/10/20-day moving averages, and the medium-term bullish structure remains intact. However, the MACD indicator shows a contraction in bullish momentum, indicating weakening upward strength. The RSI (14 days) is at..." The pair is oscillating within the 60-65 range, neutral to slightly bullish but not overbought, lacking a clear directional driver. Short-term, it's likely to consolidate, with a breakout needed for confirmation.
From a technical perspective, the EUR/USD pair is in an uptrend on the daily chart, having risen for the seventh consecutive day. The spot price is above the 100-day and 200-day simple moving averages, located at 1.1703 and 1.1674 respectively, while the shorter-term 20-day simple moving average is at 1.1631, below both. Momentum indicators support further gains, while the RSI is at 63.44, significantly high, indicating buying pressure. Price pressure remains dominant for now. Immediate resistance is located around 1.1830, the high point of the exchange rate at the end of February. A break above this level would target 1.1900 (a psychological level). A further break above this level would target 1.20 (a psychological level). Initial support is seen at the 100-day simple moving average at 1.1703, while the 200-day simple moving average at 1.1674 strengthens the deeper support area. If the current rally pauses or retraces, buyers are expected to re-enter this area.
Consider going long on the Euro today at 1.1755, with a stop-loss at 1.1743 and targets at 1.1810 and 1.1820.
Disclaimer: The information contained herein (1) is proprietary to BCR and/or its content providers; (2) may not be copied or distributed; (3) is not warranted to be accurate, complete or timely; and, (4) does not constitute advice or a recommendation by BCR or its content providers in respect of the investment in financial instruments. Neither BCR or its content providers are responsible for any damages or losses arising from any use of this information. Past performance is no guarantee of future results.
Lebih Liputan


Pendedahan Risiko:Instrumen derivatif diniagakan di luar bursa dengan margin, yang bermakna ia membawa tahap risiko yang tinggi dan terdapat kemungkinan anda boleh kehilangan seluruh pelaburan anda. Produk-produk ini tidak sesuai untuk semua pelabur. Pastikan anda memahami sepenuhnya risiko dan pertimbangkan dengan teliti keadaan kewangan dan pengalaman dagangan anda sebelum berdagang. Cari nasihat kewangan bebas jika perlu sebelum membuka akaun dengan BCR.
BCR Co Pty Ltd (No. Syarikat 1975046) ialah syarikat yang diperbadankan di bawah undang-undang British Virgin Islands, dengan pejabat berdaftar di Trident Chambers, Wickham’s Cay 1, Road Town, Tortola, British Virgin Islands, dan dilesenkan serta dikawal selia oleh Suruhanjaya Perkhidmatan Kewangan British Virgin Islands di bawah Lesen No. SIBA/L/19/1122.
Open Bridge Limited (No. Syarikat 16701394) ialah syarikat yang diperbadankan di bawah Akta Syarikat 2006 dan berdaftar di England dan Wales, dengan alamat berdaftar di Kemp House, 160 City Road, London, City Road, London, England, EC1V 2NX. Entiti ini bertindak semata-mata sebagai pemproses pembayaran dan tidak menyediakan sebarang perkhidmatan perdagangan atau pelaburan.

 English
 简体中文
简体中文
 繁體中文
繁體中文
 Bahasa
Melayu
Bahasa
Melayu
 Tiếng
Việt
Tiếng
Việt
 ไทย
ไทย
 日本語
日本語
 한국어
한국어
 ភាសាខ្មែរ
 español