


0
Currency & Commodity Analysis:
US Dollar Index
The US dollar fell slightly on Tuesday but remained near its highest level in nearly two months, after Iran and Israel agreed to cease attacks on each other, prompting investors to shift to other currencies. Strong US May jobs data boosted market expectations for a Federal Reserve rate hike, with the market now pricing in a roughly 40% probability of a rate hike before the end of October. Investors increased their long dollar positions and reduced their euro long positions to a three-month low. Last Friday's much stronger-than-expected non-farm payroll report reinforced market expectations that the Fed will maintain high interest rates for an extended period, supporting a stronger dollar. The dollar index is expected to remain firm ahead of the CPI data release. Overall, the divergence in global monetary policy is narrowing—the Fed is holding rates steady, while other major central banks are raising rates or signaling rate hikes. This "US rates unchanged, other countries follow suit" pattern may provide a relative advantage for the dollar in the short term, but it also means that if the Fed is forced to tighten in the future, volatility in global financial markets will further intensify.
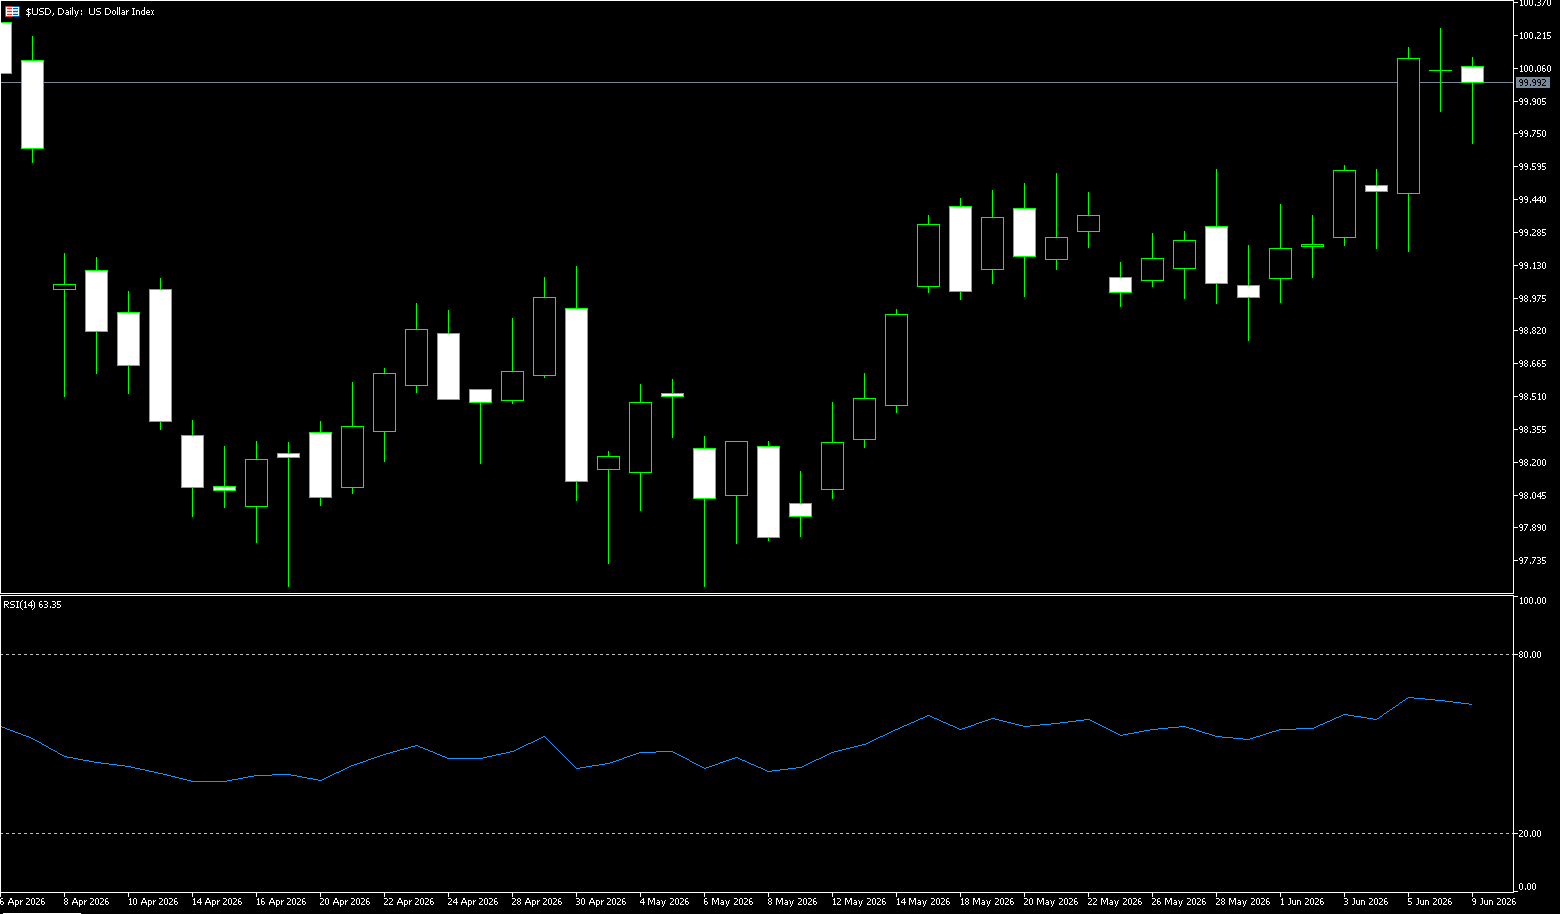
On Tuesday, the dollar index traded in a narrow range at high levels, currently hovering around 100.00. On Monday, the dollar index rose and then fell back, briefly reaching a near two-month high of 100.21 during the Asian session due to renewed fighting in the Middle East, but retreated to around the 100 mark after Trump called for a ceasefire. The US dollar index is currently in a strong upward channel on the daily chart. The price has rebounded steadily from the May low of 97.62, recently rising to near the 100 mark and approaching the previous high of 100.64, indicating a clear bullish trend. The moving average system is in a bullish alignment, with the price above the MA20, MA50, MA100, and MA200. Support levels are at 99.27 and 98.89, respectively, providing solid support. The key resistance level is at 100.64; a break above this level could open up further upside potential to the 101 mark. In terms of indicators, the MACD DIFF line is above the DEA line, and the red bars continue to expand, indicating strengthening bullish momentum. The RSI value is 63.99, in the bullish zone but not yet overbought, suggesting further upside potential. Overall, the US dollar index shows a clear short-term bullish pattern; pullbacks do not change the upward trend. Attention should be paid to whether the previous high resistance level can be broken.
Today, consider shorting the US Dollar Index at 100.10, with a stop-loss at 100.20 and targets at 99.70 and 99.60.
WTI Spot Crude Oil
WTI crude oil prices were trading around $88 per barrel on Tuesday. Trump claimed that Iran would be completely victorious in the next two weeks. Iran's representative to the United Nations expected that the US-Iran negotiations would reach an agreement before the end of June, which limited the increase in oil prices. Earlier in the day, relations between Israel and Iran deteriorated again, pushing crude oil prices to soar. The Iran-backed Houthi armed forces announced an attack on Israel and banned Israeli ships from passing through the Red Sea. At the same time, a new round of mutual attacks between Israel and Iran triggered market concerns about the expansion of regional conflicts. As tensions continue to simmer, the Strait of Hormuz remains a focus for investors. A large amount of the world's oil exports need to be transported through this strategic waterway, and the market continues to assess the possible impact of its long-term disruption. At the same time, the Organization of the Petroleum Exporting Countries and its allies (OPEC+) announced that they will increase crude oil production by 188,000 barrels per day starting in July. However, the market believes that this production increase is relatively conservative.
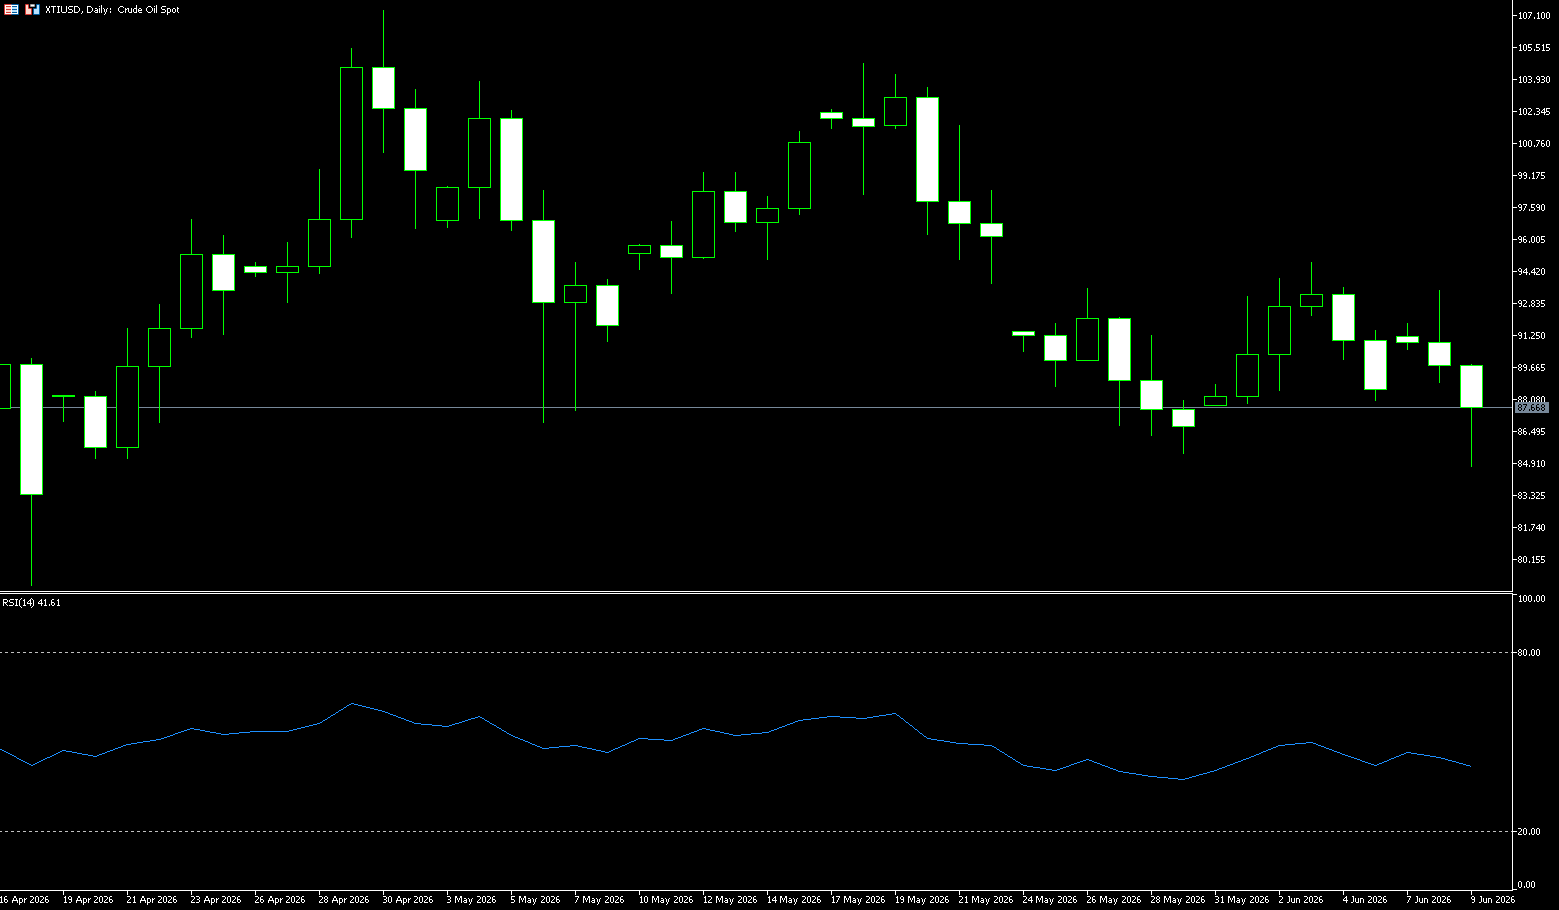
The current fluctuations in oil prices are mainly driven by news. They rose in early trading due to news of related actions and then fell back. The overall price is in a converging triangle arrangement. The upper part is suppressed by the downward trend line extending from the previous high (119.48), and the lower part is supported by the upward trend line extending from the December 2025 low (54.98). The fluctuation range continues to narrow. The current price is located in the middle and lower part of the triangle, and the overall trend is volatile and weak. Technically, it has fallen below the mid-track, and the risk of MACD dead cross appears. The 89-90 area below forms an important support area. If geopolitical tensions ease, the fundamental logic of supply and demand will again dominate, and prices may return to range-bound fluctuations. It is necessary to pay attention to the subsequent revision of expectations due to actual supply changes. The latest U.S. crude oil price is 88 US dollars, falling below the Paulin plus central axis of 93.66, and 90.00 US dollars {market psychological mark}; the lower support is at 86.28 {May 28 low}-86.95 US${90-day moving average} low. Then comes the $84.87 {Tuesday low} level.
Today you can consider going long crude oil at 8735, stop loss: 87.20; target: 89.00; 89.50
Spot Gold
Gold prices fell below $4,300 an ounce on Tuesday, retreating to levels not seen since December 2025, as investors turned their attention to an upcoming U.S. inflation report due on Wednesday, with inflation expected to rise to 4.2% in May, the highest level in nearly three years, driven mainly by soaring energy prices. The expected rise in inflation comes on the heels of last week's stronger-than-expected U.S. jobs report, which showed the economy added 172,000 jobs in May, far more than expected. That has prompted investors to increase bets on the Federal Reserve raising interest rates this year, with traders now pricing in about a 70% chance of a rate hike in December. Additionally, developments in the Middle East hinted at a possible deal, with Iran and Israel announcing a cessation of attacks on each other following a call from U.S. President Donald Trump. That sent oil prices lower and eased inflation concerns, although uncertainty remained.
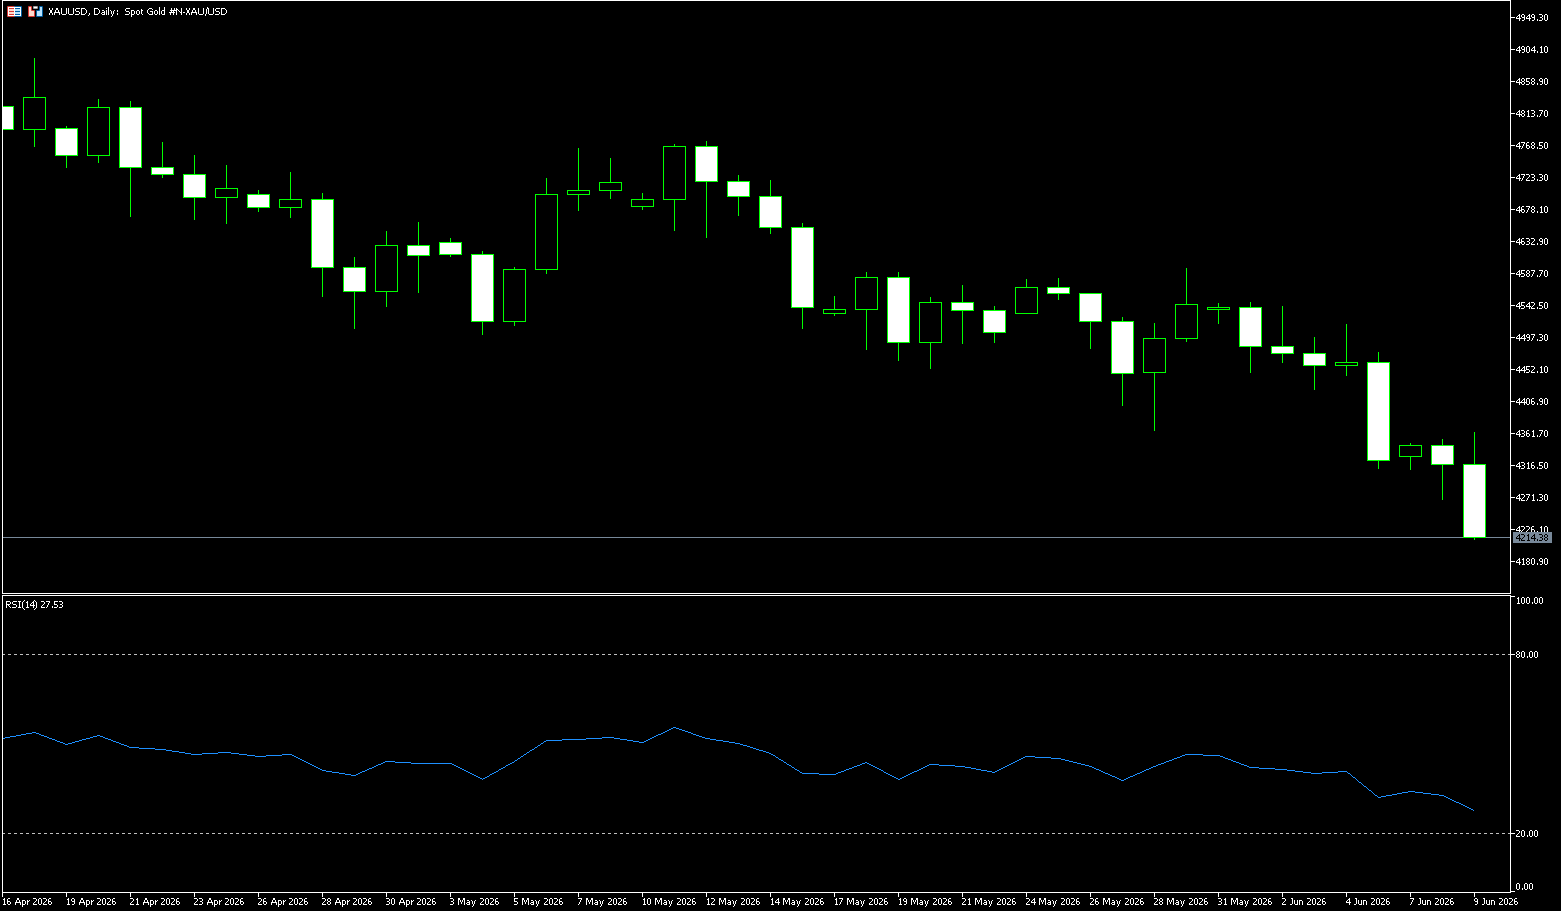
In the short term, the market is still in the shock recovery stage driven by data and news. Whether gold can rebound and stabilize the 9-day moving average of $4,435 will determine the strength of short-term bull momentum; data shows that gold has rebounded from a low of 4,268 to near above $4,300, and the golden cross below the MACD zero axis provides certain technical support. However, fundamentals are still suppressed by employment data and expectations of interest rate hikes. If this week's CPI data does not exceed expectations, and if the price can effectively stabilize in the 4,350-4,400 US dollars range and accompanied by amplified transactions, the rebound may continue to challenge the 4,435 resistance. On the other hand, if it falls below $4,300 again, the rebound may turn into a phased recovery. The key support is $4,237 {Tuesday's low} and the 4,200 integer mark. If it falls below 4,200, the rebound structure will face a test.
You can consider going long gold at 4,250 today, stop loss: 4,245; target: 4,290; 4,310
AUD/USD
The AUD/USD pair struggled to maintain its modest rebound since April 13th, declining in Asian trading on Tuesday. The spot price is currently trading in the 0.7025 range, appearing vulnerable to the strong US dollar sentiment. A temporary ceasefire between Iran and Israel slightly boosted global risk sentiment. However, geopolitical uncertainty remains, with the US and Iran still disagreeing on key issues including Tehran's nuclear program and the Strait of Hormuz. This has limited the corrective decline in the safe-haven US dollar since hitting a two-month high on Monday, and is providing resistance for AUD/USD. Meanwhile, the reduced likelihood of a June rate hike by the Reserve Bank of Australia (RBA) is putting some pressure on the Australian dollar and AUD/USD. This week's market focus will be on the US May Consumer Price Index (CPI) and Producer Price Index (PPI) reports, to be released on Wednesday and Thursday, respectively. This influences market expectations regarding the Federal Reserve's future policy path, thereby providing new momentum for the US dollar and the Australian dollar/US dollar exchange rate.
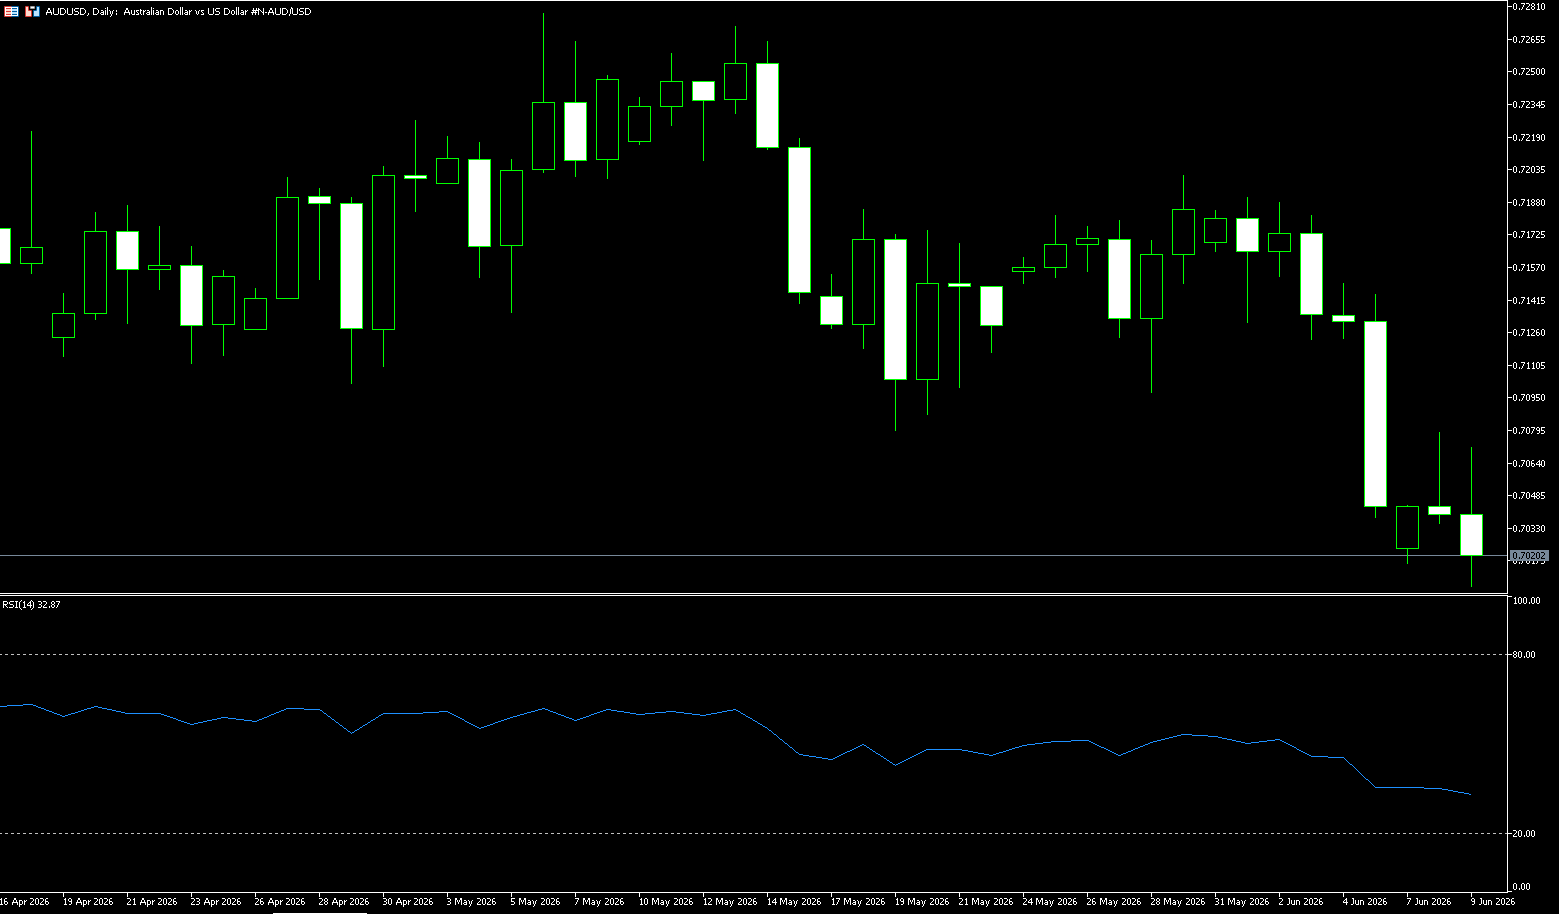
On the daily chart, AUD/USD trades near 0.7025, with a bearish bias in the short-term as spot prices have fallen below the technically important 100-day simple moving average (0.7076), which is bearish for bearish traders and suggests the path of least resistance for the pair is to the downside. And it is currently facing multiple obstacles. The round number mark of 0.7100 and the 55-day simple moving average of 0.7110 limit the upside space. The 14-day relative strength index (RSI) is close to 38, indicating weakening momentum, and the average directional index (14) is slightly above 22, suggesting that the bearish trend strength is beginning to accumulate, but it is not yet strong. Above, short-term resistance appears near the 100-day simple moving average at 0.7076, followed by the horizontal resistance at the 0.7100 mark; if the daily close breaks through this range, it will pave the way for a further move up to 0.7145 {20-day simple moving average}. The initial support below is found at the horizontal support level 0.7000 {market psychological mark}. If it falls below this, it will expose the deeper support level 0.6957 {140-day simple moving average}, and 0.6900 {integer mark} provide deeper support areas.
Today you can consider going long Australian dollar at 0.7013, stop loss: 0.7000; target: 0.7050; 0.7060
GBP/USD
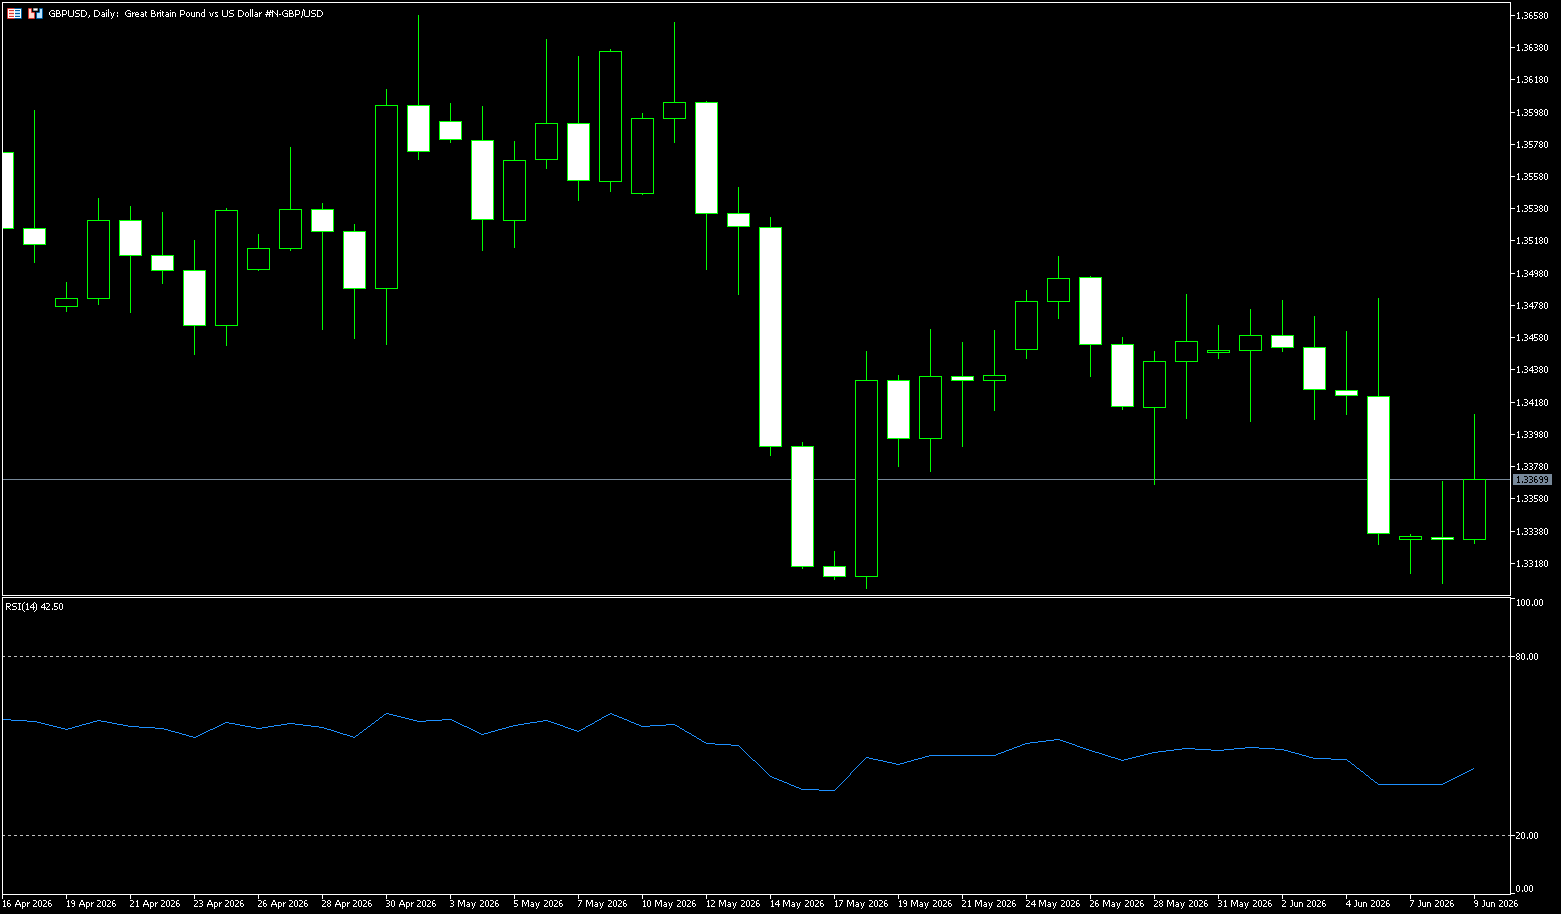
GBP/USD struggled to extend the previous day's modest rebound from around 1.3300 or more than three-week lows, and oscillated between moderate gains and losses during the Asian session on Tuesday. The spot price is currently trading around 1.3370, affected by the weakening of the US dollar, but the fundamental background still requires caution, and it is not yet appropriate to make position adjustments for any significant appreciation. Iran's military announced on Monday that its attack on Israel was over but warned that further strikes in Lebanon would trigger retaliation. The situation dragged the safe-haven dollar away from its highest level since late March hit the previous day and provided some support for GBP/USD. In addition, British Prime Minister Keir Starmer's authority has been severely shaken after a number of junior ministers resigned, exacerbating political uncertainty. That could dampen traders' aggressive bullish bets on the pound. Therefore, before confirming that GBP/USD has formed a short-term bottom, it is prudent to wait for strong follow-up buying. The market focus remains on the release of US inflation data and UK monthly GDP.
From a technical perspective, spot prices are trading near the 200-period simple moving average {1.3380} on the 4-hour chart and below the 50.0% Fibonacci retracement level of the decline from the May swing high, showing a restricted trend. Nonetheless, the Moving Average Convergence Divergence indicator (MACD) histogram is slightly positive and the relative strength index (RSI) is around 40, indicating slight bearish momentum. However, the momentum indicator is not yet strong enough to overcome the retracement and trend resistance above, making upward attempts still fragile for the time being. The initial resistance is located at the integer mark of 1.3400; followed by the 50.0% Fibonacci retracement level of 1.3476, and other resistance levels are the 61.8% retracement level of 1.3517. In terms of support below, the first support is at the 1.3300 mark, followed by the area near 1.3211 {April 7 low}; and 1.3200 {integer mark}.
Today you can consider going long GBP at 1.3360, stop loss: 1.3350; target: 1.3420; 1.3430
USD/JPY
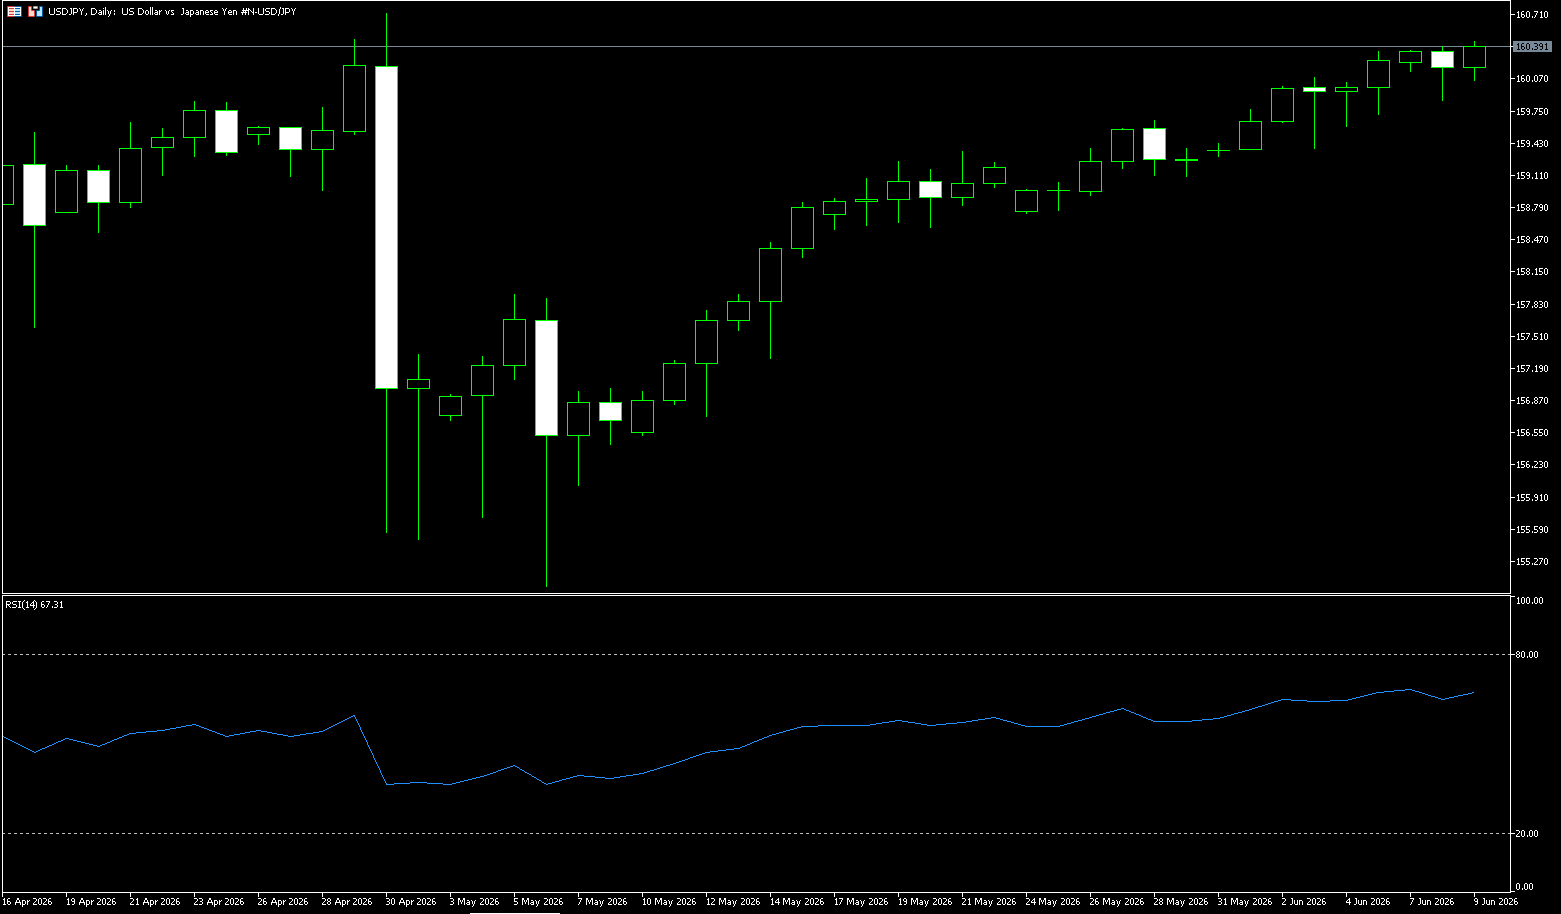
USD/JPY was trading in positive territory around 160.30 during Tuesday’s trading session. The escalating situation in the Middle East continues to boost the dollar against the yen. However, concerns over imminent intervention by U.S. authorities in currency markets could limit the pair's upside. The U.S. economy recorded strong job growth for the third consecutive month. Buoyed by strong U.S. employment data, traders increased their bets on the Federal Reserve raising interest rates, supporting the dollar. The market currently expects a 43% probability of a 25 basis point interest rate hike in December, a significant increase from about 14% a month ago. Japanese authorities have issued a strong verbal warning, saying the government is fully prepared to take decisive and appropriate action to protect the currency. This in turn could support the Japanese yen and act as resistance for the pair. Japanese Finance Minister Satsuki Katayama emphasized on Tuesday that his position has not changed and that relevant departments are ready to take decisive measures.
The U.S. dollar continues to strengthen against the Japanese yen, and the core logic is that the market is betting that the conflict in the Middle East will put significant pressure on Japan's economy in the second quarter. In addition, it can be clearly seen from the net positions of the U.S. and Japan that the long positions have loosened, or that short orders have been added more. Compared with the U.S. dollar longs, the U.S. and Japan even have the risk of changing the trend. However, if the Bank of Japan decides to raise interest rates in the later period, but the Japanese yen does not fall and the long stop loss cannot be triggered, it may cause the Japanese yen longs to cover their positions, or the short positions are closed, and eventually the key price of 160 is significantly exceeded. Technically, the US dollar against the yen is running along an upward channel. It is currently slightly below the 5-day moving average {160.15}. At the same time, there are obvious signs of intervention on the time-sharing chart, which will affect the enthusiasm of bulls to attack. Support is around 159.32 {20-day moving average} and 159.00 {integer mark}. Resistance points are at 160.60 {maintenance plus trajectory}, and 160.73 {high on April 30}, while 161.00 {integer mark} is still the main upward key resistance level.
Today you can consider shorting the US dollar at 160.55, stop loss: 160.70; target: 159.70; 159.50
EUR/USD
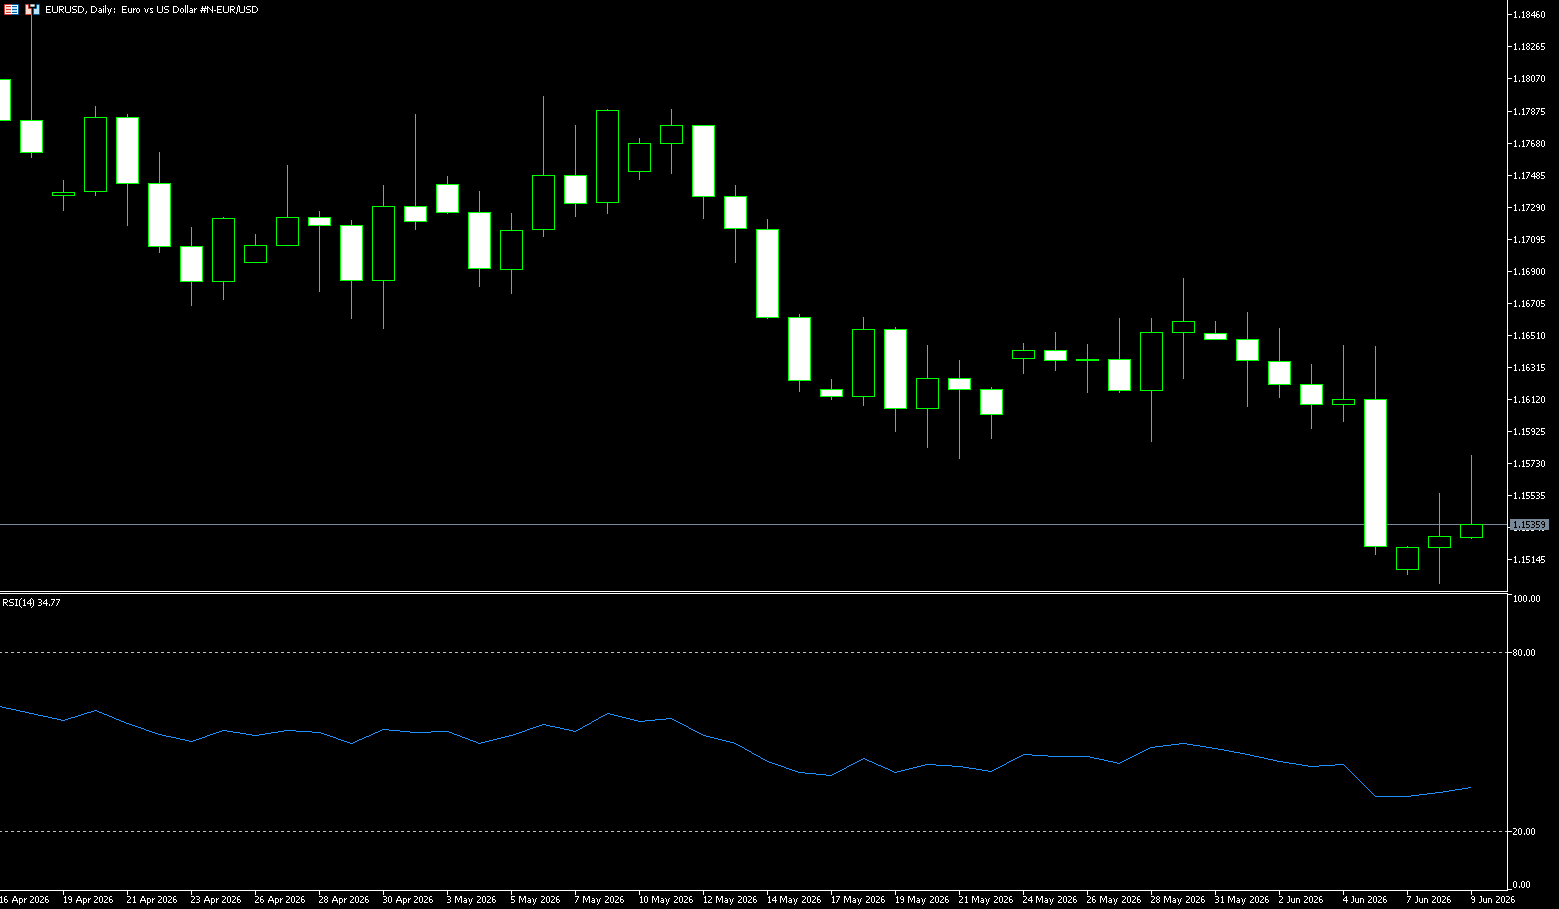
EUR/USD held steady above $1.1500, near its lowest levels since April 3, as renewed tensions in the Middle East stoked concerns about an ongoing conflict with Iran, fueling inflation concerns and dampening growth prospects. Brent crude rose more than 4% after Iran and Israel fired missiles at each other, despite President Trump's call for both sides to cease hostilities and engage in peace talks. Investors are also bracing for a possible rate hike from the European Central Bank this week, with traders now expecting three rate hikes from the European Central Bank and fully expecting the first to take place on June 11. This comes after data showed euro zone inflation rose to 3.2% in May, the highest level in two and a half years. However, uncertainty remains after euro zone GDP data was revised to show a contraction in the first quarter of 2026, the first since late 2022 and the sharpest since mid-2020.
From a technical perspective, the EUR/USD exchange rate is holding steady above the 1.1500 integer mark. Additionally, the relative strength index (RSI) is around 36.34 and the moving average convergence divergence indicator (MACD) is slightly positive, suggesting improved momentum. Any subsequent advance is more likely to encounter immediate resistance near the 1.1600 mark; and the 38.2% Fibonacci retracement level, around the 1.1675-1.1680 area. Then comes the confluence point at 1.1710. This area should limit the short-term bias, and if broken, EUR/USD could target the 61.8% retracement around 1.1740. On the downside, immediate support is at the 1.1500 integer mark, and deeper support is at 1.1443 {March 30 low}. If it falls below this point, a broader bearish phase will re-open.
Today you can consider going long the euro at 1.1528, stop loss: 1.1515; target: 1.1570; 1.1580
Stock Analysis:
Australian ASX 200 Stock Index
Basic Market Overview:
The Australian Securities Exchange (ASX) 200 index fell 21 points, or 0.2%, to close at 8,604 on Tuesday, marking its third consecutive day of decline. This followed the latest data showing that Australian consumer confidence fell in June, marking its fourth decline this year after rising in May, due to persistent cost-of-living pressures. On the other hand, business confidence improved somewhat in May but remained negative, mainly due to concerns about the impact of high borrowing costs. Nevertheless, the local market rebounded after an early decline, benefiting from strong trade data from its major trading partner, China, in May. Exports hit a record high, while imports accelerated. Meanwhile, the Reserve Bank of Australia will hold its policy meeting next week, and traders expect a pause in rate hikes after three increases since January. In the US, stock index futures strengthened, benefiting from a rebound in Wall Street chip stocks on Monday.
Today's decliners included Lynas Rare Earth (-4.5%), Evolution Mining (-4.2%), Fortescue (-3.5%), and heavyweight BHP Billiton (-1.7%). Two of the Big Four banks saw declines between 0.5% and 1%.
Sector Performance:
Leading Gains:
Telecommunications Services rebounded 1.71%, shaking off recent weakness: Telstra (ASX:TLS), TPG Telecom (ASX:TPG)
Consumer Staples rose 1.49%, a defensive sector favored, with supermarket stocks performing strongly: Coles (ASX:COL) up 2.4%, Woolworths (ASX:WOW) up 1.4%
Healthcare saw approximately 1% increase in defensive demand: CSL (ASX:CSL), Ramsay Health Care (ASX:RHC)
Real Estate Investment Trusts (REITs) saw slight increases with stable interest rate expectations: Goodman Group (ASX:GMG), Scentre Group (ASX:SCG)
Leading Losses:
Gold prices were pressured by a 4% increase in US interest rate expectations: Perseus Mining (ASX:PRU) down 8.58%, Evolution Mining (ASX:EVN) down 8.35%
Metals and mining commodities saw prices decline by approximately 3%, with iron ore prices weakening. Fortescue (ASX:FMG) fell 3.5%, and Rio Tinto (ASX:RIO) fell 1.40%.
Materials, accounting for approximately 2%, resource stocks were under pressure overall: BHP Group (ASX:BHP) down 1.45%, Mineral Resources (ASX:MIN) down 2.72%.
Uranium prices fluctuated significantly due to a sharp decline: Paladin Energy (ASX:PDN) down 9.41%, Deep Yellow (ASX:DYL) down 7%.
Outstanding performers:
Zip Co Ltd. 5.46% - Buy-now-pay-later sector rebounded
GQG Partners Inc DRC. 5.04% - Australian dollar investment management business performed well
Temple & Webster Group Ltd 5.15% - Australian dollar online retail demand remained stable, home goods sector recovered
Perpetual Ltd 3.50% Australian Dollar Asset Management Business Grows
IDP Education Ltd 2.51% International Education Market Recovery
Technical Analysis:
On Tuesday, the ASX200 experienced a "V-shaped" pattern. It fell sharply in the morning due to expectations of an interest rate hike triggered by strong US employment data, and then gradually rebounded, driven by defensive sectors (telecommunications, consumer staples, and healthcare). Resource stocks (especially gold and mining) were the main drag, while defensive and some growth stocks performed relatively well, indicating that the market is rotating from cyclical stocks to defensive sectors. It closed at 8604.2 points, down 0.24% on the day, marking its third consecutive day of decline; the intraday low was 8490.9 points. The ASX200 is below the 200-day moving average (a mid-term support/resistance level): 8786.9 points, indicating a weak mid-term trend. The 21-day moving average provides short-term support around 8580, and the closing price barely held above this level. Additionally, the 5/10-day moving averages act as resistance, compressing the rebound potential. The RSI indicator remains below the 50 neutral line, showing no significant oversold condition, indicating that the downward momentum has not completely exhausted. Simultaneously, the volume during the decline is high, while the volume during the rebound is low, suggesting that the bears have the upper hand.
Trading Strategy:
The following are only technical trading ideas and do not constitute investment advice. Leveraged trading may result in losses exceeding the principal.
(1) Short Selling (Predominantly Bearish)
1. Entry Conditions
• If the rebound reaches 8680–8700 and encounters resistance, and the hourly candlestick closes negative, a small short position can be taken.
• If the rebound reaches 8760–8786 (200-day moving average) and encounters resistance, it presents a good opportunity to short. 2. Stop Loss and Take Profit
• Stop loss for short positions: 40-60 points above the entry point;
• First take profit: 8500-8490; second take profit: 8400;
• If the 8480 support level holds, reduce the position to take profit; if it breaks, hold and expect a deeper correction.
(2) Long Positions (Only target support rebounds, be cautious about bottom fishing)
1. Conservative Long Positions
• Buy on dips when the price stabilizes in the 8480-8490 range and a bullish reversal pattern appears on the hourly chart;
• Strictly place the stop loss 30 points below 8470;
• First target: 8600; second target: 8680. Exit in batches at resistance levels, do not overstay your position. Key Risk Warnings:
Highly Concentrated Index Weighting: Resources and banks combined account for over 50% of the index; a sharp drop in a single sector can trigger a rapid decline in the index. Leveraged CFD/Futures Risks: Under high leverage, even small adverse fluctuations can trigger margin calls; strict stop-loss orders are essential.
Hong Kong Hang Seng Index
Basic Market Overview:
The Hang Seng Index fell 91 points, or 0.4%, to close at 24,566 on Tuesday, marking its fifth consecutive day of decline and hovering near its lowest level since the end of March. Market sentiment remained fragile despite reports of easing tensions in the Middle East following a ceasefire between Israel and Iran, and improved optimism regarding AI-related stocks. Financials, retail trade, and energy and mining sectors saw losses, while some technology stocks rose. Significant declines included AIA (-2.2%), Pop Mart (-1.4%), Knowledge Graph Technology (-12.8%), and Xiaomi (-0.7%). In contrast, Tencent rose 1.8%, and SMIC rose 3.2%, helping the benchmark index recover from earlier losses. Despite stronger-than-expected Chinese trade data, with both exports and imports exceeding expectations due to increased global demand for technology hardware, investors remain cautious about the overall pace of China's economic recovery.
Sector Performance:
Leading Gainers:
PCB / Copper Clad Laminate (Strongest Theme of the Day)
Logic: AI computing power drives up prices for electronic fabrics and substrates, leading to an upward trend in the industry chain.
• Kingboard Holdings (00148) +25.23%
• Guanghe Technology (01989) +15.72%
• Kingboard Laminates (01888) +12.60%
• Shenghong Technology (02476) +12.53%
Semiconductors / Integrated Circuits / Optical Communication
• ASMPT +9.06%, Yangtze Optical Fibre and Cable +9.05%, Tianshu Intelligent Chip +11%, SMIC +4.07%
Private healthcare and military sectors saw slight gains; some high-quality tech stocks showed mixed performance: Tencent, Meituan, and Lenovo Group rose by over 1%–3%.
Leading Losers:
Oil & Petrochemical / Oil & Gas Services (Top Decline)
Easing geopolitical tensions dampened oil price expectations: Shandong Molong -17.95%, Shengli Pipeline -13.58%, Baiqin Oilfield Services -12.8%, PetroChina -4%
CXO / Biopharmaceuticals: WuXi AppTec -3%~5%, Fangda Holdings corrected after previous sharp decline
Real Estate Services, Coal, Shipping, Some AI Large Model New Stocks
Real Estate & Property Management: Jiedi Group, Fangyuan Life Services fell sharply
Coal: Yankuang Energy -4%+
AI Application Stocks: Zhipu AI -13%, MINIMAX-W -8%
Large-cap tech stocks diverged and weakened: Alibaba, Bilibili, SenseTime, Xiaomi closed slightly lower
Technical Analysis:
Hang Seng Index Closing Point: 24565.90 points; Daily Change: -91.16 points, a decrease of 0.37%; Daily Range: High 24740.65, Low The Hang Seng Tech Index closed at 24486.39 points; turnover: HK$308.916 billion; while the Hang Seng Tech Index bucked the trend, rising 0.29% (4769.61 points); the Hang Seng China Enterprises Index fell 0.20%. The index is in a weak bottoming phase. If the support level of 24450 holds, a small rebound to test the resistance level of 24660 is expected; if it breaks below 24370, the adjustment space will further open up. Funds are clearly concentrated in AI hardware semiconductors and PCBs, while traditional energy, pharmaceuticals, and real estate are the destinations for fund outflows. Since the high of 26038 points on June 2nd, a continuous correction has begun, resulting in five consecutive days of decline, with the center of gravity continuing to shift downwards, indicating a weakening medium-term bullish trend. Technical indicators: KDJ: The daily chart is in the low end of the oversold zone, with the J value slightly turning downwards, indicating a slight need for a corrective rebound, but a valid golden cross has not yet formed; MACD: The green bars persist, and the DIF and DEA are running below the zero line, indicating that the bearish trend has not reversed; Meanwhile, the Hang Seng Index is consolidating in a narrow range, dipping slightly before recovering slightly during the day, indicating a marginal weakening of downward momentum, but no strong reversal signal, maintaining an overall weak and volatile pattern.
Trading Strategy (Primarily Short-Term)
Conditions for Long Positions
1. Fed signals interest rate cut, 10-year US Treasury yield declines, RMB exchange rate strengthens.
2. Southbound capital flows net in for three consecutive days, Hong Kong stock ETFs see capital inflows.
3. Domestic stimulus policies for real estate/consumption/industry, marginal easing of US-China relations.
4. Index stabilizes above 20/50-day moving averages with increased volume, constituent stocks generally outperform expectations.
Long Position Stop-Loss: A break below the entry point by 300-500 points; a single-day drop of over 1.8% with high volume warrants unconditional reduction of positions.
Conditions for Short Positions
1. US inflation rebounds, Fed postpones interest rate cuts, US Treasury yields surge.
2. Escalating geopolitical conflicts, soaring oil prices fuel stagflation concerns.
3. Large-scale share unlocking in June-July and December impacts liquidity (HKD 1.57 trillion unlocked for the year).
4. A Stocks weaken, southbound capital continues to flow out in large amounts, Hang Seng Index falls below medium-term moving average
Short stop loss: Enter on a rebound breakout above 300-500 points; close positions immediately to mitigate risk if US stocks surge.
Risk warning:
The Hong Kong dollar is pegged to the US dollar; a weaker RMB will suppress the willingness of domestic capital to flow south; a stronger RMB will drive foreign capital back to Hong Kong stocks.
The second half of 2026 will be the peak period for the lifting of share lock-up restrictions (June-July, September-October, December). Large-scale selling of restricted shares will temporarily drain market liquidity, suppressing the rebound's potential.
The Hang Seng Index is highly concentrated in terms of weighting: more than ten leading companies such as Tencent, Alibaba, HSBC, and AIA account for the vast majority of the index's weight; a single giant's financial report disappointing will directly drag the index down significantly.
Disclaimer: The information contained herein (1) is proprietary to BCR and/or its content providers; (2) may not be copied or distributed; (3) is not warranted to be accurate, complete or timely; and, (4) does not constitute advice or a recommendation by BCR or its content providers in respect of the investment in financial instruments. Neither BCR or its content providers are responsible for any damages or losses arising from any use of this information. Past performance is no guarantee of future results.
Lebih Liputan


Pendedahan Risiko:Instrumen derivatif diniagakan di luar bursa dengan margin, yang bermakna ia membawa tahap risiko yang tinggi dan terdapat kemungkinan anda boleh kehilangan seluruh pelaburan anda. Produk-produk ini tidak sesuai untuk semua pelabur. Pastikan anda memahami sepenuhnya risiko dan pertimbangkan dengan teliti keadaan kewangan dan pengalaman dagangan anda sebelum berdagang. Cari nasihat kewangan bebas jika perlu sebelum membuka akaun dengan BCR.
BCR Co Pty Ltd (No. Syarikat 1975046) ialah syarikat yang diperbadankan di bawah undang-undang British Virgin Islands, dengan pejabat berdaftar di Trident Chambers, Wickham’s Cay 1, Road Town, Tortola, British Virgin Islands, dan dilesenkan serta dikawal selia oleh Suruhanjaya Perkhidmatan Kewangan British Virgin Islands di bawah Lesen No. SIBA/L/19/1122.
Open Bridge Limited (No. Syarikat 16701394) ialah syarikat yang diperbadankan di bawah Akta Syarikat 2006 dan berdaftar di England dan Wales, dengan alamat berdaftar di Kemp House, 160 City Road, London, England, EC1V 2NX. Open Bridge Limited bertindak semata-mata sebagai pemproses pembayaran untuk BCR Co Pty Ltd dan tidak menyediakan sebarang perkhidmatan kewangan, perdagangan atau pelaburan bagi pihaknya. Peranan Open Bridge Limited adalah terhad kepada pemprosesan pembayaran.

 English
 简体中文
简体中文
 繁體中文
繁體中文
 Bahasa
Melayu
Bahasa
Melayu
 Tiếng
Việt
Tiếng
Việt
 ไทย
ไทย
 日本語
日本語
 한국어
한국어
 ភាសាខ្មែរ
 español


