


0
Currency & Commodity Analysis:
US Dollar Index
The US dollar index remained near 99 last week, close to a two-week low, and is expected to decline by about 0.45% in May. Investors continue to focus on developments in the Middle East, as mixed signals surrounding the US-Iran peace talks keep investors cautious about inflation risks and the interest rate outlook. Tehran stated that the latest US proposal has narrowed the differences between the two sides to some extent, although comments from Iran's Supreme Leader regarding the country's uranium reserves and disagreements over the passage fee in the Strait of Hormuz still cast a shadow over hopes for a breakthrough agreement. Meanwhile, the latest Federal Open Market Committee minutes showed that most policymakers believed that further interest rate hikes would still be appropriate if inflation persists above the Fed's 2% target.
The Strait of Hormuz carries approximately 20% of global seaborne crude oil, making market attention highly focused on developments in the region. Further disruption to shipping through the Strait of Hormuz could pose a new shock to the global energy supply chain, thereby pushing up international oil prices and global inflationary pressures. Against this backdrop, the US dollar continues to receive funding support as the world's primary safe-haven currency. Markets are concerned that an escalation of the Middle East situation could not only disrupt global energy supplies but also further impact global economic growth and financial market stability. Meanwhile, the latest FOMC meeting minutes released by the Federal Reserve in April further strengthened the support for the US dollar. At the same time, the Fed's concerns about inflation risks are clearly intensifying. Against the backdrop of unstable energy prices, the high-interest-rate environment in the US may persist for a longer period, which will continue to provide medium- to long-term support for the dollar. Overall, given that global risk aversion has not yet significantly subsided and the Fed maintains a hawkish stance, the US dollar index is expected to maintain a slightly bullish and volatile pattern in the short term.
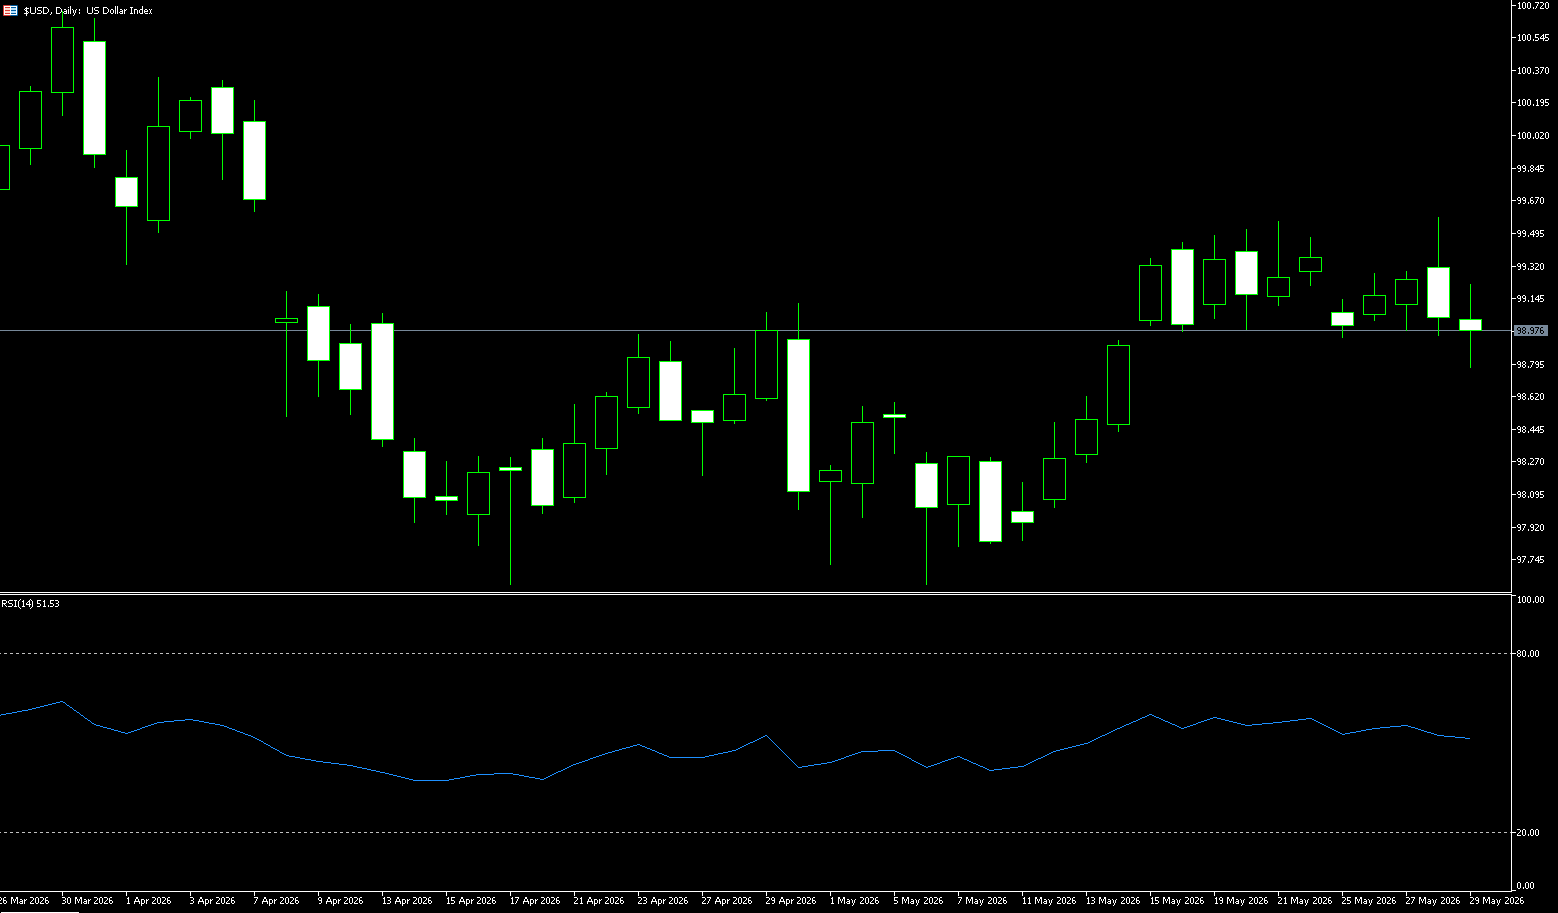
Last week, the US dollar index generally showed a pattern of initial rise followed by a high-level consolidation and decline, with the center of gravity remaining around 99.00. The bullish structure remains intact, but the short-term upward momentum has weakened marginally, entering a high-level consolidation phase. The medium-term bullish pattern of the US dollar index remains unchanged, but the short-term upward momentum has weakened, encountering resistance at high levels and entering a consolidation phase. Affected by the rise and fall of US Treasury yields and the marginal cooling of inflation expectations, the price has slightly retreated from its highs, which is a healthy adjustment after the rise, not a trend reversal.
From a technical perspective, the daily chart of the US dollar index still maintains an overall slightly bullish and volatile structure. The US dollar index rebounded after finding support around 98.20 and is currently trading above the 200-day moving average of 98.59. While the MACD indicator has shown some overbought conditions, it hasn't formed a clear death cross, indicating the medium-term bullish trend is not yet over. The RSI indicator remains around 51, suggesting a slight slowdown in bullish momentum, but the overall bias remains strong.
If the situation in the Middle East escalates further or the Federal Reserve continues to release hawkish signals, the US dollar index could have further upside potential. From a resistance and support perspective, the initial resistance level is around 99.71 (the upper Bollinger Band). A break above this level could lead to a further challenge of the psychological level of 100 and the 100.29 area (the high of April 6th). Key support levels are at 98.76 (the middle Bollinger Band), 98.59 (the 200-day moving average), and around 98.20. A break below these levels could lead to a correction in the US dollar index, potentially falling below the 98.00 level.
Today, consider shorting the US Dollar Index at 99.05, with a stop-loss at 99.15 and targets at 98.70 and 98.60.
WTI Crude Oil
WTI crude oil futures repeatedly fell last week, breaking below the psychological level of $90 per barrel, and are on track for significant losses this month, as reports surfaced that the US and Iran had tentatively agreed to extend the ceasefire for 60 days, potentially allowing unrestricted shipping through the Strait of Hormuz. The report also noted that Iran would clear all landmines from the waterway within 30 days. However, the report mentioned that President Trump has not yet approved the proposed terms, and Vice President J.D. Vance warned that the timing or even the possibility of reaching an agreement with Iran remains uncertain. US oil benchmarks have fallen more than 12% so far this month, despite increased optimism that some form of agreement will eventually be reached, but significant obstacles remain, including Tehran's nuclear ambitions, control of the Strait of Hormuz, and the lifting of sanctions.
International oil price volatility has intensified. The market has fully priced in expectations regarding summer demand, OPEC+ policy, and geopolitical events. Technical indicators are showing signs of divergence from sentiment, and the short-term trend is entering a critical juncture. Recent discussions in the oil market have intensified, with numerous supply and demand forecasts and geopolitical analyses emerging, most pointing to continued price increases. However, a clear expectation gap exists between current market sentiment and technical signals: on one hand, there is unanimous optimism among retail investors, and on the other hand, the trend momentum is gradually weakening.
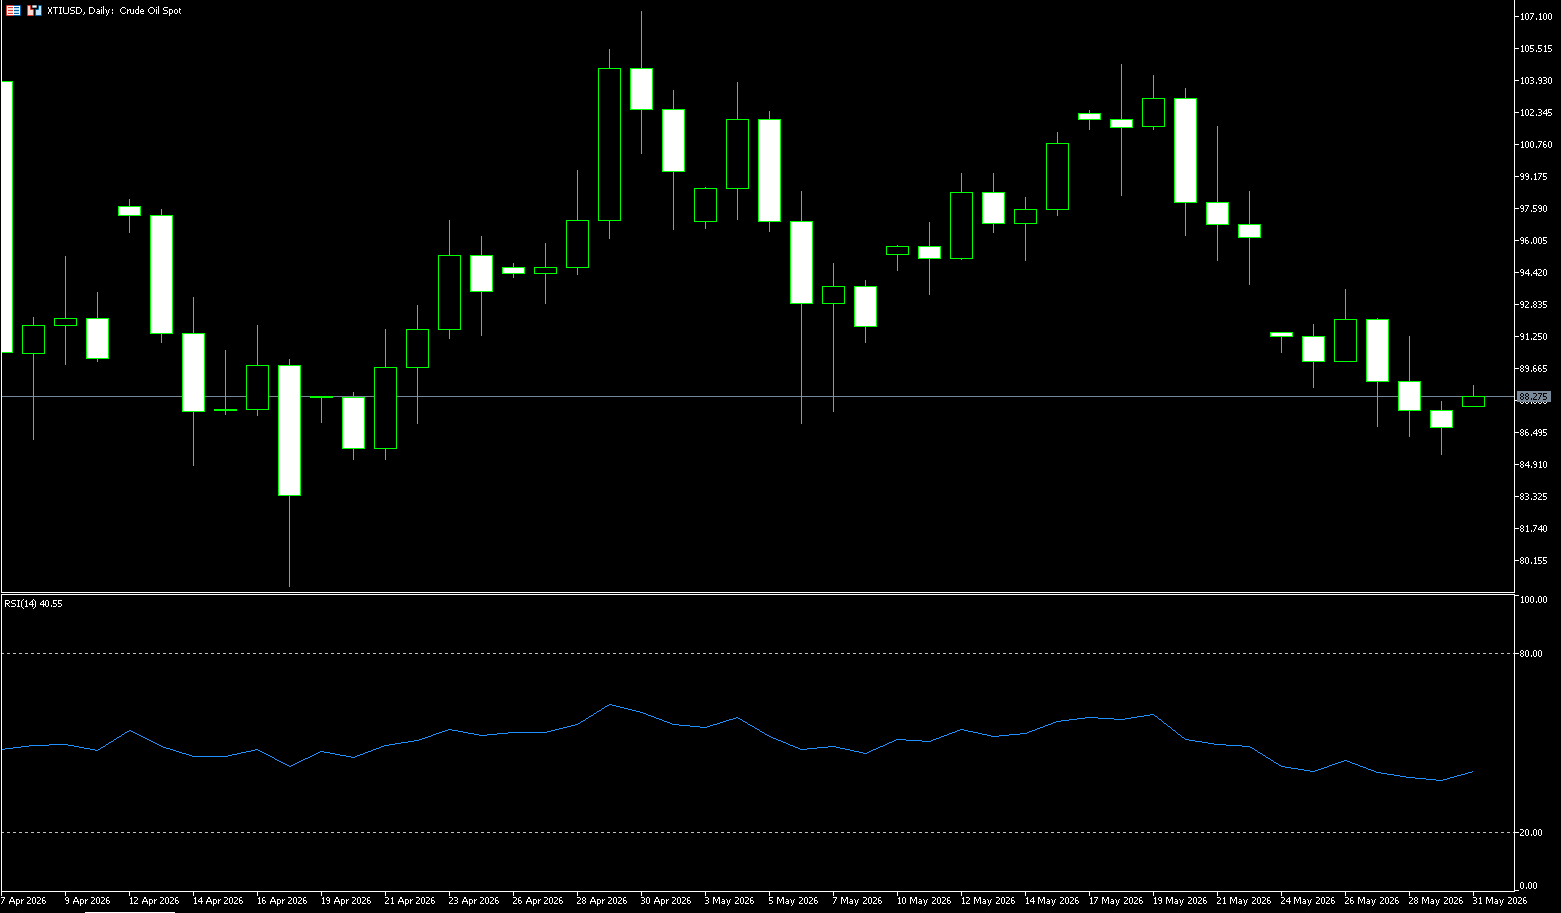
Last week, the complex interplay between the real and imagined situation in the Middle East remained a core issue that the market could not avoid. Without a genuine supply disruption, oil prices may continue to wait for the next catalyst within the $85-93 range. In the short term, escalating geopolitical conflicts and the potential blockade of the Strait of Hormuz are the core drivers of the oil price rebound, with negotiation disagreements and inventory changes jointly dominating market sentiment. In the medium term, the current optimism in the oil market harbors hidden risks. If supply disruptions become prolonged, it will trigger a chain reaction of rising inflation and interest rate hikes, leaving the global energy and financial markets facing high uncertainty. The daily chart technicals show a "head and shoulders" pattern; the left shoulder is in March; the head is at the April high of 107.35; and the right shoulder is in May. The neckline is at 90.00, which was decisively broken last week, with a target of 75.
From the daily chart, US crude oil is currently technically weak. In terms of moving averages, the price has broken below the 20-day moving average (95.68) and the 50-day moving average (94.91), and is currently around 86.80, testing the support of the previous month's low of 85.20 (the 20/4 low). Short-term moving averages are turning downwards, putting pressure on the price, and the trend has shifted from strong to weak. The RSI (14) is currently around 40, indicating weakness but not oversold, suggesting further downside potential. The 4-hour 30 is close to oversold, indicating a possible slight rebound in the short term. The MACD indicator shows a death cross with expanding green bars, indicating increased bearish momentum. The 4-hour green bars are shortening, slowing the decline and signaling an initial rebound. The Stochastic indicator has entered the oversold zone (<20), suggesting excessive short-term selling and a potential technical rebound, but unlikely to change the overall trend. Overall, oil prices are currently in a short-term correction channel, with key support at $85.20 (April 20 low) and $85.00 (psychological level). A break below these levels could lead to further declines to $80.00 (psychological level). Resistance is at $90.00 (psychological level) followed by $93.57 (last week's high). Failure to recover these levels will perpetuate the weak trend.
Today, consider going long on crude oil at 86.65, with a stop loss at 86.50 and targets at 88.00 and 89.00.
Spot Gold
Spot gold traded in a "low-to-high, wide-range oscillation" pattern last week. It continued its downward trend at the beginning of the week, before rebounding sharply after testing key support levels before the weekend. Overall, it was in a recovery phase after a large-scale correction. Gold held steady above $4,500 per ounce before the weekend, having recovered somewhat in the previous trading day as reports of a preliminary agreement between the US and Iran eased concerns about inflation and interest rates. Reports indicated that Washington and Tehran were prepared to extend the ceasefire agreement for 60 days and begin negotiations on Iran's nuclear program, while also considering unrestricted transport through the Strait of Hormuz. However, the report noted that President Trump had not yet approved the proposed terms, and Vice President JD Vance stated that it was still too early to determine the timing or likelihood of an agreement with Iran. Since the end of February, gold has faced strong selling pressure as the surge in oil prices triggered by the Iranian conflict exacerbated inflation concerns and strengthened expectations of tighter monetary policy.
The international gold market witnessed a dramatic reversal in the past trading day. Spot gold prices plummeted to a two-month low of $4,366.50 per ounce mid-week, but just as bears were celebrating their victory, the situation suddenly reversed. Gold prices subsequently staged a strong V-shaped rebound, ultimately not only recovering all losses but also breaking through the psychological barrier of $4,500 per ounce, staging a textbook "bottoming out and rebounding" pattern. The US gold futures market also performed strongly.
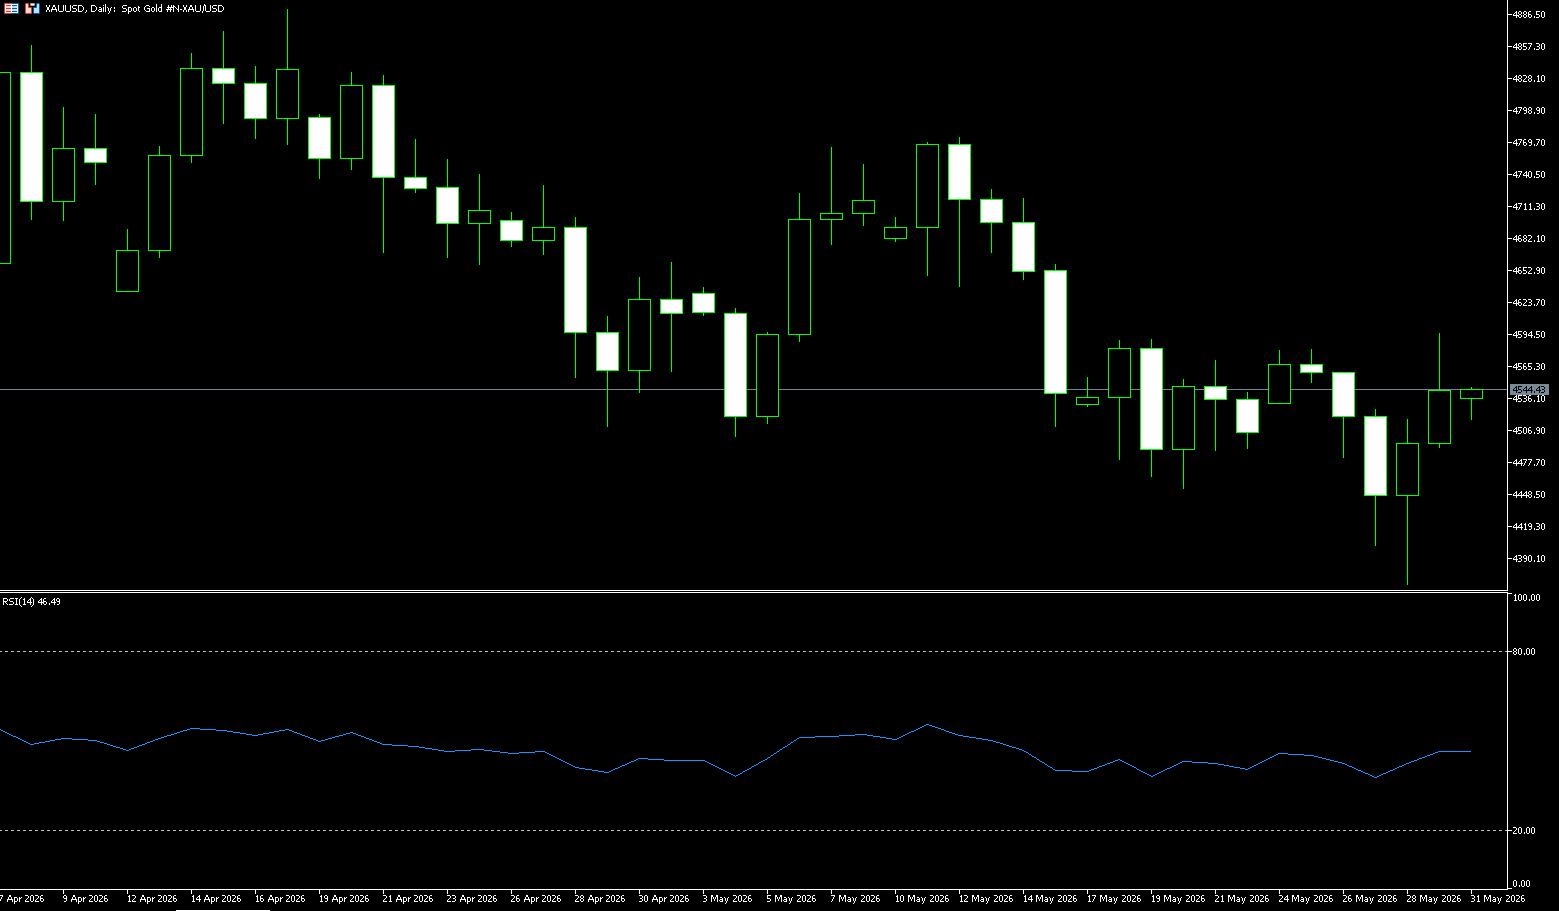
From a technical analysis perspective, the 210-day moving average at $4,355.50 is a "watershed" for distinguishing between long-term bull and bear markets: when gold prices are above the 210-day moving average, bulls are in control; a break below the moving average and a decisive close below it often indicates a greater downside risk. On May 28th, although the price briefly dipped below this line during the day, it ultimately held above this key level at the close, indicating strong buying support at this level. Meanwhile, looking at overbought and oversold indicators, the RSI (Relative Strength Index) had fallen to around 44, entering near-oversold territory, and the CCI (Commodity Channel Index) also issued an oversold signal, clearly indicating a strong technical demand for a "rebound after a sharp drop." Combined with the triangle consolidation pattern formed by continuous price compression throughout May, a significant directional breakout is poised to occur.
Gold's rebound from its lows last Thursday is of significant technical importance. $4366.50 was the lowest level since late March and was close to the 210-day moving average {4355.50}. The rapid rebound after testing this area suggests strong technical buying support at this level. The subsequent rise above $4500 also resulted in a long lower shadow bullish candlestick on the daily chart, a candlestick pattern typically considered a short-term bottoming signal. On the downside support level, the core support is distributed in the following area: the area between 4,366.50 (last week's low) and 4,355.50 (the 210-day moving average). This is currently the most critical defensive position; a decisive break below this level would severely damage market sentiment, and the risk of testing 4,306 (the low of March 24th) would increase rapidly. The psychological support level of 4,300 is significant, and it is also the trigger line for a "bear market scenario" set by some institutions. On the upside resistance level, the bulls need to break through the following levels one by one: the resistance formed by the support at 4,580 (last week's high) and 4,585 (the 20-day moving average), which is also a recent area of high trading volume. A successful recovery of these areas would be a crucial signal that the bulls have regained control. 5,000 is the generally accepted medium-term target price by institutions and a psychological marker of a full recovery in market confidence.
Today, consider going long on gold at 4,4532, with a stop-loss at 4,525 and targets at 4,580 and 4,600.
AUD/USD
The Australian dollar traded mostly above US$0.7180 last week and is expected to decline by about 0.26% this month as the market lowered expectations for further interest rate hikes following signs that early monetary tightening was beginning to seep into the economy. This follows lower-than-expected inflation data in April and weak consumer spending data earlier this week, with recent signs of a cooling labor market prompting investors to drastically reduce the probability of a June rate hike to just 5%. The market still expects a 70% chance of a final rate hike to 4.6% in the last quarter of this year. The focus now shifts to a series of economic data next week, and despite the decline this month, the Australian dollar is still on track for a modest weekly gain as reports of a preliminary agreement between the US and Iran, including the potential reopening of the Strait of Hormuz, boosted global risk sentiment.
In summary, market optimism regarding a US-Iran peace agreement put pressure on the US dollar, but the pullback was limited, and technical indicators suggest the dollar may still move towards 100. The Australian dollar fell from a high of 0.7277 against the US dollar, briefly dropping to around 0.7100, before rebounding to 0.7180 driven by optimism surrounding the US-Iran negotiations. However, with the US dollar index still targeting 100, the upside potential for the Australian dollar is limited. The euro/AUD pair may see a rebound if it holds its support. In the short term, the direction of the currency market remains highly dependent on substantial progress in the US-Iran negotiations; traders should be wary of the risk of a market reversal due to a "false dawn."
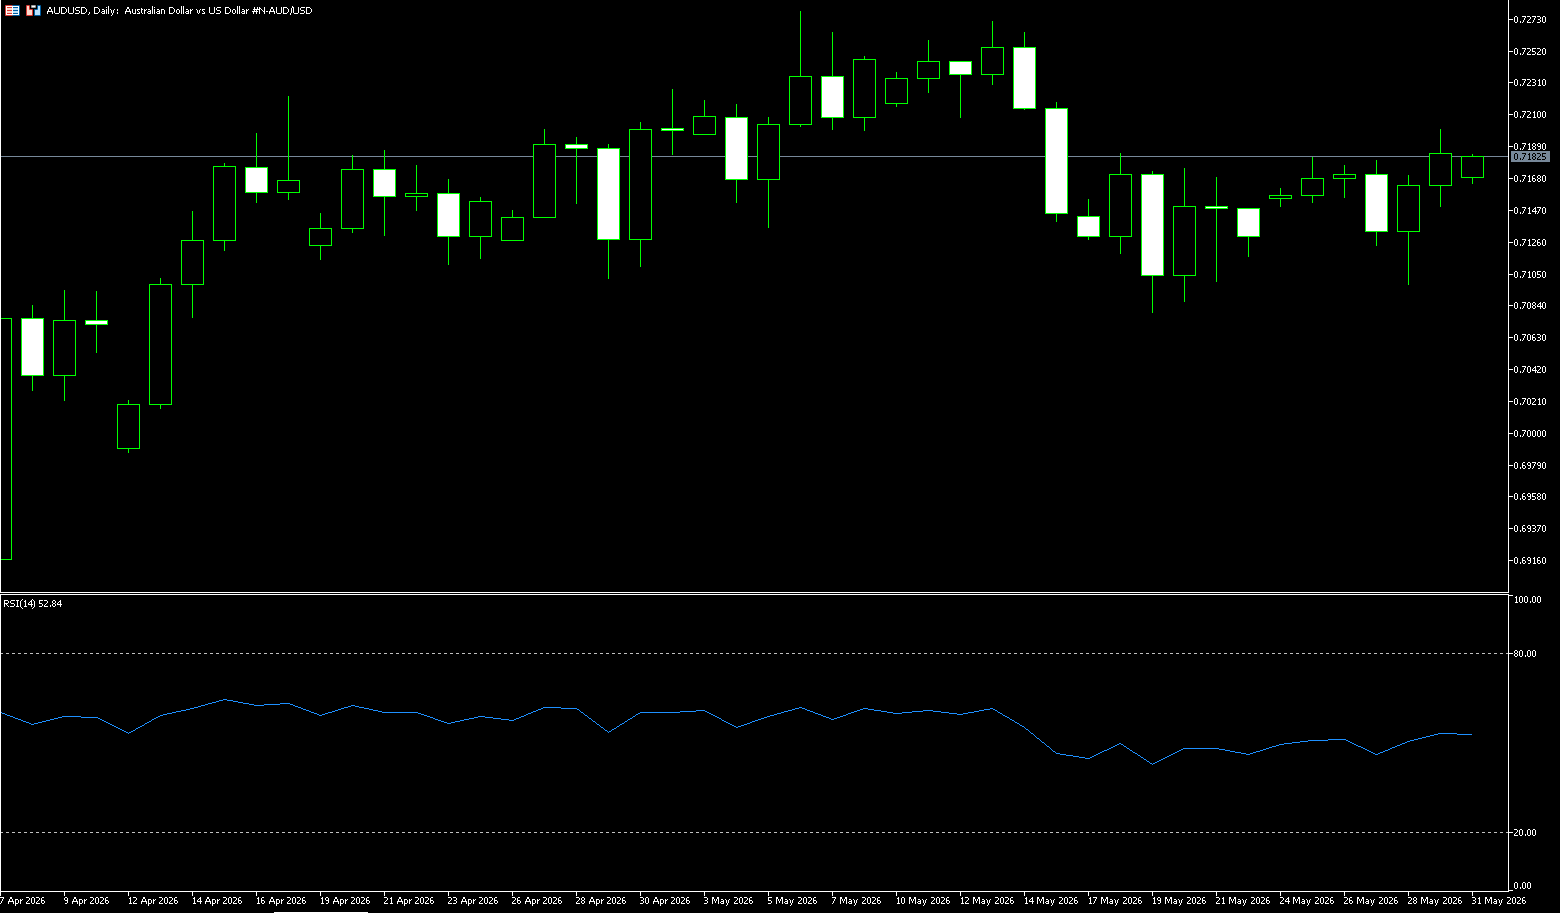
Last week, the Australian dollar/US dollar pair generally exhibited a narrow range-bound trading pattern at high levels, with a slightly bullish bias. The price fluctuated repeatedly within the 0.7070-0.7200 range, closing near 0.7180 before the weekend. The bullish and bearish momentum is balanced, with no clear unilateral signal yet, awaiting a breakout to confirm the direction. The Australian dollar is currently trading around 0.7180 against the US dollar, in a consolidation phase after its recent rebound. Several technical indicators show a neutral to slightly bearish signal. Regarding the moving average system, the short-term MA5 (0.7160) and MA10 (0.7153) are roughly in line with the current price, while the MA20 (0.7151) is above the current price, forming short-term resistance. The MA50 (0.710), MA100 (0.7048), and MA200 (0.6813) are below the current price, forming medium-term support. This arrangement of the price "between the MA20 and MA50" suggests that the Australian dollar is at a critical juncture, facing short-term pressure but still possessing medium-term support.
As for the MACD indicator, the DIFF line is at 0.0006, and the DEA line is at 0.0017. The DIFF has crossed below the DEA, forming a death cross signal, but the angle of the death cross is extremely gentle. The MACD histogram is -0.0022, a negative value but with a very small amplitude, indicating very weak bearish momentum and a stalemate between bulls and bears. The RSI indicator is slightly above the 50 neutral level, indicating a slight but not significant advantage for the bears. This reading is in neutral territory, suggesting further room for two-way fluctuations and that the market has not yet entered oversold territory. However, this only suggests that the pressure has stabilized and has not yet clearly broken through the current upper limit. Therefore, a sustained hold above this area is needed to alleviate the current pressure and expose the psychological resistance level around 0.7200; the next resistance level is 0.7270, the four-year high reached earlier this month. Further resistance points to the psychological level of 0.7300. On the downside, initial support is at the 0.7100 level and 0.7097 (last week's low); the next deeper retracement support is at 0.7048 (the 100-day moving average). A decisive break below the latter would reopen the path to the key psychological support level of 0.7000.
Consider going long on the Australian dollar today at 0.7170, with a stop-loss at 0.7160 and targets at 0.7220 and 0.7240.
GBP/USD
The pound accelerated its climb against the dollar, breaking through 1.3480 before the weekend to reach a three-day high. The pound's further gains stemmed from a sell-off in the dollar amid improved geopolitical conditions and a general buying preference for risk assets. The pound was trading around $1.3450 at the end of May and is expected to have lost more than 1% against the dollar this month. This decline occurred against a backdrop of rising political uncertainty, with Prime Minister Keir Starmer's Labour Party suffering defeats in local elections and ongoing negotiations between the US and Iran to end the three-month war, all of which have exacerbated global inflationary pressures. A preliminary agreement to extend the ceasefire for 60 days still awaits approval from President Donald Trump.
The current decline in the pound against the dollar is mainly due to the combined effects of increased demand for the safe-haven dollar and a cooling of expectations for a Bank of England interest rate hike. Escalating tensions in the Middle East have driven the dollar index higher, while weak UK economic data has weakened market confidence in further tightening by the Bank of England. As the yield advantage of the UK diminishes, the pound's attractiveness relative to the dollar has declined. Furthermore, if UK economic growth continues to slow, the Bank of England's future policy space may be further limited. Meanwhile, as UK inflation remains above its long-term target, the Bank of England is unlikely to fully shift to an easing policy in the short term. Therefore, the medium- to long-term trend of the pound will depend on the performance of the UK economy, global risk sentiment, and the policy differences between the Federal Reserve and the Bank of England.
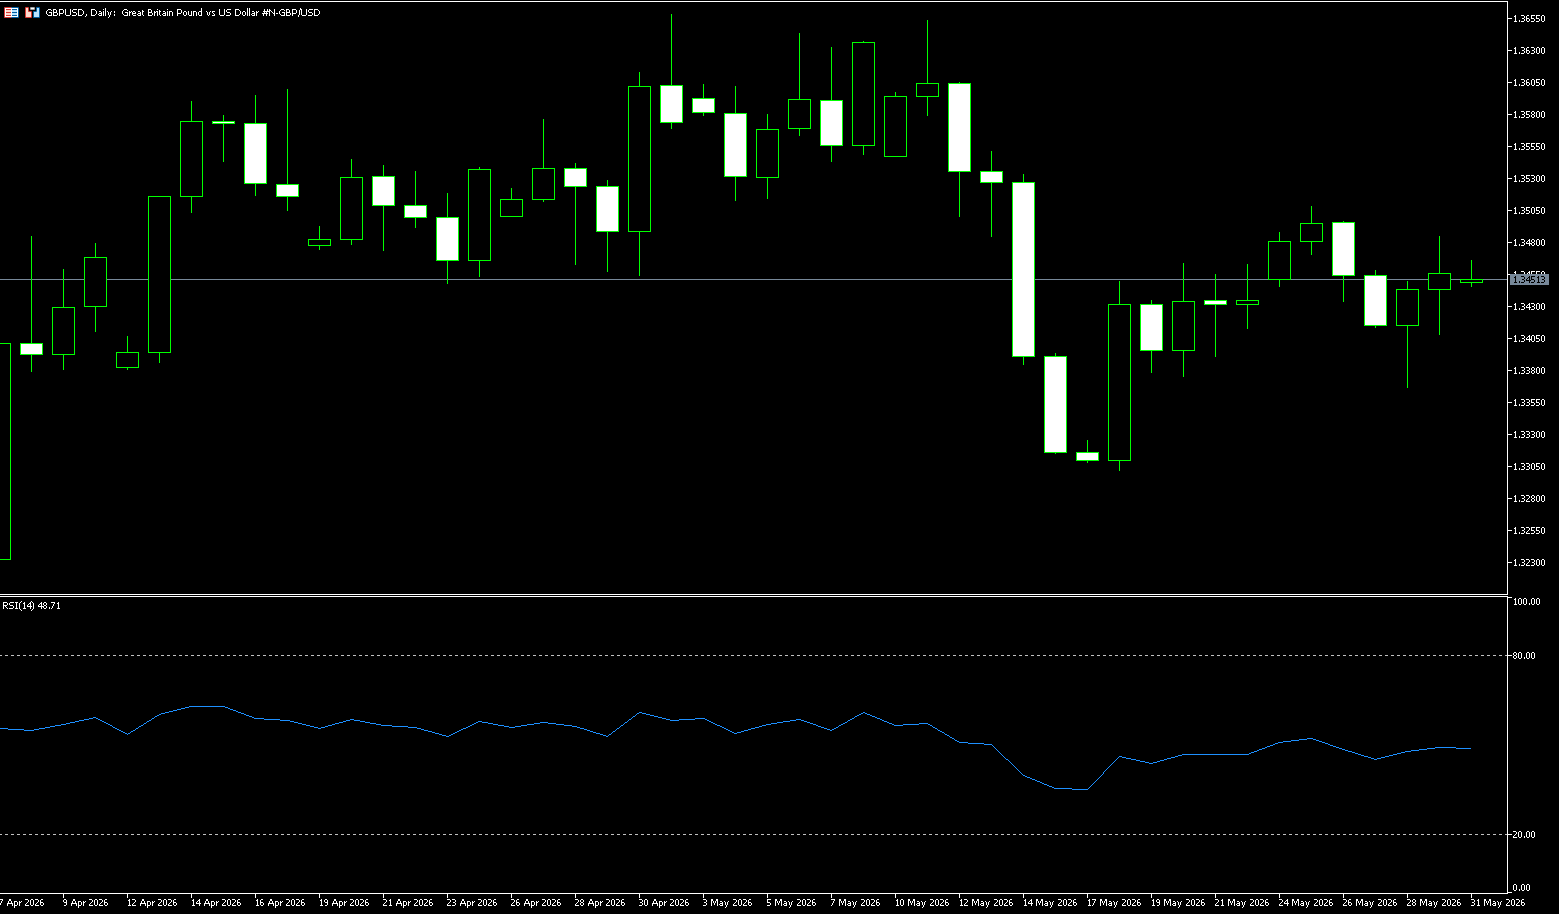
Last week, the pound against the dollar maintained a consolidation pattern, with a balance between bullish and bearish forces. The key range was 1.3330-1.3530, and the technical chart showed a "compression pattern," suggesting a possible directional breakout of around 150 points in the short term. Overall, the pound against the dollar is currently under the dual pressure of a stronger safe-haven dollar and weaker UK economic data, and changes in the Middle East situation will be a crucial factor determining the next stage of the exchange rate's movement. The 9/50/100-day moving averages are converging in the 1.3440-1.3480 range, forming a "compression zone." Historically, this pattern often foreshadows a major breakout. The 14-day RSI is at 48, in the neutral range, indicating a balance between bullish and bearish forces with no clear directional signal. The MACD, on the daily chart, shows a continued high-level death cross, with bullish momentum contracting and the histogram hovering near the zero line, indicating weakening upward momentum.
Technically, the GBP/USD pair maintains a wide-range trading pattern. After rebounding from the early April low of 1.3180, it failed to break through the previous high of 1.3655-1.3658, forming a potential "double top" pattern. Since the pair has broken below the key short-term support levels of 1.3500 (a psychological level) and 1.3476 (the 100-day moving average), the overall short-term structure is bearish. From another perspective, the GBP/USD exchange rate is approaching the psychological resistance level of 1.35. The pair continued its rebound, approaching the 20-day moving average at 1.3482, and the high of 1.3485 from last weekend, indicating a slightly positive short-term trend. Broader upside resistance is at 1.3550 (the high of May 13th), a break above which would target the psychological level of 1.3600. On the downside, the May 22nd low of 1.3413 is a major support zone; a daily close below this level would expose further downside risk, targeting the May 20th low of 1.3375.
Today, consider going long on GBP at 1.3438, with a stop-loss at 1.3425 and targets at 1.3500 and 1.3490.
USD/JPY
The yen received long-awaited data but had little reaction. Tokyo's overall CPI rose 1.6% year-on-year in May. This data largely met market positioning expectations and was below the Bank of Japan's 2% target. The yen's reaction was merely a shrug, and that's the whole story. Yen exchange rate fluctuations are highly correlated with the Japanese bond market, with the core logic revolving around fluctuating expectations of Bank of Japan policy and potential currency intervention. Previously, the Japanese Ministry of Finance intervened multiple times during rapid USD/JPY appreciations to prevent excessive yen depreciation from impacting the domestic economy and financial markets. Therefore, despite the overall strength of the US dollar, some traders remain cautious about further gains in USD/JPY. Furthermore, the Bank of Japan's policy path is also worth noting. Although Japanese inflation has rebounded somewhat, the overall Japanese economic recovery remains weak, and the Bank of Japan remains relatively cautious about normalizing monetary policy, which limits the yen's upside potential.
The current core logic behind the USD/JPY rise mainly stems from the escalating tensions in the Middle East, increasing energy risks, and the market's renewed expectation of high interest rates from the Federal Reserve. Because the Japanese economy is highly dependent on energy imports, the negative impact of rising international oil prices on the Japanese economy is significantly stronger than on the US, thus weakening the yen's performance. Technically, USD/JPY is approaching the key psychological level of 160, and the overall trend remains bullish. However, due to the possibility of further intervention in the foreign exchange market by the Japanese government, the market remains cautious about further price increases. Investors should pay close attention to changes in US Treasury yields, developments in the Middle East, and the Japanese government's attitude towards exchange rate fluctuations. If the Federal Reserve continues its hawkish stance and the Japanese economy remains weak, there is still room for further upward movement.
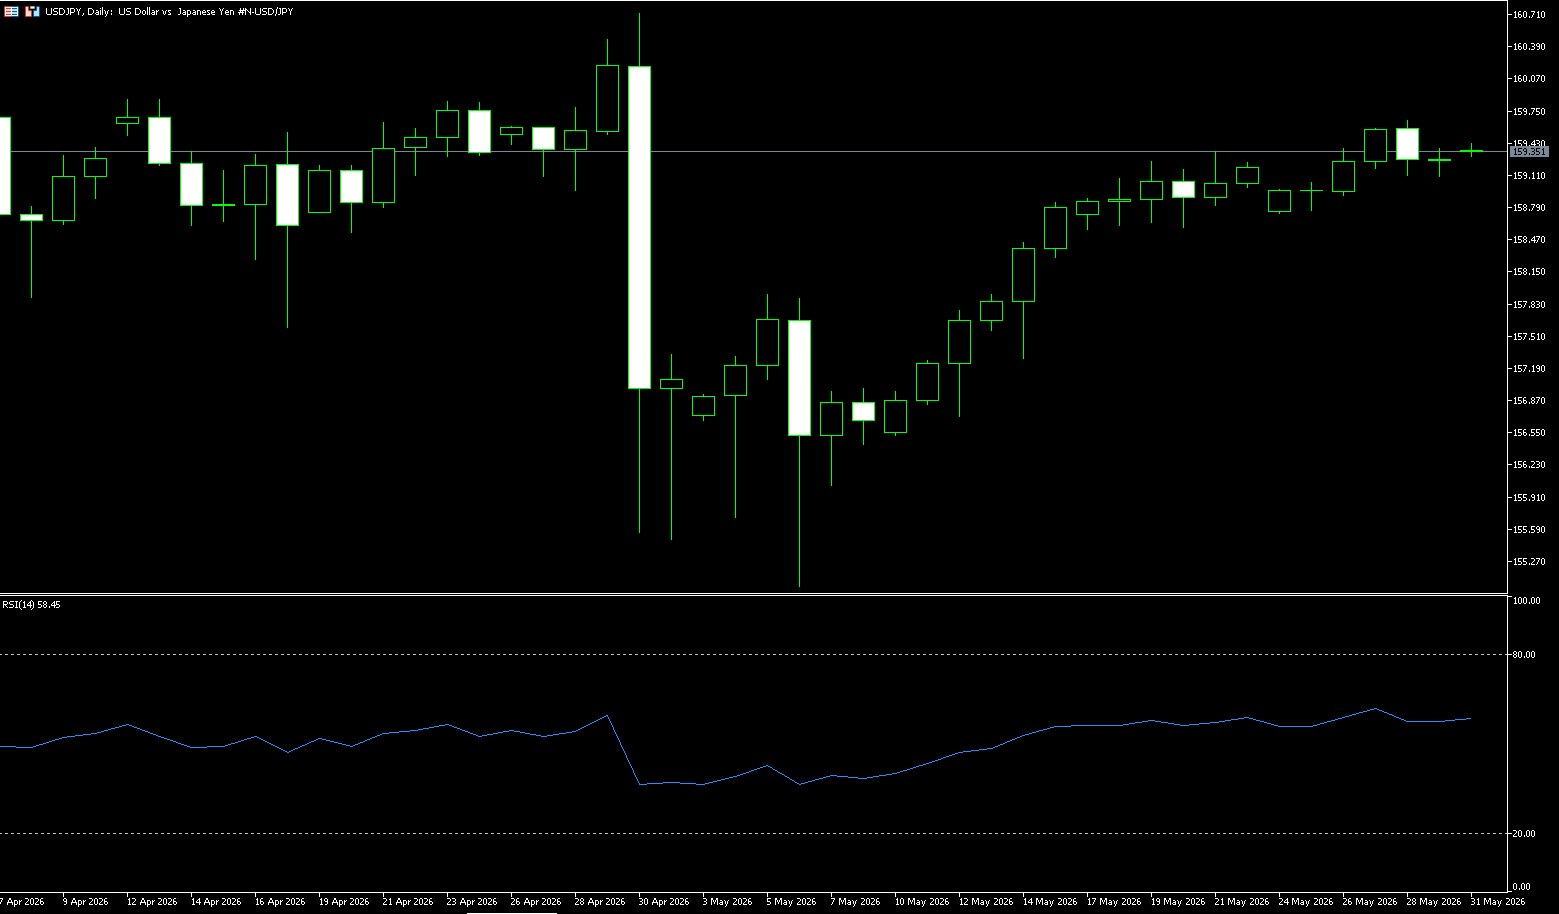
Last week, the USD/JPY pair generally traded in a high-level consolidation with a bullish bias, fluctuating between 158 and 160. Constrained by expectations of intervention at the 160 level, the upward momentum slowed, but the short-term bullish structure remained intact. The daily chart maintains an upward channel, but 160 represents strong psychological and policy resistance, leading to increased volatility at high levels and weakening upward momentum. Regarding the moving average system, the exchange rate is firmly above the 20/50/100-day moving averages, showing a bullish alignment; the 50-day moving average (158.81) provides strong support, and a breach of this level would weaken the short-term trend. The RSI (14) is around 56, indicating strength but not overbought conditions, suggesting that upward momentum remains but is slowing, and caution is advised regarding the risk of divergence at high levels. As for the MACD, it's above the zero line, with the red bars shortening and then slightly rebounding. Bullish momentum is weakening but hasn't reversed, suggesting a high probability of consolidation.
From the daily chart, USD/JPY has successfully broken through the previous key resistance area and maintained an upward trend for several consecutive trading days. The first major resistance level is currently at the 160.00 psychological level. Since this area is also a sensitive area for intervention by the Japanese government, the market is cautious about further gains. If it breaks through 160 and continues to rise, it may further test the 160.80 and 161.50 areas. On the downside, the first support levels to watch are 158.81 (50-day moving average) and 158.75 (last week's low). A break below these levels could slow short-term bullish momentum to the 158 psychological level and the 157.68 (100-day moving average) level.
Today, consider shorting the US dollar at 159.45, with a stop loss at 159.60 and targets at 158.50 and 158.60.
EUR/USD
The euro stabilized around $1.1650 on the last trading day of May, with a projected monthly loss of 0.8% against the dollar. New inflation data from Europe's largest economies is providing clues about the ECB's policy direction, while progress in US-Iran peace talks is being closely watched. Quick data shows that EU-wide inflation accelerated in France, Italy, and Spain in May, while slowing in Germany, but all countries' inflation rates remained well above the ECB's 2% target. ECB meeting minutes indicated that some policymakers might support an April rate hike if suggested, strengthening expectations for a 25 basis point increase at the June 11 meeting.
Meanwhile, the White House announced that the US and Iran reached a memorandum of understanding to extend the ceasefire for 60 days to allow for formal negotiations, although President Trump has not yet approved it. Elsewhere, geopolitical tensions escalated, with a Russian drone attack on a building in Galatsk, Romania, part of a broader attack on Ukrainian infrastructure near the border. The current euro's decline against the dollar is primarily driven by the strengthening of the safe-haven dollar due to escalating tensions in the Middle East and renewed market expectations that the Federal Reserve will maintain high interest rates. Meanwhile, the potential impact of high energy prices on the European economy further weakened the euro's performance.
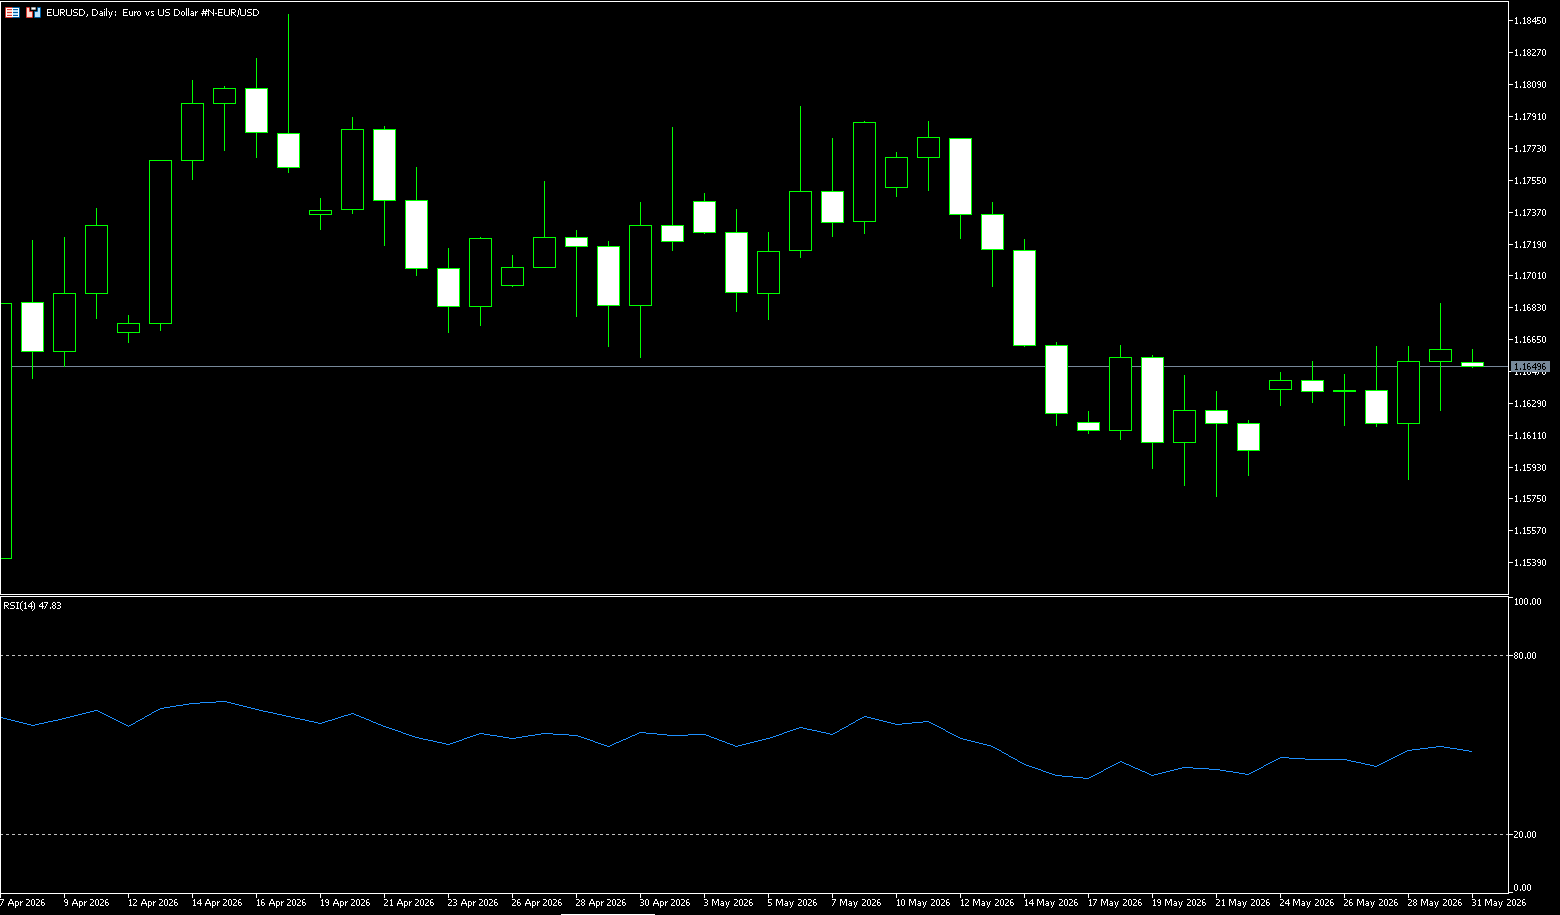
Last week, the euro/dollar pair generally retreated from its highs, consolidating within a narrow, weak range, with the center of gravity gradually shifting downwards. The key support zone of 1.1570-1.1600 was repeatedly tested, with weak rebounds, and the short-term bearish trend remains unchanged. Technically, the euro/dollar has broken below the key support area, and the overall short-term structure is bearish. From a technical perspective, the euro/dollar exchange rate is holding above the 23.6% Japonach Fibonacci retracement level of the April-May decline at 1.1638. Furthermore, the Relative Strength Index (RSI) is around 49, and the Moving Average Convergence Divergence (MACD) indicator is slightly positive, suggesting improved momentum. This, in turn, supports further intraday appreciation, although hawkish bets from the Federal Reserve may limit dollar losses and suppress spot prices.
From a daily chart perspective, EUR/USD has recently broken below the key support area of 1.1700 and continues to trade below short-term moving averages, indicating a bearish overall technical structure. The first major support levels are currently at 1.1600 (the psychological level) and the 1.1550 area. A break below these levels could lead to a further test of the 1.1500 psychological level. On the other hand, any subsequent upward movement is more likely to encounter immediate resistance near the 38.2% Fibonacci retracement level, around 1.1675-1.1680. Next is the confluence of levels around 1.1700; a break above this level could see EUR/USD target the 61.8% Fibonacci retracement level around 1.1740 and the 78.6% Fibonacci retracement level around 1.1785, potentially challenging the cycle high of 1.1842.
Today, consider buying Euros at 1.1645, stop loss: 1.1633, target: 1.1690; 1.1700
Stock Analysis:
Australian ASX 200 Stock Index
Basic Market Overview:
The Australian Securities Exchange (ASX) 200 index rose 139 points, or 1.6%, to 8,732 on Friday, erasing the previous day's weakness. Broad gains were led by electronics, non-energy mining, consumer durables, and financial stocks. Market sentiment improved following reports that the US and Iran had reached a memorandum extending the ceasefire for 60 days, although President Trump is said to have not yet approved the memorandum. Locally, expectations for further interest rate hikes eased as overall inflation in April fell short of expectations, employment unexpectedly declined, and household spending decreased.
Sector Performance:
Leading Gains: Materials (+2.89%), Property REITs (+1.84%), Technology (+1.68%), driven by a rebound in metal prices and expectations of interest rate cuts.
Leading Losers: Energy (-0.14%), Utilities (-0.28%), dragged down by falling oil prices.
Outstanding stocks: BHP Billiton (2.9%); Rio Tinto (1.2%); Evolution Mining (4.3%) and Northern Star (3.4%).
Technical Analysis:
Last week, the ASX200 exhibited a V-shaped pattern of "initial decline followed by a strong rebound on Friday," remaining within the 8,600-8,850 range. While short-term sentiment is bullish, it has not broken through key resistance levels. As of the close on May 29th, the index stood at 8,731.7 points, a weekly gain of approximately 0.9% and a monthly gain of approximately 0.8%. Short-term moving averages are flat, while medium-term moving averages are trending downwards, indicating the consolidation pattern remains unchanged. However, Friday's rebound reversed the short-term bearish trend. Currently, the 20-day moving average at 8,650 has been tested multiple times and found support, providing strong short-term support. After Wednesday's sharp drop, the RSI fell to around 44, approaching oversold levels; after Friday's rebound, it rose to 50-55, indicating a neutral-to-bullish bias with no overbought or oversold conditions. While momentum is recovering, the probability of a continued rebound is increasing, but it hasn't yet reached a strong trading range. Last Friday's trading volume reached 1.882 billion, the highest of the week, indicating a breakout with increased volume and significant capital inflow. It has been trading between 8,600 and 8,850 for the past month; the strategy before a breakout is to buy low and sell high.
Short-term trend assessment (1-2 weeks): Slightly bullish with fluctuations. Friday's high-volume rebound established a bullish tone, but a break above 8,800 is needed to confirm strength. Medium-term (1-3 months): Range-bound trading (8,400-9,000), awaiting catalysts from interest rate policies or geopolitical events.
Trading strategy:
Long: Enter in batches on pullbacks to 8,650-8,700, stop loss at 8,580, target 8,800, breakout target 8,950-9,000.
Short: Consider shorting on pullbacks after encountering resistance at 8,800-8,850, stop loss at 8,880, target 8,700-8,650. Key Risk Warnings:
Geopolitics: Recurring tensions in the Middle East and oil price volatility impact the energy sector and overall risk appetite.
Interest Rate Expectations: Australian inflation data and the pace of the RBA's policy shift affect the financial and real estate sectors.
External Markets: Volatility in US and Hong Kong stocks influences capital flows into Australian stocks.
Dow Jones Industrial Average
Basic Market Overview:
US stocks hit record highs on Friday as the market assessed the sustainability of the AI rally and evaluated the Middle East oil supply outlook and its impact on inflation. The S&P 500 and Nasdaq both rose 0.2%, while the Dow Jones Industrial Average rose 0.7%. On a monthly basis, the Nasdaq rose over 8%, the S&P 500 rose 5%, and the Dow Jones Industrial Average rose 3%. Yesterday, reports indicated that the US and Iran had agreed to a 60-day memorandum to extend the ongoing ceasefire and begin the process of resuming ship traffic through the Strait of Hormuz, although President Trump has not yet signed the agreement. Lower energy prices and bond yields provided broad but modest support for the stock market.
Sector Performance:
Leading Gainers: ServiceNow (NOW): Weekly gain of **+14%**, driven by AI-powered office solutions.
Oracle (ORCL): Weekly gain of **+10.8%**, driven by both database and AI.
Microsoft (MSFT): Weekly gain of **+5%**, driven by accelerated Copilot revenue.
Snowflake (SNOW): Weekly gain of **+36%**, driven by a turning point in cloud data demand.
Leading Losers: Lumentum (LITE): Weekly loss of **-4.5%**, driven by slowing demand for optical modules.
Corning (GLW): Weekly loss of **-4%**, driven by pressure on its communications glass business.
Intel (INTC): Weekly loss of **-3%**, driven by slower-than-expected process technology progress.
Outstanding Stocks: Microsoft rose 5%, Oracle rose over 10%, driven by new investment in Anthropic for its AI software. Dell also saw its stock price surge nearly 33% after raising its latest guidance for its AI server business.
Technical Analysis:
Last week, the Dow Jones Industrial Average exhibited a strong bullish pattern, first consolidating before accelerating upwards. On Thursday (May 29th), it firmly established itself above the 51,000-point mark for the first time, closing the week at 51,032.46, a weekly gain of approximately 1.1% and a monthly gain of approximately 2.78%. Five consecutive weeks of gains, with a strong upward trend along the 5-week moving average, indicate a healthy bullish trend with no signs of reversal. After breaking through 50,000 points in late April, an upward channel was formed. This week, after retracing to the lower edge of the channel (50,300–50,400), a strong rebound occurred. The channel slope is upward, indicating bullish dominance. Thursday's trading volume reached 9.0794 million lots, significantly higher than the previous two days, with volume and price moving in tandem, suggesting a high degree of validity for the breakout. The MACD (daily chart) indicator shows a continued golden cross above the zero line, with expanding red bars, strengthening bullish momentum, and no bearish divergence signals. RSI (14): 68-70 range, approaching overbought but not yet turning downwards, indicating continued short-term strength; however, a slight pullback should be anticipated.
Conclusion: The Dow Jones broke out strongly last week, confirming the bullish trend. The probability of continued upward movement in the short term is high. Watch the support level at 50600 and the resistance level at 51200. Buying on dips is recommended, but be wary of the risk of consolidation after overbought conditions.
Bull Scenario (70% probability): After stabilizing above 51000, the upward trend continues, targeting 51200→51800; a pullback to 50600-50800 presents a buying opportunity. As long as 50300 holds, the bullish structure remains intact.
Pullback Scenario (30% probability): The RSI is approaching overbought levels, potentially leading to consolidation within the 50800-51000 range. If a significant drop below 50600 occurs, a short-term pullback to around 50300 is expected, but the bullish trend remains intact.
Disclaimer: The information contained herein (1) is proprietary to BCR and/or its content providers; (2) may not be copied or distributed; (3) is not warranted to be accurate, complete or timely; and, (4) does not constitute advice or a recommendation by BCR or its content providers in respect of the investment in financial instruments. Neither BCR or its content providers are responsible for any damages or losses arising from any use of this information. Past performance is no guarantee of future results.
Lebih Liputan


Pendedahan Risiko:Instrumen derivatif diniagakan di luar bursa dengan margin, yang bermakna ia membawa tahap risiko yang tinggi dan terdapat kemungkinan anda boleh kehilangan seluruh pelaburan anda. Produk-produk ini tidak sesuai untuk semua pelabur. Pastikan anda memahami sepenuhnya risiko dan pertimbangkan dengan teliti keadaan kewangan dan pengalaman dagangan anda sebelum berdagang. Cari nasihat kewangan bebas jika perlu sebelum membuka akaun dengan BCR.
BCR Co Pty Ltd (No. Syarikat 1975046) ialah syarikat yang diperbadankan di bawah undang-undang British Virgin Islands, dengan pejabat berdaftar di Trident Chambers, Wickham’s Cay 1, Road Town, Tortola, British Virgin Islands, dan dilesenkan serta dikawal selia oleh Suruhanjaya Perkhidmatan Kewangan British Virgin Islands di bawah Lesen No. SIBA/L/19/1122.
Open Bridge Limited (No. Syarikat 16701394) ialah syarikat yang diperbadankan di bawah Akta Syarikat 2006 dan berdaftar di England dan Wales, dengan alamat berdaftar di Kemp House, 160 City Road, London, England, EC1V 2NX. Open Bridge Limited bertindak semata-mata sebagai pemproses pembayaran untuk BCR Co Pty Ltd dan tidak menyediakan sebarang perkhidmatan kewangan, perdagangan atau pelaburan bagi pihaknya. Peranan Open Bridge Limited adalah terhad kepada pemprosesan pembayaran.

 English
 简体中文
简体中文
 繁體中文
繁體中文
 Bahasa
Melayu
Bahasa
Melayu
 Tiếng
Việt
Tiếng
Việt
 ไทย
ไทย
 日本語
日本語
 한국어
한국어
 ភាសាខ្មែរ
 español
