


0
US Dollar Index
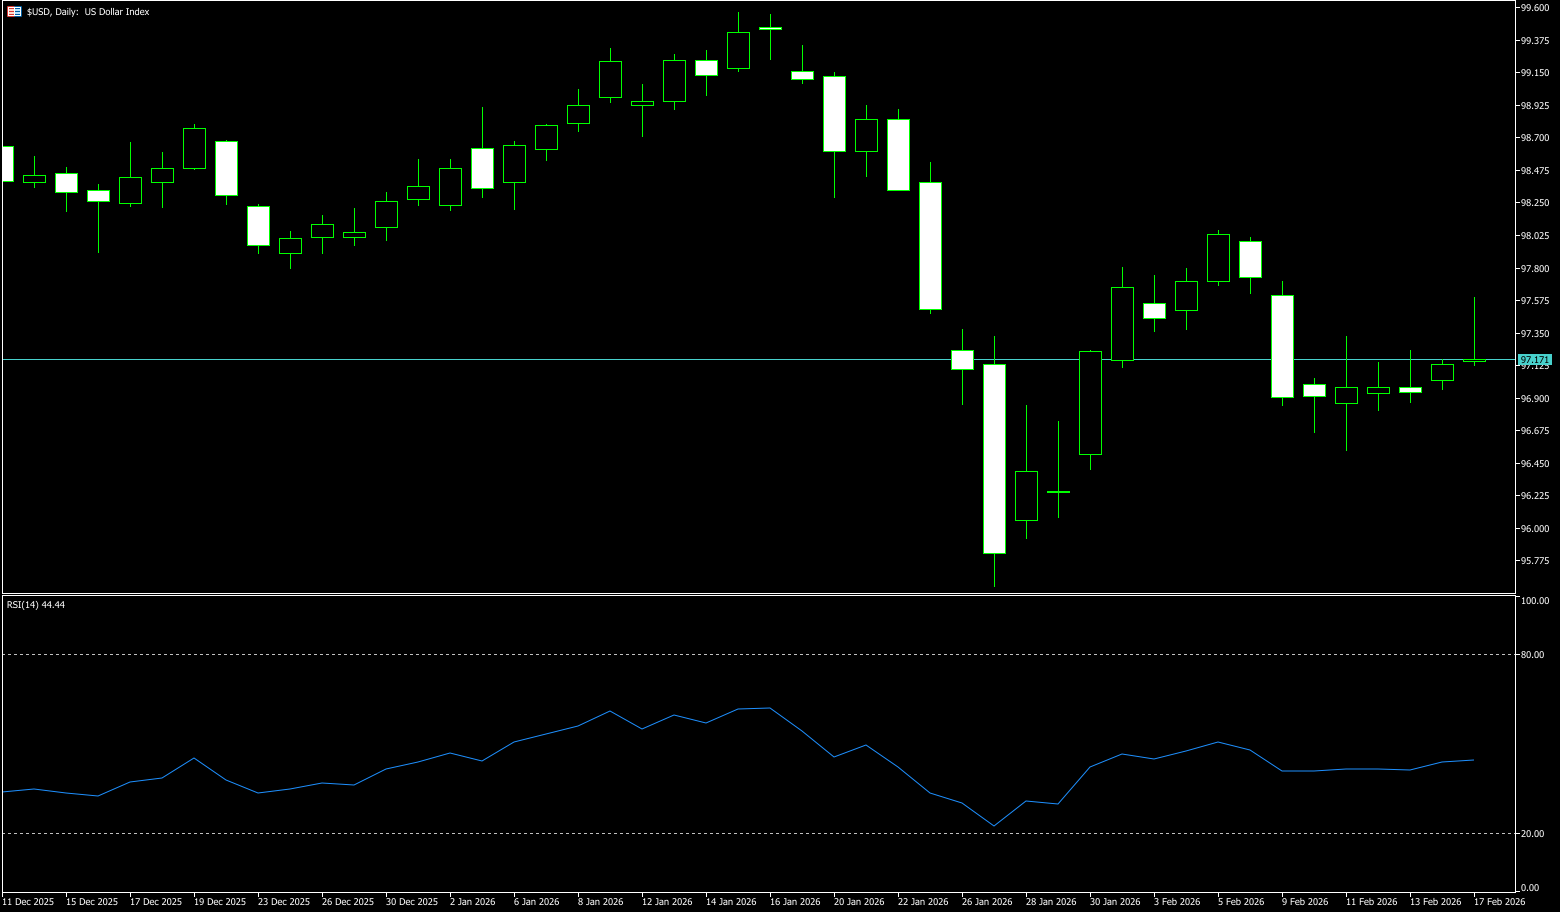
In the currency market, the US dollar is unlikely to experience a strong rebound in the short term. The recent efforts to recover the US macroeconomy over the past two weeks have failed to push the dollar back to its early January highs. The "short US assets" trend in mid-January has exerted long-term downward pressure on the dollar. Even with strong non-farm payroll data and a repricing of hawkish expectations, the dollar only saw a brief, weak rebound, and market confidence has not yet recovered. This week, core PCE, Q4 GDP, and the FOMC meeting minutes may slightly correct dovish pricing, but stock market volatility has become the dominant variable in the currency market. Nvidia's earnings report will trigger volatility in tech stocks and transmit to the foreign exchange market. Currently, the dollar's safe-haven appeal has weakened significantly. Although there is a chance for a corrective upward move this week, conditions for a sustained rebound are insufficient. Coupled with the US holiday and thin trading, short-term volatility will tend to converge. Moderate US inflation paves the way for a Fed rate cut, continuing to suppress the dollar's performance.
From a technical perspective, the long-term bearish trend of the US dollar index remains unchanged. The current slight upward movement is more like a second correction within a corrective phase and has not altered the long-term trend. The short-term rebound mainly relies on the phased inflow of safe-haven funds and a short-term boost from core data, lacking sustained momentum. The US dollar index is currently at the end of a converging symmetrical triangle, suppressed by the downtrend line since the January high. The price is fluctuating narrowly around 97.00 (the psychological level), with significant divergence between bulls and bears, and is approaching a turning point (likely triggered after the release of this week's core data and meeting minutes). Short-term resistance is at the 25-day moving average of 97.57, with key strong resistance at 97.76 (last week's high) and 98.00 (the psychological level). Support is found if the price breaks below 96.80 (daily close below this level). The target is 96.50–96.60 (the weekly low + densely traded area), followed by the 96.00 psychological level.
Today, consider shorting the US dollar index near 97.25; stop loss: 97.35; target: 96.75; 96.70
WTI Crude Oil
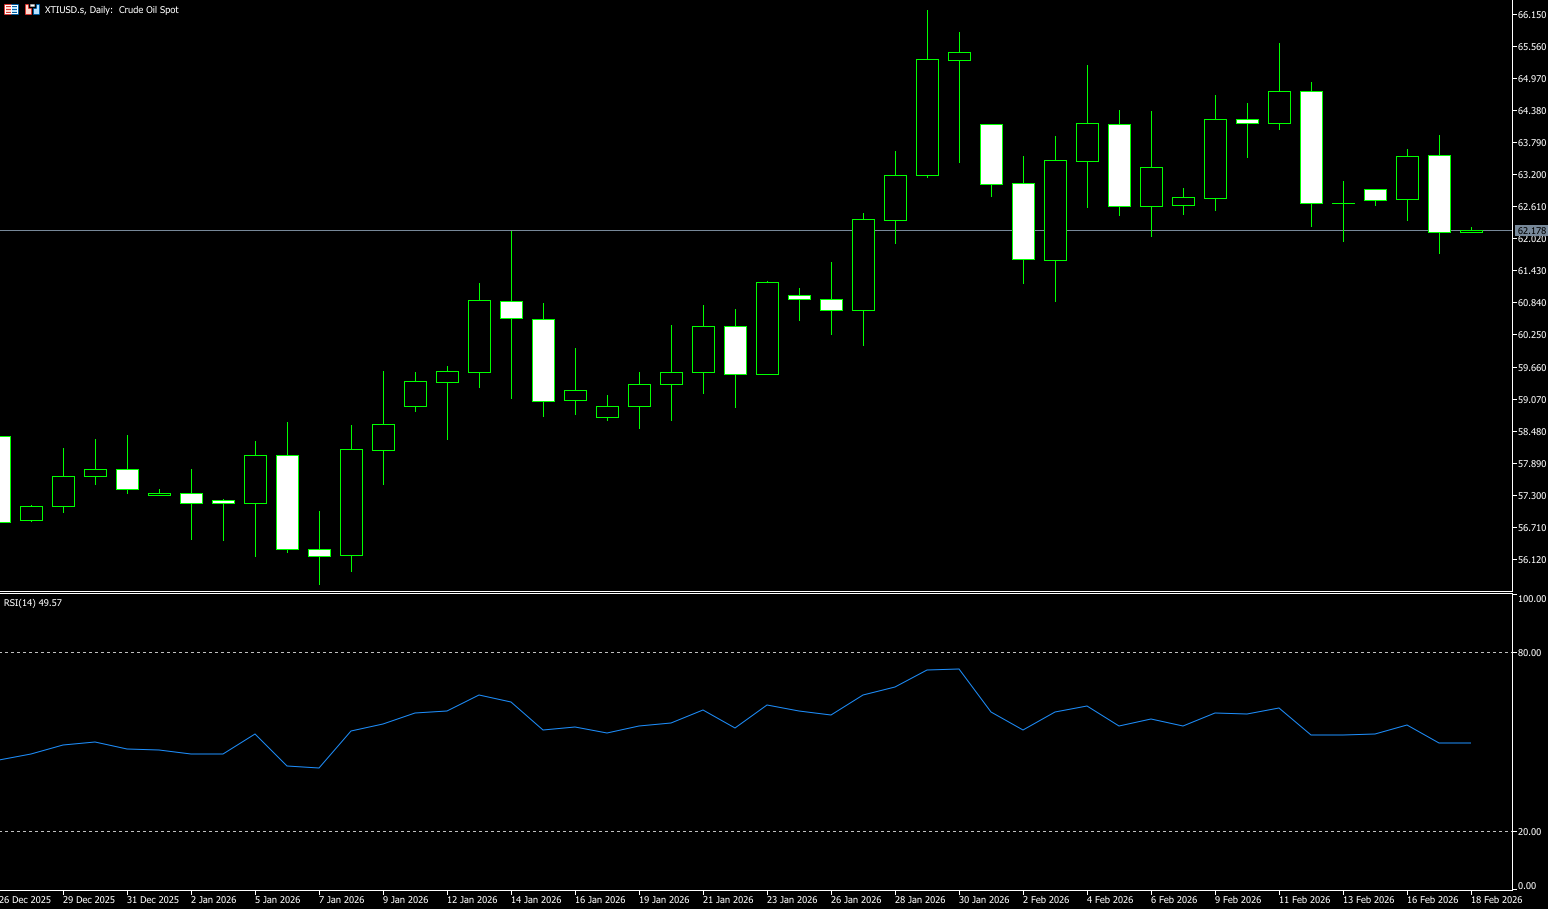
US crude oil rose, trading around $62.20 per barrel, as investors digested the OPEC+ production increase plan, while Iran's military exercises in the Strait of Hormuz increased geopolitical uncertainty. This price rebound was mainly driven by supply-side news. OPEC is inclined to resume increasing oil production starting in April, and the market is digesting this potential supply adjustment. In the coming weeks, the commodity market will continue to face multiple intertwined factors, including demand prospects in major economies, geopolitical risks, and the production policies of major oil-producing countries. Overall, oil prices are currently in a mixed state: geopolitical risks and a weaker dollar are providing support, while high inventory levels and potential production increases are limiting gains. In the short term, a range-bound trading pattern is expected, with the market closely watching inventory data, the OPEC+ meeting, and developments in the Middle East.
The current main logic behind oil prices remains the interplay between "geopolitical risk premiums" and "actual supply pressures." Short-term geopolitical factors are providing sentiment support to the market, but with increasing expectations of medium-term supply and a slowing demand growth outlook, oil prices are unlikely to form a sustained one-sided upward trend. Attention should be paid to inventory data and OPEC+ policy signals, while also being wary of the risk of amplified volatility due to sudden geopolitical events. From a daily chart perspective, WTI is oscillating within the range of $61.18 (34-day moving average) to $66.24 (January 29 high). Prices have rebounded above the 25-day moving average at $62.29, but the 300-day moving average at $64.24 still provides some resistance, indicating that bullish momentum has not yet been fully released. The area around $63.80 forms a short-term resistance zone. A break and hold above $64.00 (psychological level) and $64.24 (300-day moving average) could potentially test the $66.24 (January 29 high) level. Support is seen at the $62.00 level; a break below this level could lead to a pullback to the $61.18 (34-day moving average) area. The overall technical structure suggests the current price action is more of a consolidation phase than a trend breakout.
Consider going long on crude oil around $62.00 today; stop-loss: $61.85, target: $63.30; $63.50
Spot Gold
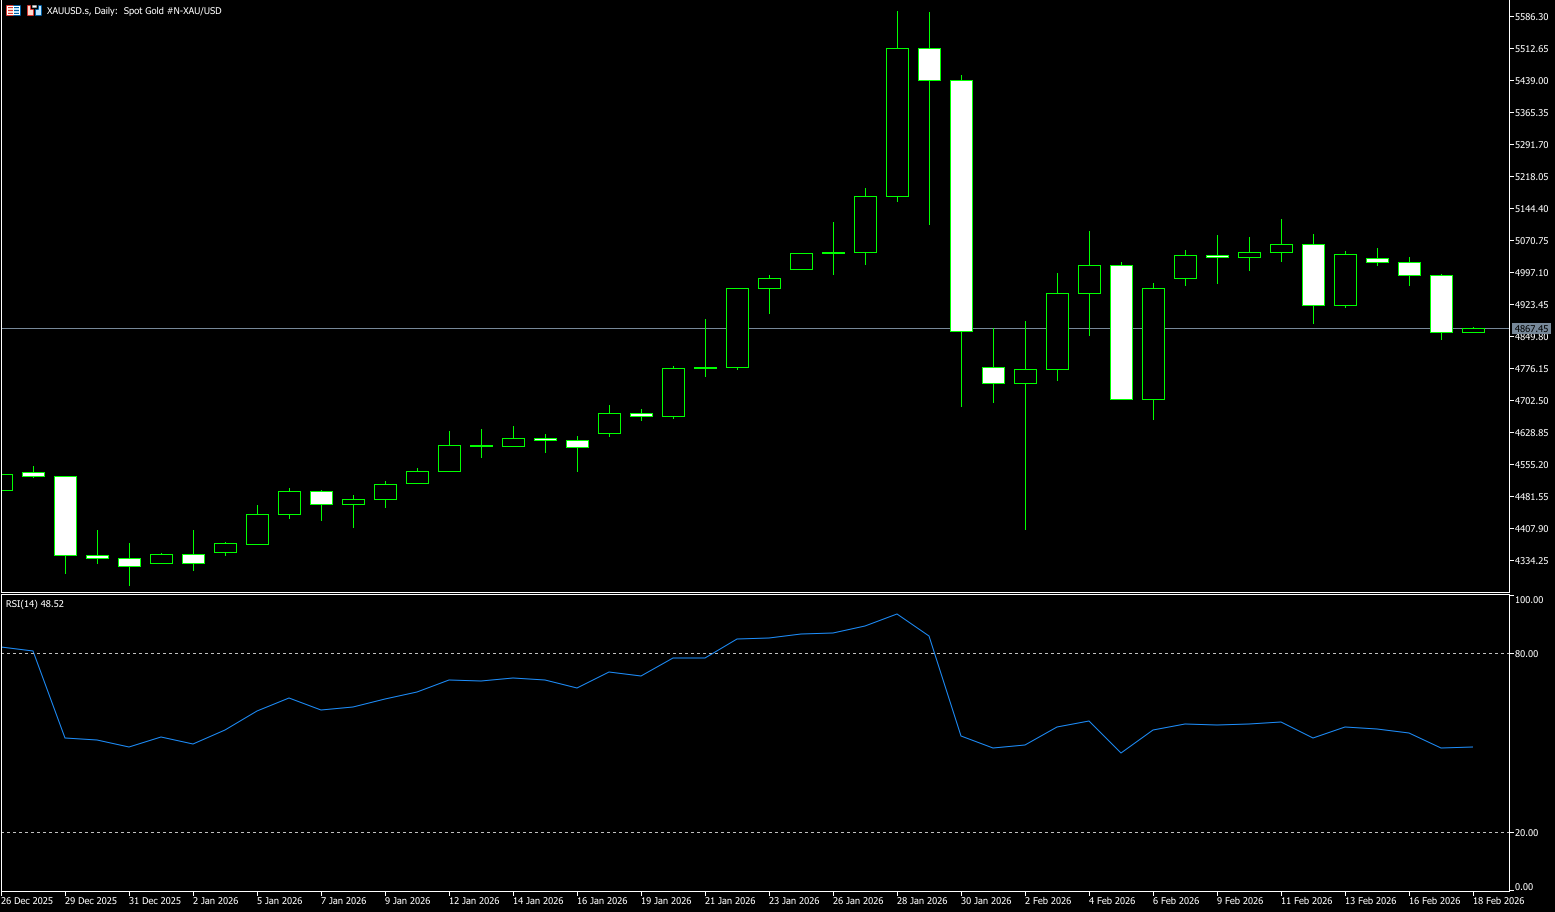
Spot gold traded around $4,882 per ounce on Tuesday, having earlier fallen to a low of $4,842. Gold prices were pressured lower on Monday as some investors were forced to unwind leveraged positions, tightening market liquidity. With US markets closed for Presidents' Day and the Chinese New Year holiday, trading was thin, and gold prices fluctuated downwards by nearly 1%. On the other hand, US President Trump clearly stated that he would support Israel's strike against Iran's ballistic missile program if the US-Iran nuclear negotiations ultimately break down. This statement, first made by Trump during his meeting with Israeli Prime Minister Netanyahu at Mar-a-Lago last December, directly exacerbated uncertainty in the Middle East and injected strong upward expectations into gold, a traditional safe-haven asset. The second round of US-Iran nuclear negotiations will officially begin in Geneva on Tuesday, and its outcome will be a key anchor for short-term market risk appetite, directly influencing gold price movements.
The daily chart shows that gold prices have seen three consecutive days of highs below the peak of $5,118.80 reached on February 11th, indicating that bears are fiercely defending the $5,100 level and could push prices lower. The MACD histogram remains in negative territory and shows a downward expansion, also indicating a defeat for the bulls. The 14-day Relative Strength Index (RSI) is above the midline {53} but is turning downwards, which may provide weak support for gold prices. On the downside, the first support level is $4.842 (Tuesday's low). A break below this key support could strengthen the downtrend, pushing prices to test the 34-day simple moving average at $4,806. On the upside, the first resistance level will be $5,000 (a psychological level), followed by the February 11th high of $5,118.80.
Consider going long on gold today around 4,875; Stop loss: 4,870; Target: 4,960; 4,980
AUD/USD
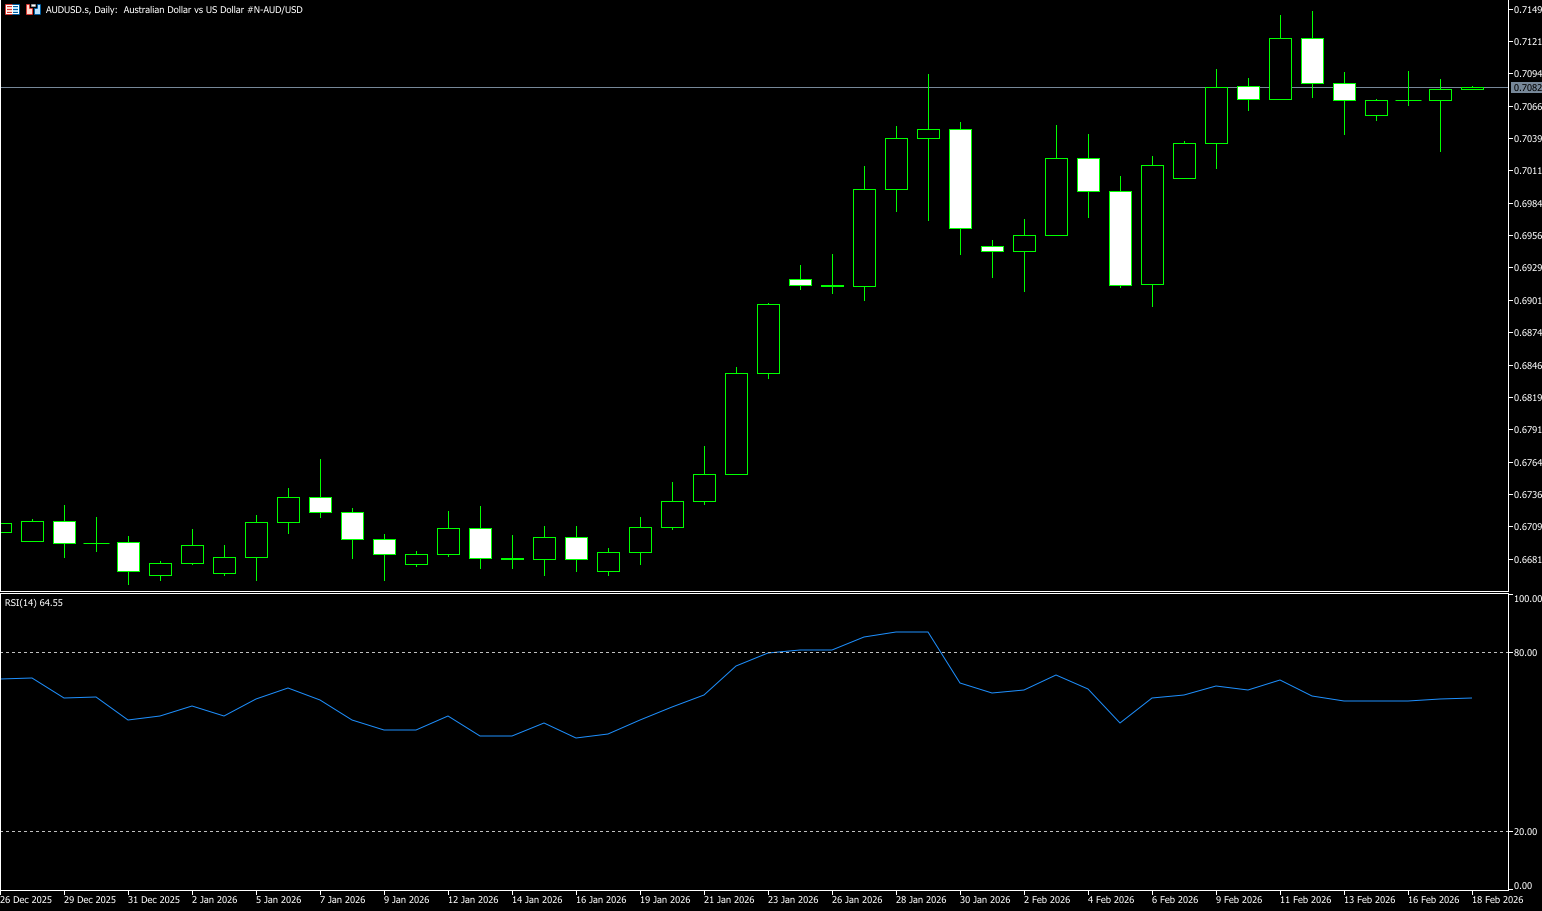
The Australian dollar retreated slightly from a small gain in the previous session, trading around 0.7080 in Asian trading on Tuesday. The pair remained subdued following the release of the Reserve Bank of Australia (RBA) meeting minutes, which indicated that the February rate hike was due to stronger-than-expected economic data, persistent broad-based inflation, and accommodative financial conditions. RBA policymakers emphasized their reliance on upcoming data and stressed that there is no predetermined interest rate path. Members agreed that inflation could remain above target for an extended period without a policy response. Traders will now focus on the Australian wage price index for the fourth quarter of 2025, due on Wednesday, followed by the January labor market report on Thursday. Both data points are expected to provide further insights into the RBA's monetary policy trajectory and the overall health of the economy.
The AUD/USD remains a barometer of global risk appetite and the overall pulse of the Chinese economy. As long as these two pillars remain firm, the pair should remain supported. A sustained break above 0.7100 would not only be another boost but would also strengthen the constructive narrative and make the bullish outlook more credible. On the daily chart, AUD/USD is trading at 0.7070. The 55-day and 100-day moving averages are above the 200-day simple moving average, reinforcing bullish momentum. All three simple moving averages are trending upwards, and the price remains above them. The Relative Strength Index (RSI) (14) is near 64, indicating strong upward momentum and no overbought conditions. Immediate resistance is at 0.7100 (a psychological level), and holding above these levels would open the way to resistance at 0.7147 (the high of February 12th), followed by the psychological level of 0.7200. Support is initially found at the 0.7038 (14-day simple moving average) and 0.7000 (a psychological level). A break below these levels would target the 0.6940 (25-day simple moving average) level.
Consider going long on the Australian dollar today around 0.7070; Stop loss: 0.7060; Target: 0.7130; 0.7120
GBP/USD
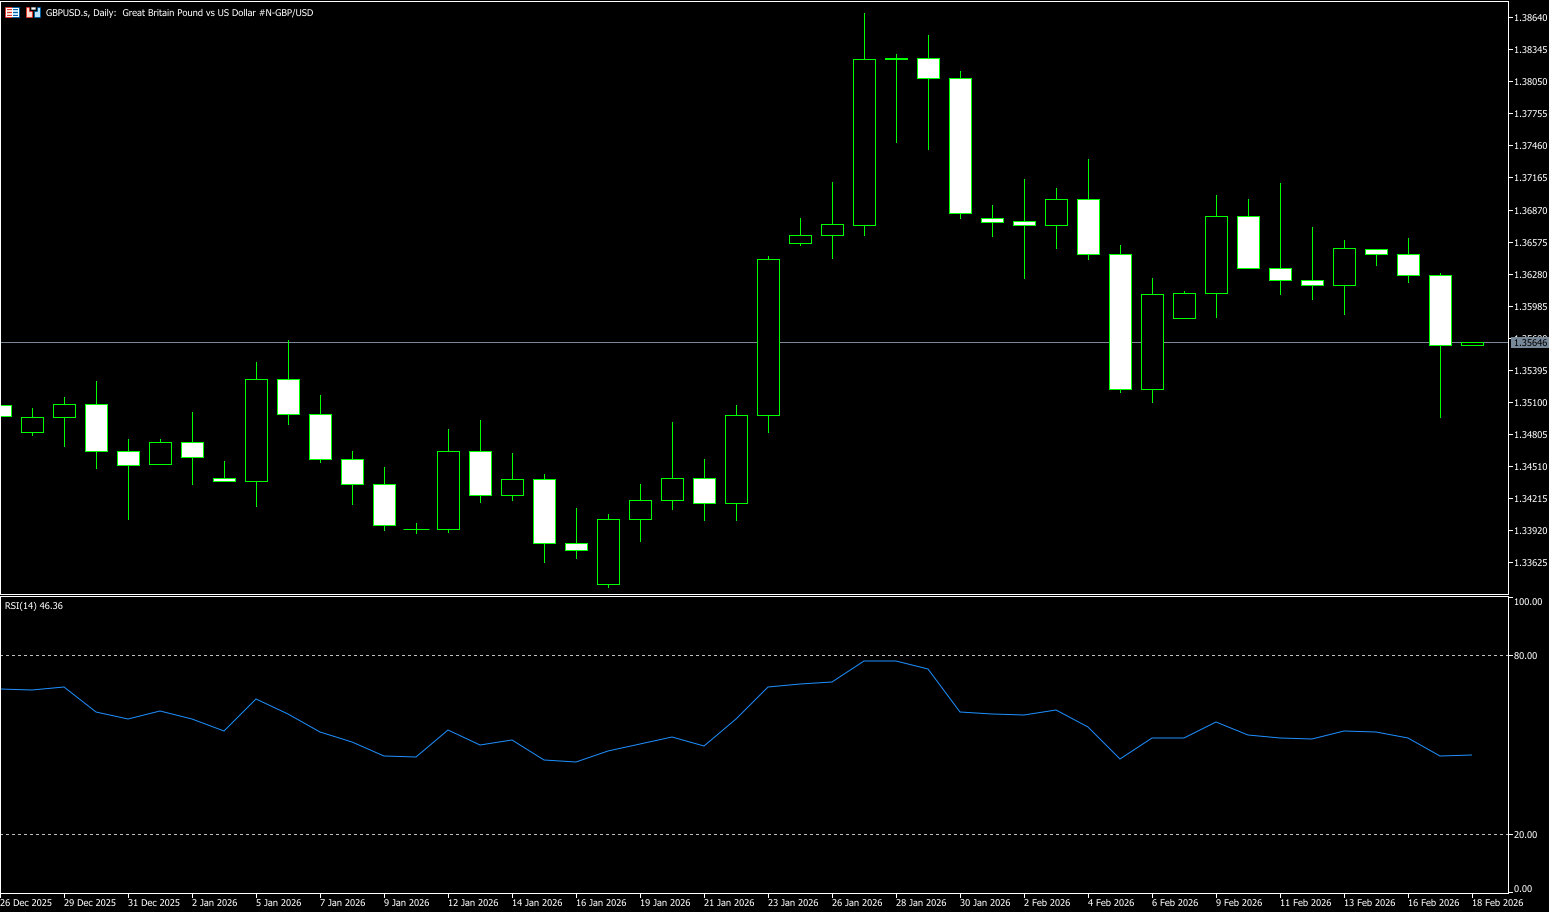
After just breaking below the 1.3500 level, GBP/USD has now gained some new buying interest and rose to the 1.3530-1.3540 range in the latter half of Tuesday's session. The pound's rebound occurred as the dollar relinquished some of its gains, although the dollar remained bullish throughout the day. Wednesday's latest UK consumer inflation data will influence market expectations regarding the Bank of England's policy outlook, with the market betting on a 25 basis point rate cut in March. This, in turn, will play a key role in driving the pound. In addition, traders will be looking for further clues about the Fed's rate-cutting path from Wednesday's FOMC meeting minutes. This outlook will drive near-term demand for the dollar and provide some meaningful momentum for the GBP/USD pair. Furthermore, Friday's UK monthly retail sales data, along with flash PMIs from the UK and the US, could also contribute to volatility in the latter half of the week.
GBP/USD faced some supply on Tuesday as UK-specific concerns eroded some of the previous day's strong gains, pulling back to the 1.3700 level. Political turmoil in the UK has been a key factor in the pound's relative underperformance. This has capped the pair's sharp rebound from the psychological level of 1.3500, or two-week low, reached last Friday. The 14-day Relative Strength Index (RSI) is at 48.54, near the 50 midline, and shows no overbought pressure. The 9-day simple moving average has risen above the 50-day simple moving average, maintaining a recent positive bias as prices continue to trade above both indicators, highlighting an improving medium-term outlook. The upside target for the pair is the resistance zone forming a strong resistance area at 1.3700 (the psychological level), followed by resistance at 1.3869 (this year's high). On the downside, immediate support lies at 1.3523 (the 50-day simple moving average), then the 1.3500 level.
Consider going long on GBP near 1.3550 today; Stop loss: 1.3540; Target: 1.3600; 1.3610
USD/JPY
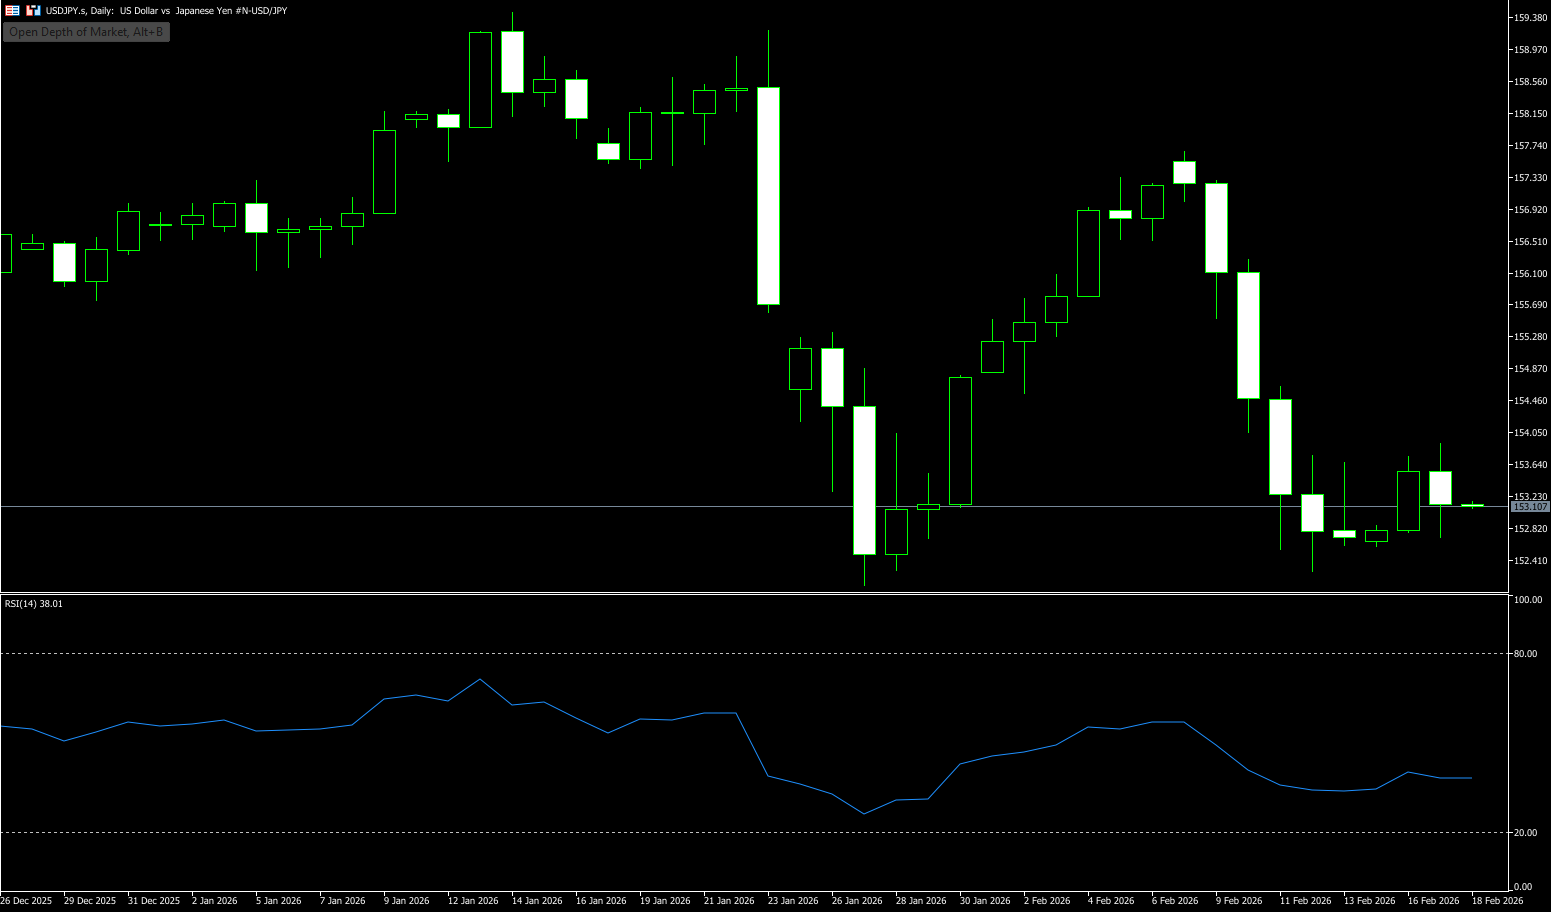
USD/JPY struggled to capitalize on the previous day's positive moves during Tuesday's Asian session, attracting some intraday selling pressure near the 153.75 resistance zone. The spot price touched a new daily low in the 153.25-153.20 area in the final hour, although the decline lacked bearish conviction. Traders remained highly cautious amid concerns that Japan and the US might coordinate intervention to curb the yen's weakness. Furthermore, the divergence in interest rate paths between the Bank of Japan and the Federal Reserve also limited the pair's upside. However, Monday's disappointing release of Japan's fourth-quarter GDP may have reduced the urgency for further policy tightening by the Bank of Japan, potentially constraining yen bulls from making aggressive bets. Additionally, the current risk-averse environment could put pressure on the safe-haven yen and provide a tailwind for the USD/JPY pair.
Technically, USD/JPY remains near a key resistance level, facing a significant test in the short term. At the beginning of the week, the USD/JPY exchange rate remained below the high reached on Thursday (approximately 153.75 yen), failing to break through effectively. The daily trading range was between 152.64 and 153.75, with bulls and bears battling it out below key resistance levels. Looking ahead, the 153.75-154 area will be a significant resistance level for USD/JPY. A successful break and hold above this level would break the current consolidation pattern and open up further upside potential to 154.92 (the 20-day simple moving average). On the support side, the 140-day moving average at 152.78 will be a key short-term support level. If the exchange rate retraces to below this moving average, it is expected to find buying support in the 152.27 (February 12 low) and 152.00 (the psychological level), easing downward pressure.
Consider shorting the US dollar around 153.50 today; stop loss: 153.70; target: 152.60; 152.40
EUR/USD
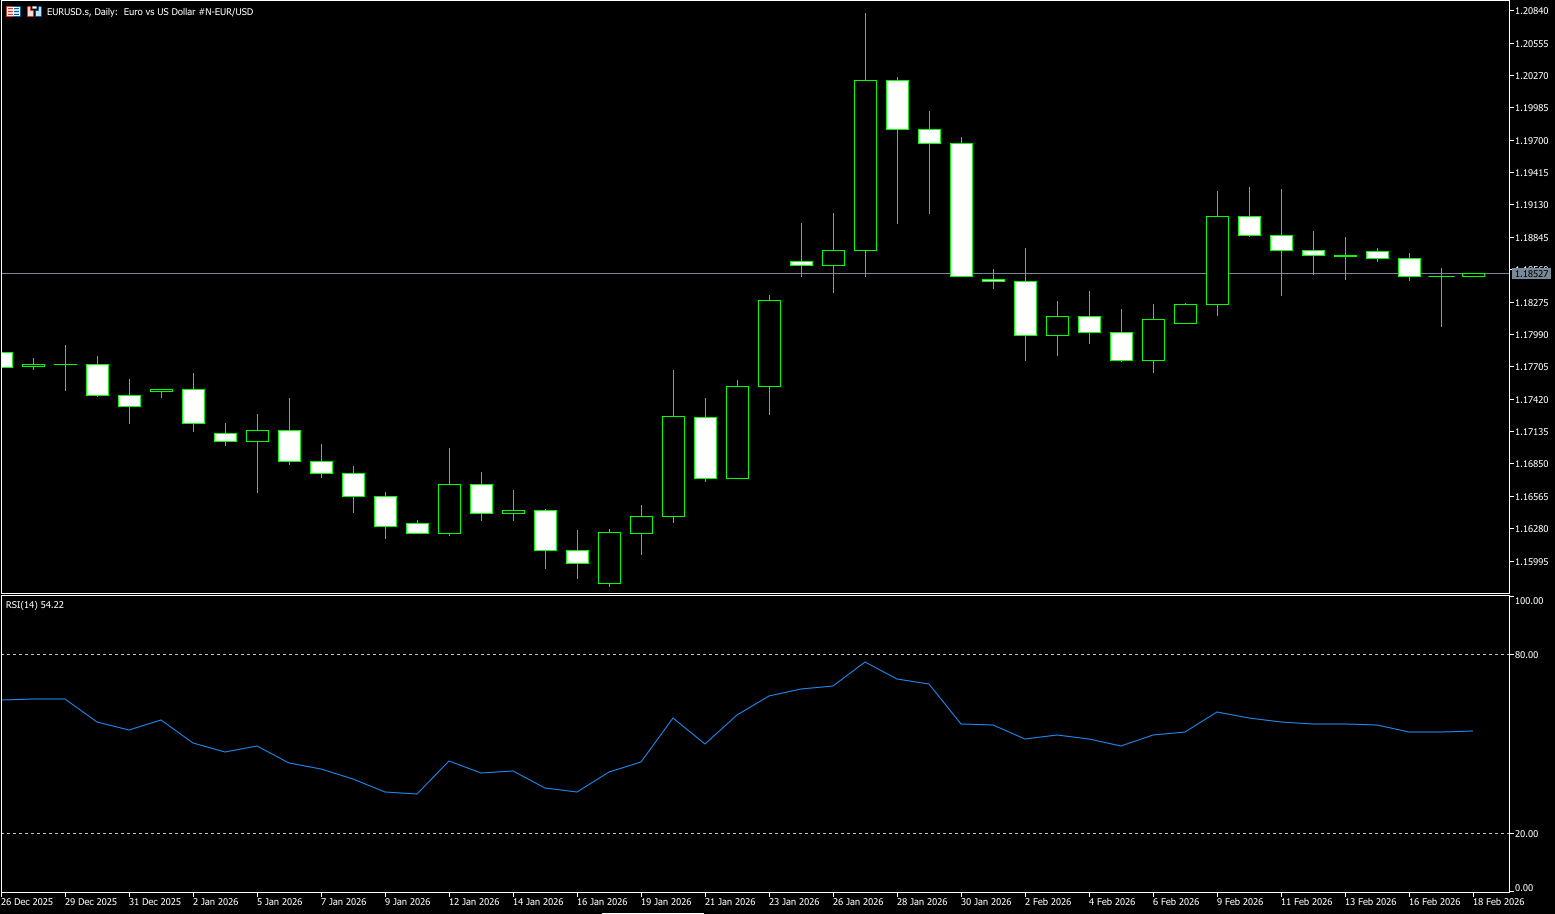
EUR/USD attracted some selling on Tuesday, hovering below the mid-1.1800 level for the second consecutive day, with relatively quiet trading during the Asian session. However, a broad fundamental backdrop requires bearish traders to remain cautious before taking deeper losses. On the other hand, the common currency is supported by a gradual shift towards the possibility of an ECB rate cut, fueled by eurozone inflation falling to its lowest level since September 2024. However, the upside for the dollar is more likely to be limited by dovish Fed expectations. Indeed, traders increased their bets on the Fed lowering borrowing costs in June following weak US consumer inflation data released last Friday. This is likely to deter aggressive bets by dollar bulls against a backdrop of concerns about Fed independence and help limit downside for the EUR/USD pair.
The latest rally in EUR/USD appears to have lost momentum above the 1.1900 level. Nevertheless, the overall tone remains positive. Unless a significant shift in sentiment is seen, the 1.2000 level remains the next logical upside target. On the daily chart, EUR/USD is trading at 1.1850. The 55-day simple moving average has risen above the 100-day and 200-day simple moving averages, reinforcing the bullish tone. All three simple moving averages are sloping upwards, and the price remains above them, allowing buyers to control the market. The 14-day Relative Strength Index (RSI) is at 53.05, near the midline, consistent with stable momentum. Immediate resistance lies at the 1.1900 level, forming a clear resistance zone, followed by the 1.1928 (last week's high) resistance area. A break above this level would target the 1.2000 (psychological level). Support lies at the 1.1800 psychological level, followed by the 1.1768 (50-day moving average).
Consider going long on EUR/USD today near 1.1840; Stop loss: 1.1830; Targets: 1.1900, 1.1910
Disclaimer: The information contained herein (1) is proprietary to BCR and/or its content providers; (2) may not be copied or distributed; (3) is not warranted to be accurate, complete or timely; and, (4) does not constitute advice or a recommendation by BCR or its content providers in respect of the investment in financial instruments. Neither BCR or its content providers are responsible for any damages or losses arising from any use of this information. Past performance is no guarantee of future results.
Lebih Liputan


Pendedahan Risiko:Instrumen derivatif diniagakan di luar bursa dengan margin, yang bermakna ia membawa tahap risiko yang tinggi dan terdapat kemungkinan anda boleh kehilangan seluruh pelaburan anda. Produk-produk ini tidak sesuai untuk semua pelabur. Pastikan anda memahami sepenuhnya risiko dan pertimbangkan dengan teliti keadaan kewangan dan pengalaman dagangan anda sebelum berdagang. Cari nasihat kewangan bebas jika perlu sebelum membuka akaun dengan BCR.
BCR Co Pty Ltd (No. Syarikat 1975046) ialah syarikat yang diperbadankan di bawah undang-undang British Virgin Islands, dengan pejabat berdaftar di Trident Chambers, Wickham’s Cay 1, Road Town, Tortola, British Virgin Islands, dan dilesenkan serta dikawal selia oleh Suruhanjaya Perkhidmatan Kewangan British Virgin Islands di bawah Lesen No. SIBA/L/19/1122.
Open Bridge Limited (No. Syarikat 16701394) ialah syarikat yang diperbadankan di bawah Akta Syarikat 2006 dan berdaftar di England dan Wales, dengan alamat berdaftar di Kemp House, 160 City Road, London, City Road, London, England, EC1V 2NX. Entiti ini bertindak semata-mata sebagai pemproses pembayaran dan tidak menyediakan sebarang perkhidmatan perdagangan atau pelaburan.

 English
 简体中文
简体中文
 繁體中文
繁體中文
 Bahasa
Melayu
Bahasa
Melayu
 Tiếng
Việt
Tiếng
Việt
 ไทย
ไทย
 日本語
日本語
 한국어
한국어
 ភាសាខ្មែរ
 español