


0
US Dollar Index
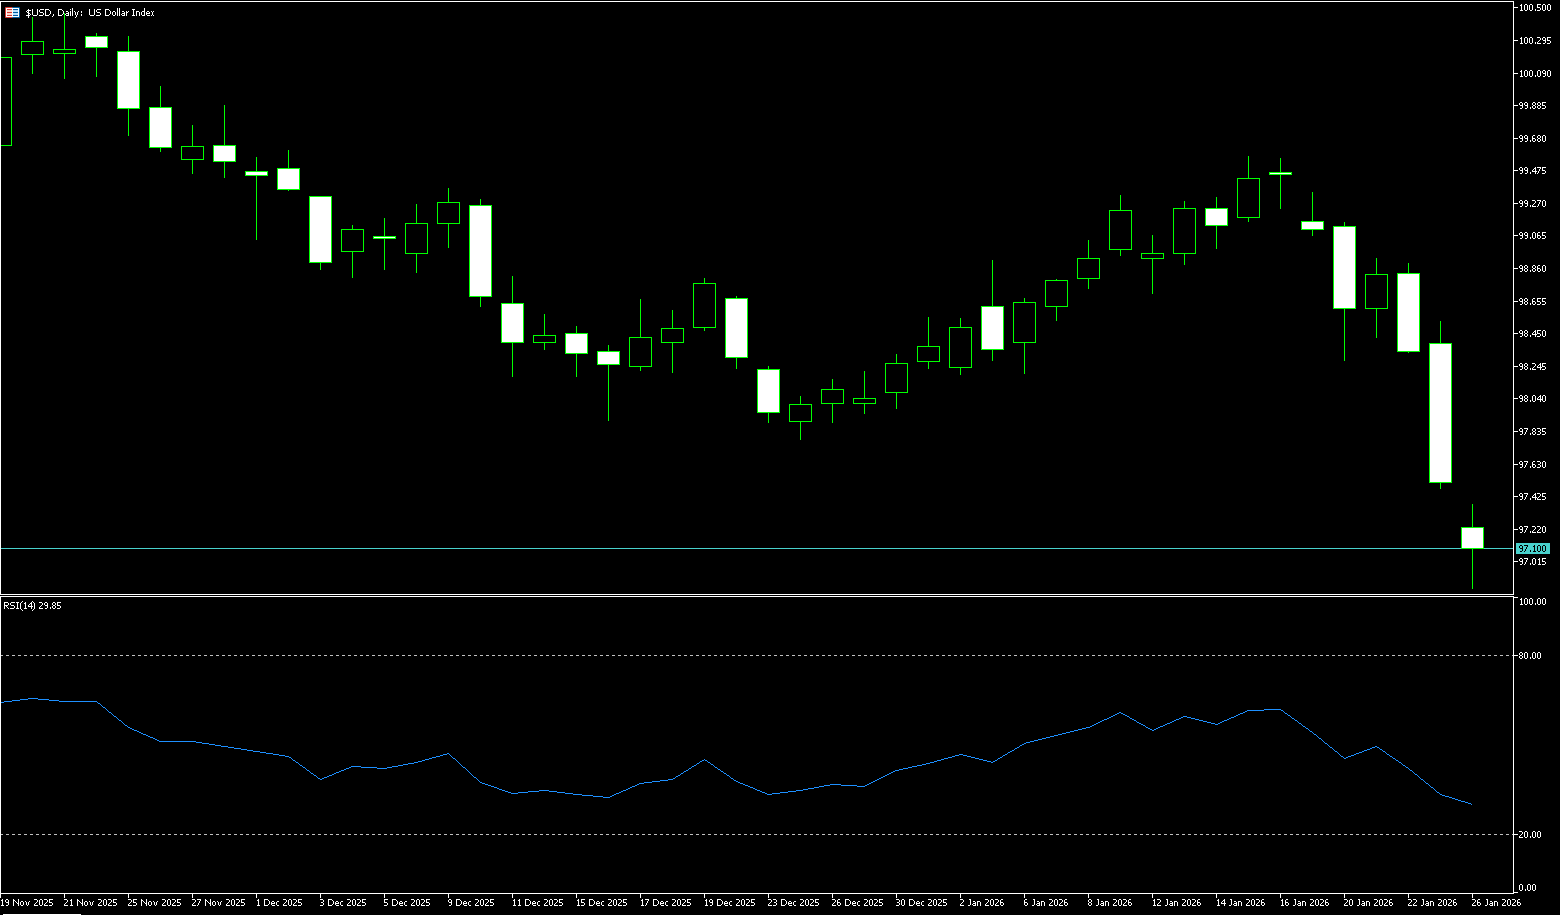
The US dollar index weakened for the third consecutive trading day on Monday, falling to around 96.80, its lowest level in over four months, and extending last week's 1.9% drop, its largest weekly decline since April. Last Friday saw significant volatility in the foreign exchange market, a veritable rollercoaster ride of geopolitical and monetary policy events. The entire process caught investors off guard. The US dollar index fell nearly 2%, marking its largest weekly decline since April 2025. Risk currencies such as the euro and pound sterling rebounded sharply, while the yen surged twice after approaching the 160 level. The dollar experienced widespread selling. At the beginning of this week, the US dollar index jumped to 97.20, with a cumulative decline of over 1% last week, its largest weekly drop since June of last year. Geopolitical tensions, particularly those surrounding Greenland, were the main factors weighing on the dollar and market risk sentiment. Despite President Trump's statement last week that he had secured "full access" to Greenland through an agreement and ruled out the possibility of a military takeover, the associated uncertainty severely impacted US assets at the start of the week.
On Monday, the US dollar index fluctuated downwards, currently trading around 97.10, down approximately 0.35% on the day. It had previously refreshed a more than four-month low of 96.94, continuing the significant decline of the previous two trading days. The "evening star" pattern formed at the beginning of last week is a typical top reversal signal, reinforcing short-term bearish expectations. The subsequent weak rebound also confirms the effectiveness of this pattern. The daily RSI (14) is around 30.90, approaching the oversold zone; a break below 97.75-98.00 may initiate a new round of downward movement. The short-term moving averages are in a bearish alignment, indicating a weak short-term trend. It's highly likely to remain range-bound between 97.00 and 98.00 (the psychological level). The next target is 97.00, and a further break below this level could test the psychological level of 96.56 (the low of September 16th last year). A return above the psychological level of 98.00 and the low of October last year of 97.75, and a break above the 34-day moving average of 98.52, could alleviate the weak trend.
Today, consider shorting the US Dollar Index around 97.15; Stop loss: 97.25; Target: 96.80; 96.70
WTI Crude Oil
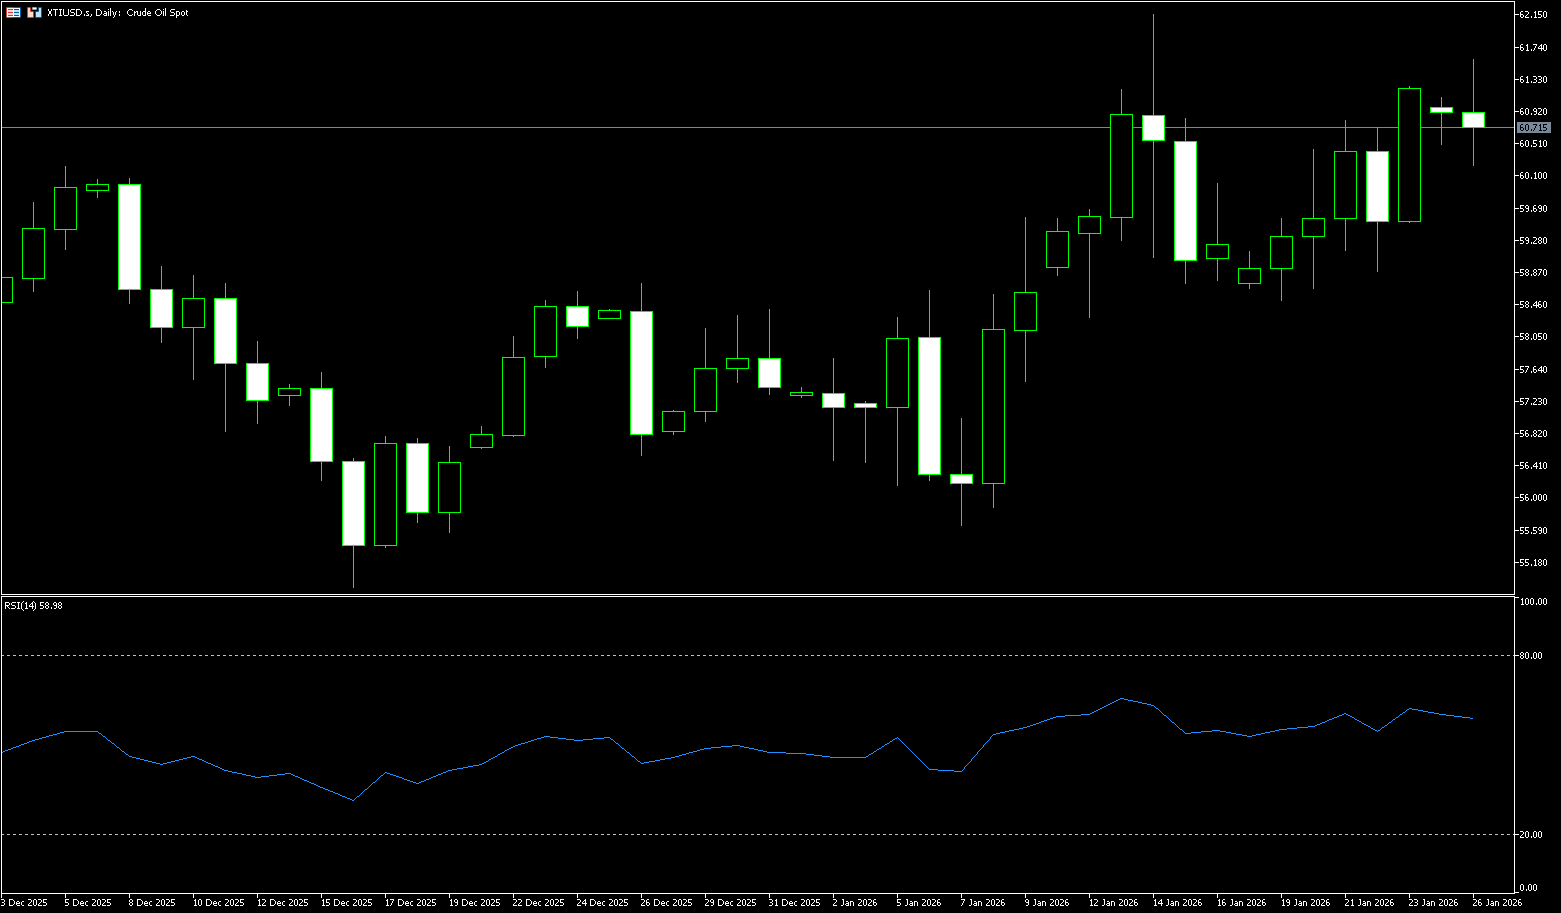
US crude oil is trading around $61 per barrel. Oil prices are supported by geopolitical tensions. New US sanctions against Iran and the deployment of military forces to the Middle East have exacerbated market concerns about potential disruptions to oil supplies in the region. US President Trump announced new sanctions against ships and companies transporting Iranian oil and dispatched a fleet to the Middle East, further pressuring Iran. Iran is the fourth-largest oil producer in OPEC, and the risks to its supply have pushed up oil prices. Furthermore, the ongoing shutdown of a large oil field in Kazakhstan has also supported prices. The Tengtz oil field, one of the world's largest, has shut down due to a fire, and its operators say production has not yet resumed. JPMorgan Chase analysts point out that the shutdown could lead to a significant drop in Kazakhstan's crude oil production in January, further tightening market supply. Last week, oil price movements were dominated by geopolitical events. Market focus returned to Middle East supply risks, and oil prices resumed their upward trend.
From a technical perspective, WTI crude oil remains in a generally weak downward structure. Short-term rebounds are more of a technical correction than a trend reversal. The daily chart shows that oil prices continue to trade below major moving averages, with short- and medium-term moving averages showing a bearish alignment and the price center of gravity constantly shifting downwards, reflecting insufficient bullish momentum and that bears still dominate. From a key price perspective, the $60 level has become short-term support. Oil prices have repeatedly rebounded to this area but have been met with resistance and pullbacks, indicating concentrated selling pressure at this level. If WTI can effectively hold above $60, the upside potential will continue. Further upside targets are the $61.40 level. Strong resistance lies at $62.19 (the previous high on January 14th). On the downside, $58.50 forms a key short-term support zone. If this level is breached, oil prices could accelerate their decline towards the $57 level, and a retest of the previous lows cannot be ruled out.
Today, consider going long on crude oil near $60.50; Stop loss: $60.33; Target: $62.00; $62.20
Spot Gold
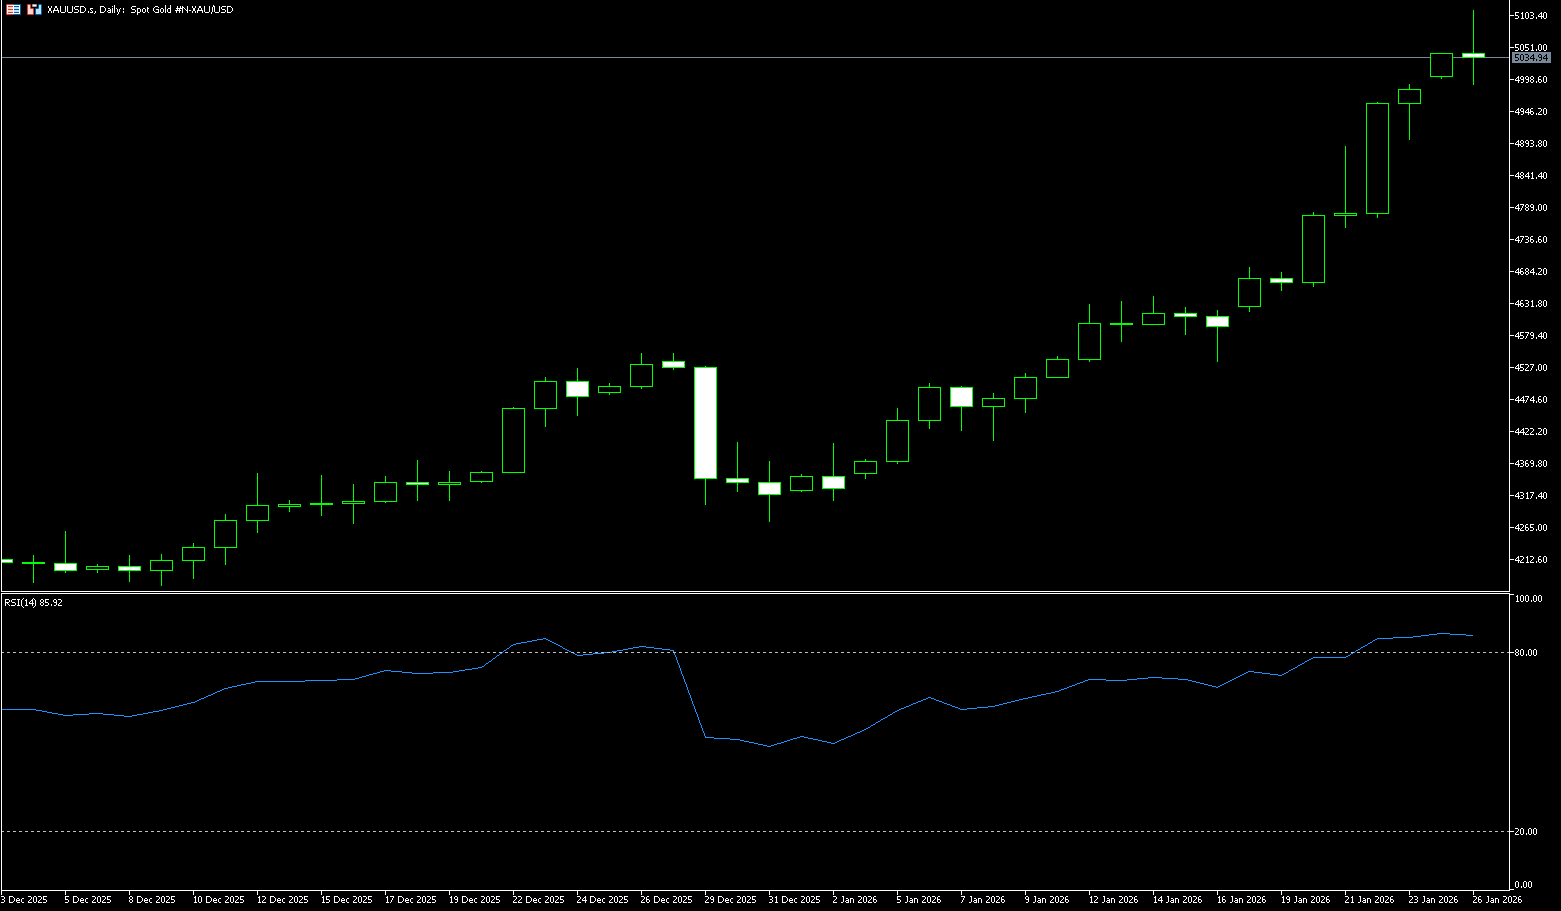
Gold prices rose on Monday to $5,105 per ounce, extending their record-breaking upward trend, driven by increased safe-haven demand amid heightened trade and geopolitical uncertainty. Canadian Prime Minister Mark Carney said on Sunday that Ottawa has no plans to reach a free trade agreement with China, noting that recent agreements only reduced tariffs on some sectors. Carney's comments came a day before President Trump threatened to impose 100% tariffs on Canadian goods should a trade deal be reached with Beijing. Friction between the US and Europe over Greenland, and tensions in the Middle East, have also unsettled investors. Meanwhile, the risk of a US government shutdown due to the recent Minneapolis shooting has surfaced as Senate Democrats pledged to block a major funding bill. Traders are now awaiting this week's Federal Reserve meeting, with the market widely expecting the central bank to keep interest rates unchanged. Gold has risen about 17% year-to-date after a strong finish to 2025.
Gold is making a breakout attempt towards the key $5,000/ounce level, with market sentiment euphoric and bullish momentum at its peak. Technically, gold is currently in a textbook strong uptrend, with the upside potential fully opened after breaking through key resistance. The 4-hour chart shows that after breaking through the key resistance level of $4,780/oz, gold prices did not experience a pullback for confirmation but instead directly entered an accelerated upward trend, reaching a new all-time high of $5,038/oz. Momentum indicators (such as MACD and KDJ) confirm that the upward momentum remains strong, and the short-term uptrend is solid. Although the current RSI indicator is in extremely overbought territory, indicating short-term pullback pressure, the pullback has been very shallow and quickly absorbed by buying. Initial support is found at the $4,900 (psychological level), followed by solid support in the $4,775–$4,800 range. The bulls' control over the market has not weakened in the slightest. A break above this level will confirm that gold prices have entered a new acceleration phase; higher resistance levels are seen at the 1.000 extension level ($5,106.29/oz) and the 1.272 extension level ($5,201.35/oz), which will be the core upward targets for the first half of 2026.
Consider going long on gold around 5053 today; Stop loss: 5048; Target: 5,080; 5,090
AUD/USD
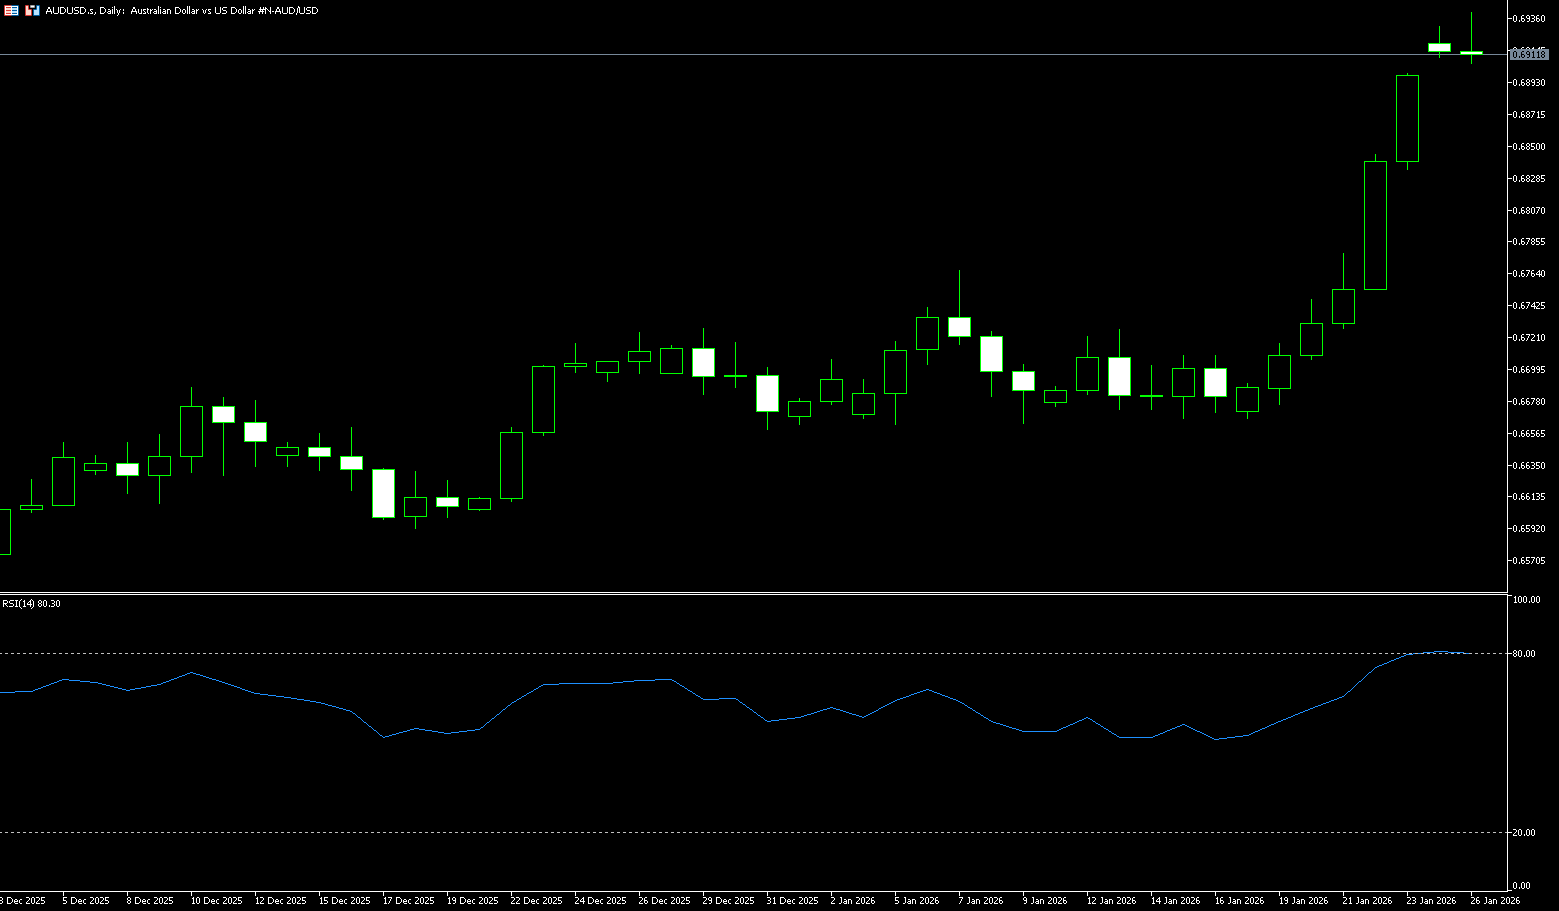
The Australian dollar appreciated to US$0.6940 on Monday, hovering near a 16-month high. Strong employment data boosted expectations of a near-term rate hike, while optimistic purchasing managers' index data further supported market sentiment. Recent data showed that the unemployment rate unexpectedly fell to a seven-month low in December, strengthening bets on a rate hike amid persistently high inflation and increasingly hawkish signals from the Reserve Bank of Australia. The swap market now projects a 55.7% probability of a rate hike in February, up from 26.5% before the data release, and a probability of over 80% by May. The focus now shifts to the December and fourth-quarter inflation data to be released later this week for further signals on the RBA's policy outlook.
On Monday, AUD/USD traded near 0.6940. Daily chart analysis shows the pair is rising within an ascending channel pattern, exhibiting a continued bullish bias. The 14-day Relative Strength Index (RSI) is at 78.40, indicating overbought conditions and suggesting momentum is nearing saturation. AUD/USD may test the overlapping resistance zone near the upper boundary of the ascending channel at 0.6942, the highest level since February 2023. The next level is 0.7000. On the downside, key support is at the January 22 high of 0.6844. A break below the channel would weaken the bullish bias, targeting the psychological level of 0.6800.
Consider going long AUD/USD near 0.6910 today; Stop Loss: 0.6900; Target: 0.6940; 0.6950
GBP/USD
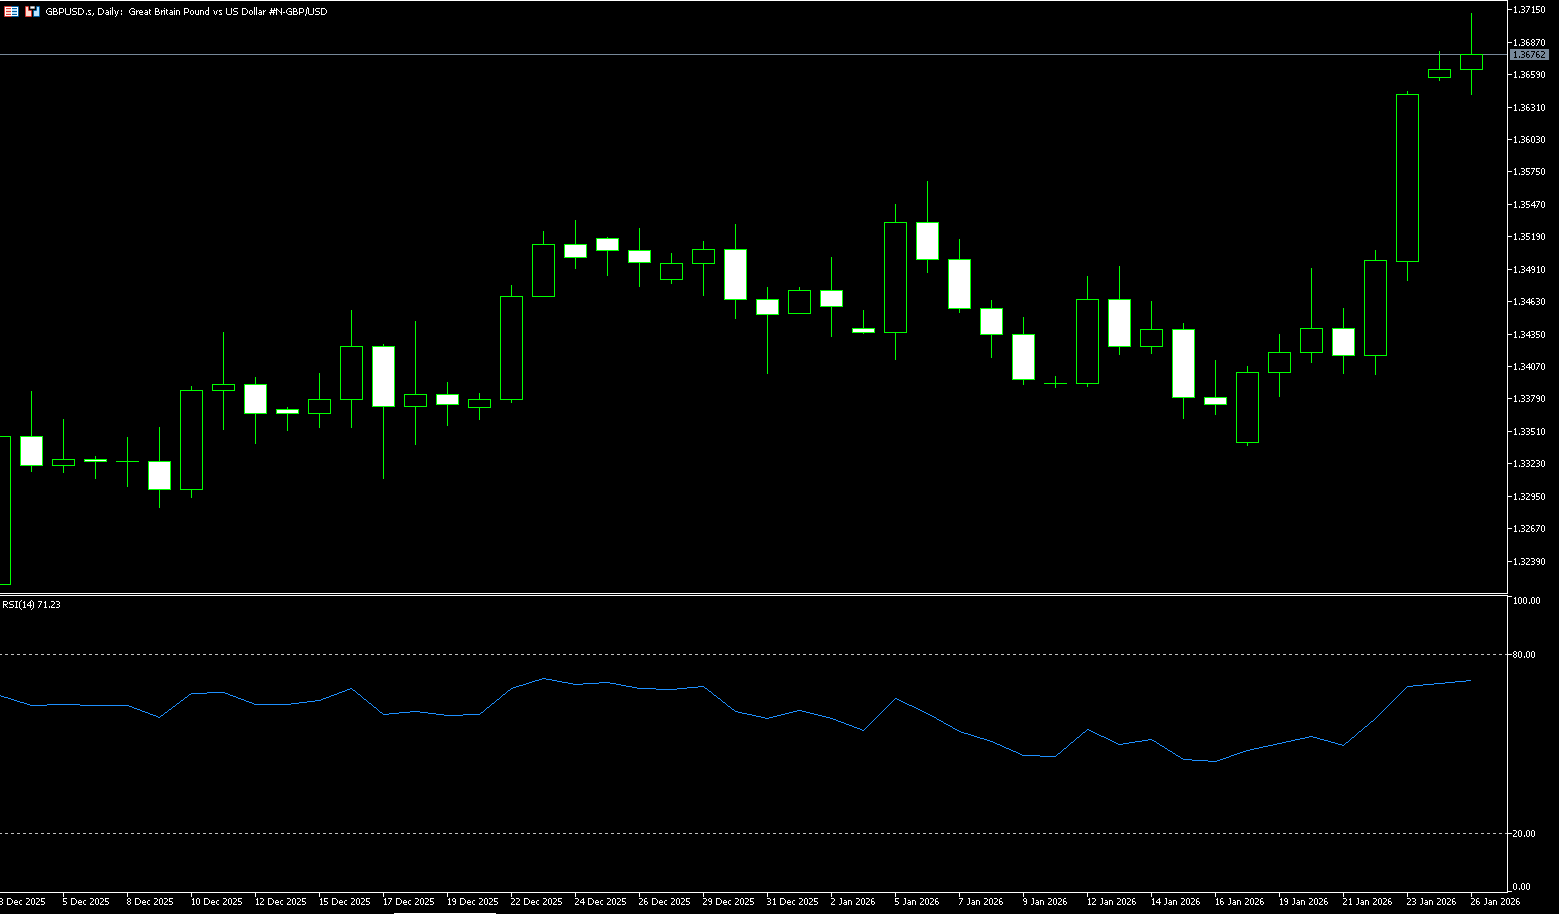
GBP/USD has retreated from its highest level since September 2024 at 1.3713, filling the modest bullish gap at the start of the new week. The spot price is currently fluctuating above 1.3650, seemingly poised for further appreciation. US President Trump's stance on controlling Greenland and his standoff with European allies have raised questions about the long-standing NATO alliance. This, coupled with a loss of confidence in global leadership, has reactivated the so-called "sell the dollar" trade, severely pressuring the dollar. The dollar index, which tracks the dollar against a basket of currencies, fell to a four-month low on Monday, providing some support for GBP/USD. Furthermore, market bets that the Federal Reserve (Fed) will lower borrowing costs twice more this year are another factor weakening the dollar. On the other hand, the pound is supported by stronger-than-expected UK economic data.
The stronger-than-expected UK inflation provided a short-term boost to the pound, but it is not enough to drive a sustained upward trend. Currently, the core variable for GBP/USD remains on the dollar side; US economic data and inflation performance will directly influence market judgments on the Fed's policy path. Until there is a significant divergence in policy expectations between the Bank of England and the Fed, GBP/USD is more likely to maintain high-level fluctuations rather than a one-sided trend. From a technical perspective, the GBP/USD pair has stabilized above the 1.3500 level, indicating a short-term bullish bias, but further confirmation of upward momentum is needed. Initial resistance lies in the 1.3700 (psychological level) – 1.3726 (last September high) range. Failure to break through this area could lead to a retest of the 1.3800 level and subsequent consolidation. Support is located near the psychological level of 1.3600; a break below this level could trigger a more significant pullback to the 1.3530 (5-day moving average). Overall, the pair remains in a slightly bullish consolidation pattern, with the direction largely dependent on macroeconomic data.
Today, consider going long on GBP/JPY around 1.3670; Stop loss: 1.3660; Target: 1.3720, 1.3710
USD/JPY
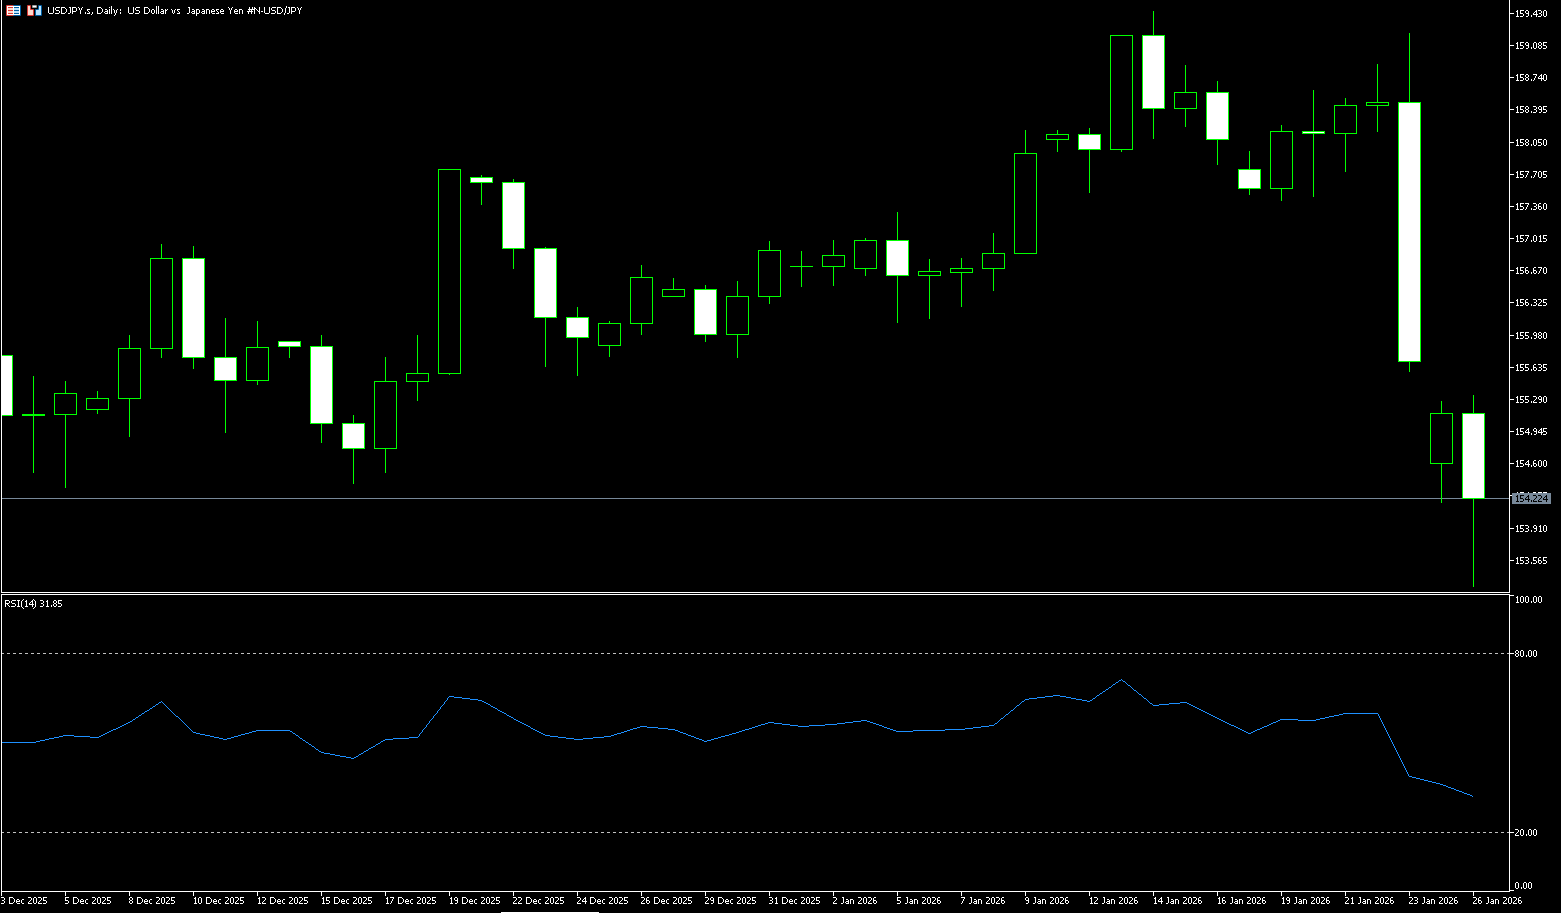
The yen appreciated to around 153.62 per dollar on Monday, rising more than 2% over two trading days to its highest level in over two months, as markets anticipated coordinated intervention from Tokyo and Washington to support the currency. On Sunday, Prime Minister Sanae Takaichi stated that the government would take "necessary measures" to address speculative market volatility, reinforcing the official commitment to stabilizing the yen. A report from the Federal Reserve Bank of New York also provided additional support for the yen; on Friday, the bank checked the USD/JPY level with traders, a move widely interpreted as preparation for potential coordinated intervention in the foreign exchange market. The dollar weakened broadly due to rising geopolitical and trade risks, and market expectations that President Trump might soon replace Fed Chairman Powell with a more dovish successor, further pressuring the dollar.
From a technical perspective, a sustained break and acceptance of the horizontal support level at 154.00 (also close to the 100-day simple moving average at 153.86) would be seen as a new trigger for a USD/JPY bearish move. Momentum has deteriorated as the MACD indicator has slipped below zero and is trending further downwards, suggesting increasing bearish pressure. The Relative Strength Index (RSI) is at 32, near oversold levels, indicating that downward momentum has largely dissipated. If buyers successfully hold the 100-day simple moving average, a rebound to 156.59 (the 59-day moving average) and 157.36 (the 20-day moving average) could be triggered. A daily close below this support level would risk a deeper pullback to 153.89 (Monday's low) and the 153.00 level.
Today, consider shorting the US dollar around 154.34; Stop loss: 154.60; Target: 153.60; 153.50
EUR/USD
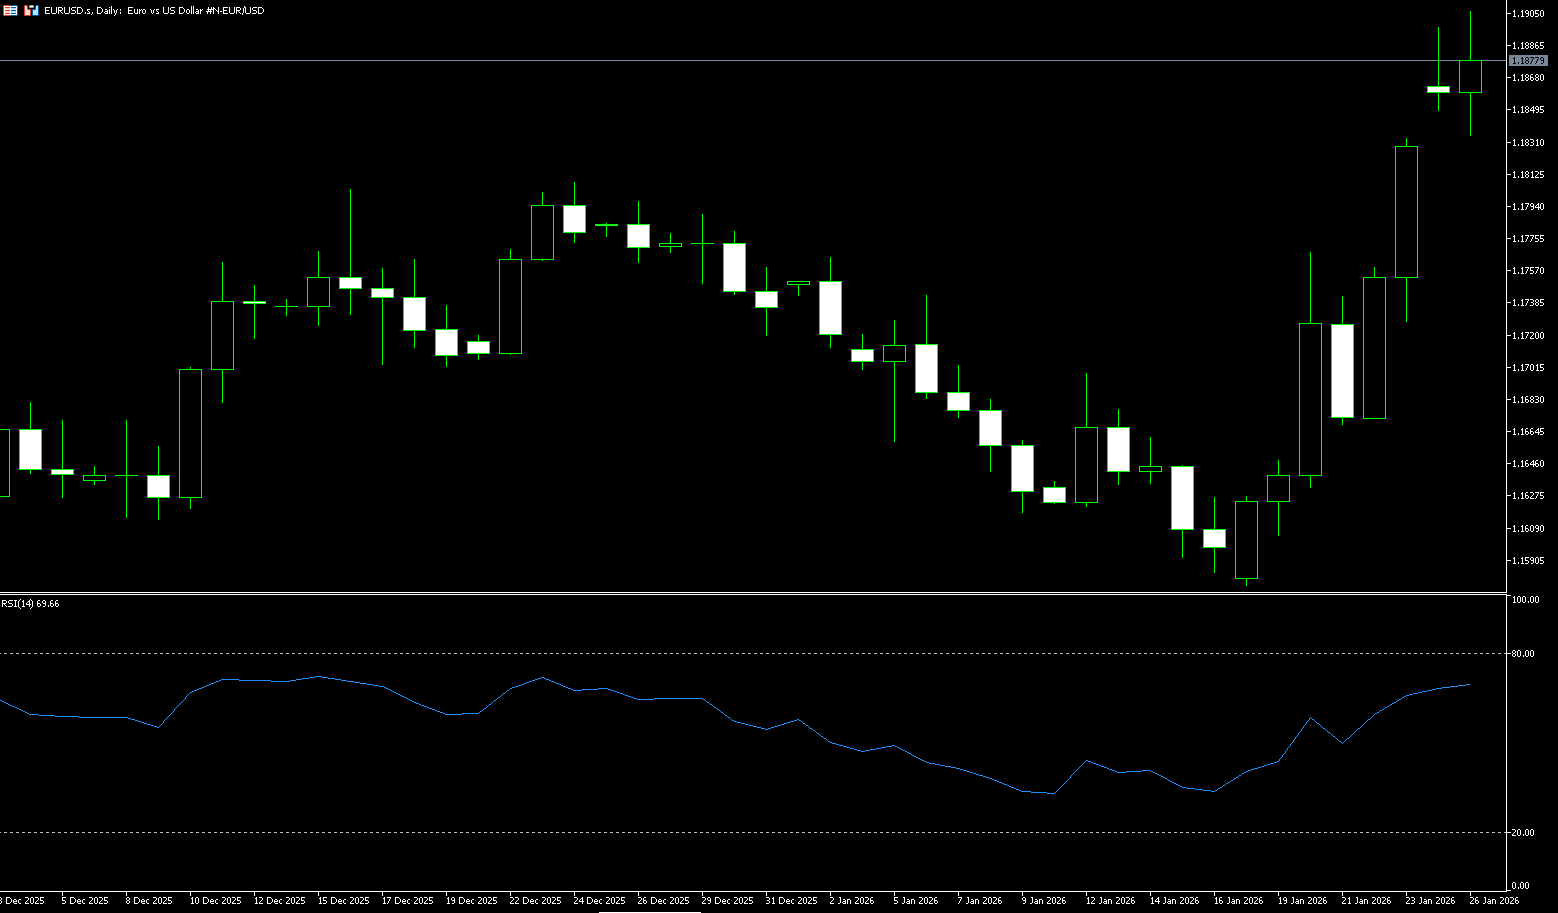
The EUR/USD opened trading around 1.1907 on Monday. The EUR/USD depreciated against the dollar as safe-haven demand pushed it higher, possibly related to recent comments from US President Donald Trump over the weekend. Trump warned that he would impose 100% tariffs on Canadian goods if Ottawa reaches a trade deal with China, the BBC reported over the weekend. However, the dollar was pressured by rumors of possible intervention in the foreign exchange market to support the yen. According to Bloomberg, traders said the Federal Reserve Bank of New York had conducted a so-called interest rate check with major banks, requesting indicative exchange rates, a move widely seen as a signal that authorities might be preparing for another round of intervention.
The EUR/USD technical chart shows a break above the downtrend line drawn from the September and December daily highs, which was cleared around 1.1775, allowing the pair to break above 1.1800 and reach the September high of 1.1907. Momentum measured by the Relative Strength Index (RSI) indicates that buyers are in control. Furthermore, the clear break above the swing high of 1.1807 on December 24th reverses the trend from sideways to upward. For the bullish continuation to materialize, traders must break above 1.1897 (the beginning of the week's high), targeting the 2025 annual high of 1.1918. A break above the latter would open the door to testing the psychological level of 1.2000, with the first key support level being 1.1800 (the psychological level), which could pave the way for a test of the 1.1765 (5-day moving average).
Consider going long on the Euro today around 1.1868; Stop loss: 1.1855; Targets: 1.1920, 1.1930
Disclaimer: The information contained herein (1) is proprietary to BCR and/or its content providers; (2) may not be copied or distributed; (3) is not warranted to be accurate, complete or timely; and, (4) does not constitute advice or a recommendation by BCR or its content providers in respect of the investment in financial instruments. Neither BCR or its content providers are responsible for any damages or losses arising from any use of this information. Past performance is no guarantee of future results.
Lebih Liputan


Pendedahan Risiko:Instrumen derivatif diniagakan di luar bursa dengan margin, yang bermakna ia membawa tahap risiko yang tinggi dan terdapat kemungkinan anda boleh kehilangan seluruh pelaburan anda. Produk-produk ini tidak sesuai untuk semua pelabur. Pastikan anda memahami sepenuhnya risiko dan pertimbangkan dengan teliti keadaan kewangan dan pengalaman dagangan anda sebelum berdagang. Cari nasihat kewangan bebas jika perlu sebelum membuka akaun dengan BCR.
BCR Co Pty Ltd (No. Syarikat 1975046) ialah syarikat yang diperbadankan di bawah undang-undang British Virgin Islands, dengan pejabat berdaftar di Trident Chambers, Wickham’s Cay 1, Road Town, Tortola, British Virgin Islands, dan dilesenkan serta dikawal selia oleh Suruhanjaya Perkhidmatan Kewangan British Virgin Islands di bawah Lesen No. SIBA/L/19/1122.
Open Bridge Limited (No. Syarikat 16701394) ialah syarikat yang diperbadankan di bawah Akta Syarikat 2006 dan berdaftar di England dan Wales, dengan alamat berdaftar di Kemp House, 160 City Road, London, City Road, London, England, EC1V 2NX. Entiti ini bertindak semata-mata sebagai pemproses pembayaran dan tidak menyediakan sebarang perkhidmatan perdagangan atau pelaburan.

 English
 简体中文
简体中文
 繁體中文
繁體中文
 Bahasa
Melayu
Bahasa
Melayu
 Tiếng
Việt
Tiếng
Việt
 ไทย
ไทย
 日本語
日本語
 한국어
한국어
 ភាសាខ្មែរ
 español