


0
US Dollar Index
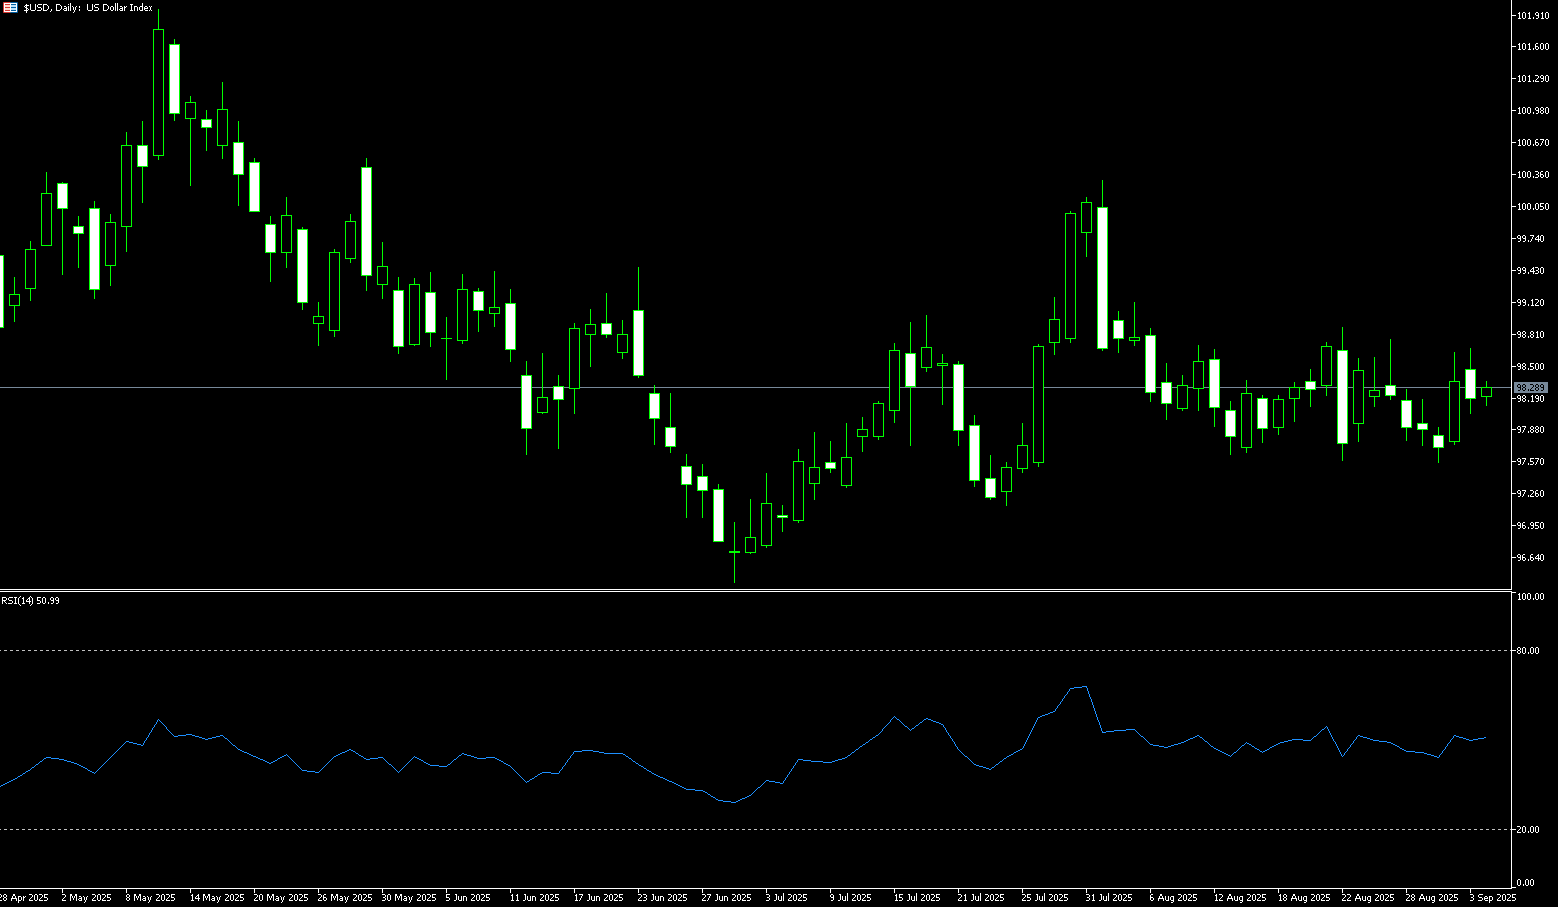
The US dollar index stabilized last week within a narrow range of 97.25 to 98.15, but remained under pressure as the latest inflation data met expectations, giving the Federal Reserve room to ease policy amid a slowing labor market. The August CPI report showed consumer prices rising 0.4% month-over-month, slightly above expectations, while the annual rate remained at 2.9%, in line with expectations. Unemployment benefit applications increased by 27,000 to 263,000, the highest level since 2021, highlighting the weaker employment backdrop. Traders are pricing in a roughly 93% probability of a 25 basis point rate cut at the Federal Reserve's September 17 meeting, with the likelihood of a larger half-percentage point cut also increasing. On the policy front, the United States and Japan issued a joint statement emphasizing that exchange rates should remain market-driven and that excessive volatility is undesirable. Meanwhile, the European Central Bank held its benchmark interest rate unchanged at 2% for the second consecutive meeting. The US dollar is expected to close slightly lower this week.
Late last week, the US dollar index attempted to break through the psychologically important 98.00 level to reach a weekly high of 98.15. However, the rebound failed due to bearish resistance at the 34-day simple moving average at 98.24 and the 50.0% Fibonacci retracement level of 98.32 (the 50.0% Fibonacci retracement level of the 96.38 to 100.26 range). This downside reversal pushed the US dollar index below 97.86 (the 61.8% Fibonacci retracement level), putting further downward pressure on the dollar. The 14-day Relative Strength Index (RSI) on the daily chart is near 46, suggesting that the US dollar index is in a short-term range-bound trading range. If the US dollar index falls below 97.43 (the double bottom formed on July 25 and May 8), the next steps will be to test the seven-week low of 97.11 reached on July 24 and the 97.00 round-figure level. A breakout would signal a move toward 96.38 (the July 1 low). A successful upward move and sustained support above the key 98.15 level (last week's high) this week would indicate the US Dollar Index is temporarily stabilizing at a low level. A close above this level could generate enough momentum to test the 50.0% Fibonacci retracement level of 98.32 (the 96.38 to 100.26 high), with a breakout pointing to resistance at 98.60 (the 100-day simple moving average).
Consider shorting the US Dollar Index at 97.75 today, with a stop-loss at 97.88 and targets at 97.20 or 97.10.
WTI Spot Crude Oil
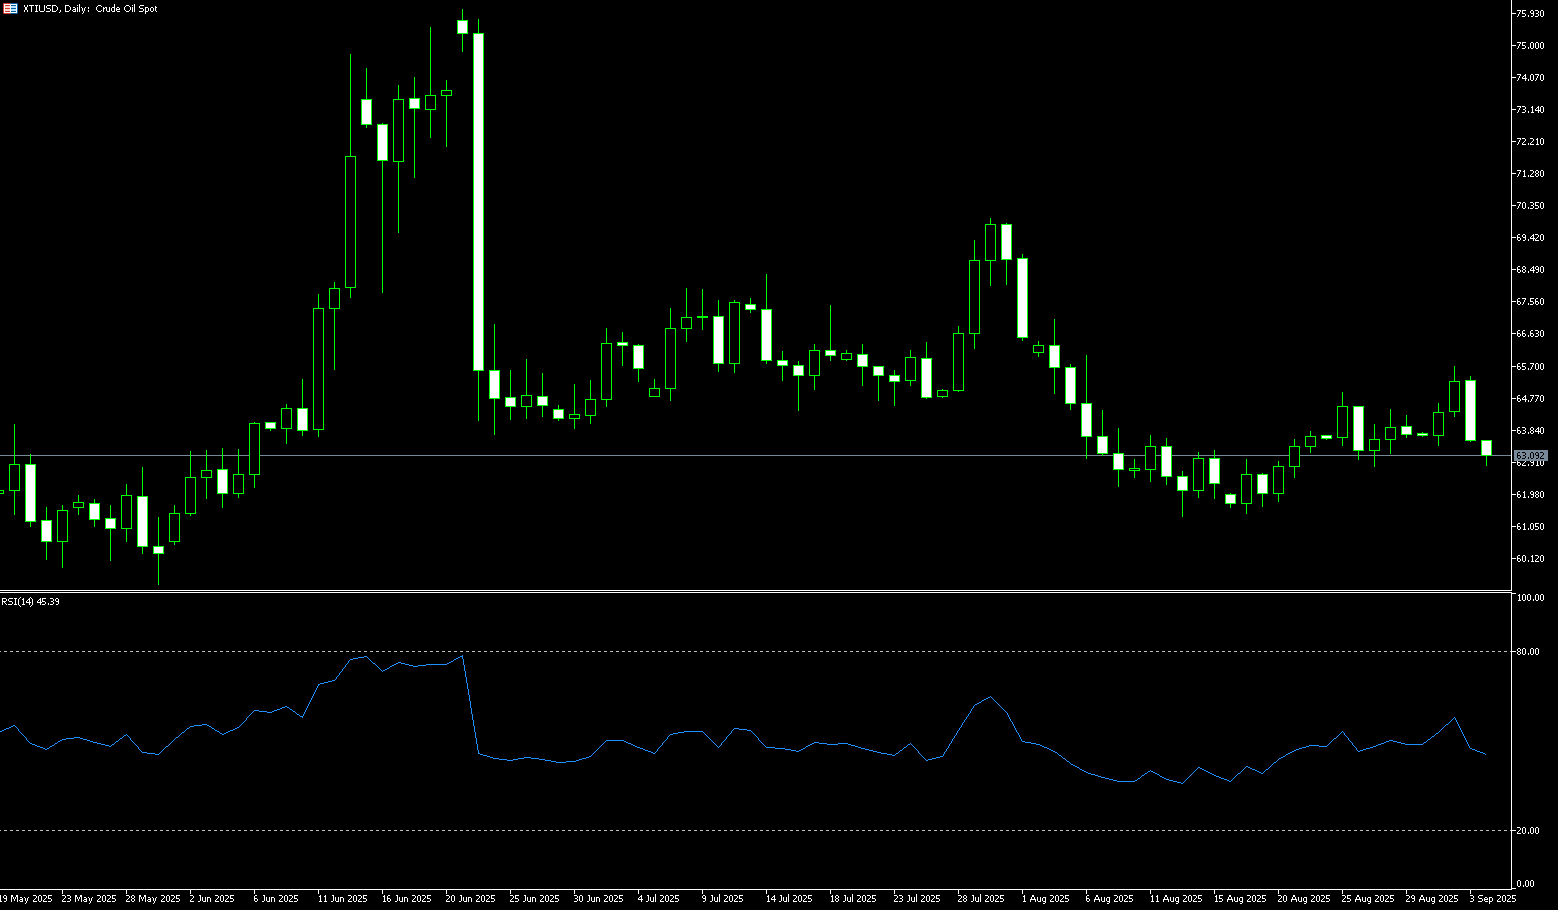
WTI crude oil rebounded slightly by 1.0% last week, recouping the 2.3% drop from the previous trading week. Crude oil prices were buoyed by the Israeli attack on Hamas leadership in Qatar mid-week. The attack initially pushed benchmark crude oil prices up nearly 2%, but the gains subsequently pared back. Furthermore, geopolitical risks escalated further: Poland intercepted drones during Russia's attack on Ukraine, marking the first time a NATO country has directly intervened in such an operation. Despite the heightened tensions, the oil price rally failed to gain momentum. The specter of future oversupply continues to weigh on the market, noting that crude oil prices have fallen by nearly $2 since last week, suggesting that the geopolitical risk premium will be limited in duration without a direct threat to supply. Beyond geopolitics, another political concern is reports that former US President Trump has urged the European Union to impose 100% tariffs on imports from two major countries, including India. These two countries are major buyers of Russian crude oil, and any disruption to their crude oil import channels could have ripple effects on global crude oil flows.
WTI crude oil briefly broke above its 20-day simple moving average ($63.21) last week, reaching a high of $63.78 before retreating below it, highlighting buyers' continued wait-and-see attitude. If oil prices can settle firmly above the 20-day simple moving average, the market outlook is likely to shift to a bullish tone. Traders are currently focusing on resistance at $63.78 (last week's high) and the $64.00 round-figure level. A sustained break above these resistance levels could pave the way for further upside. Subsequent resistance is concentrated at $65.61 (the 50.0% Fibonacci retracement level from $70.02 to $61.20), which could lead to a move towards the 200-day simple moving average at $66.78. On the downside, $60.78 (the June 2 low) offers initial support, while stronger support lies at the psychologically important $60.00 level. A break below this level could target $59.40 (the May-30 low).
Consider going long on crude oil at 62.10 today. Stop-loss: 61.95. Targets: 63.50, 63.80.
Spot Gold
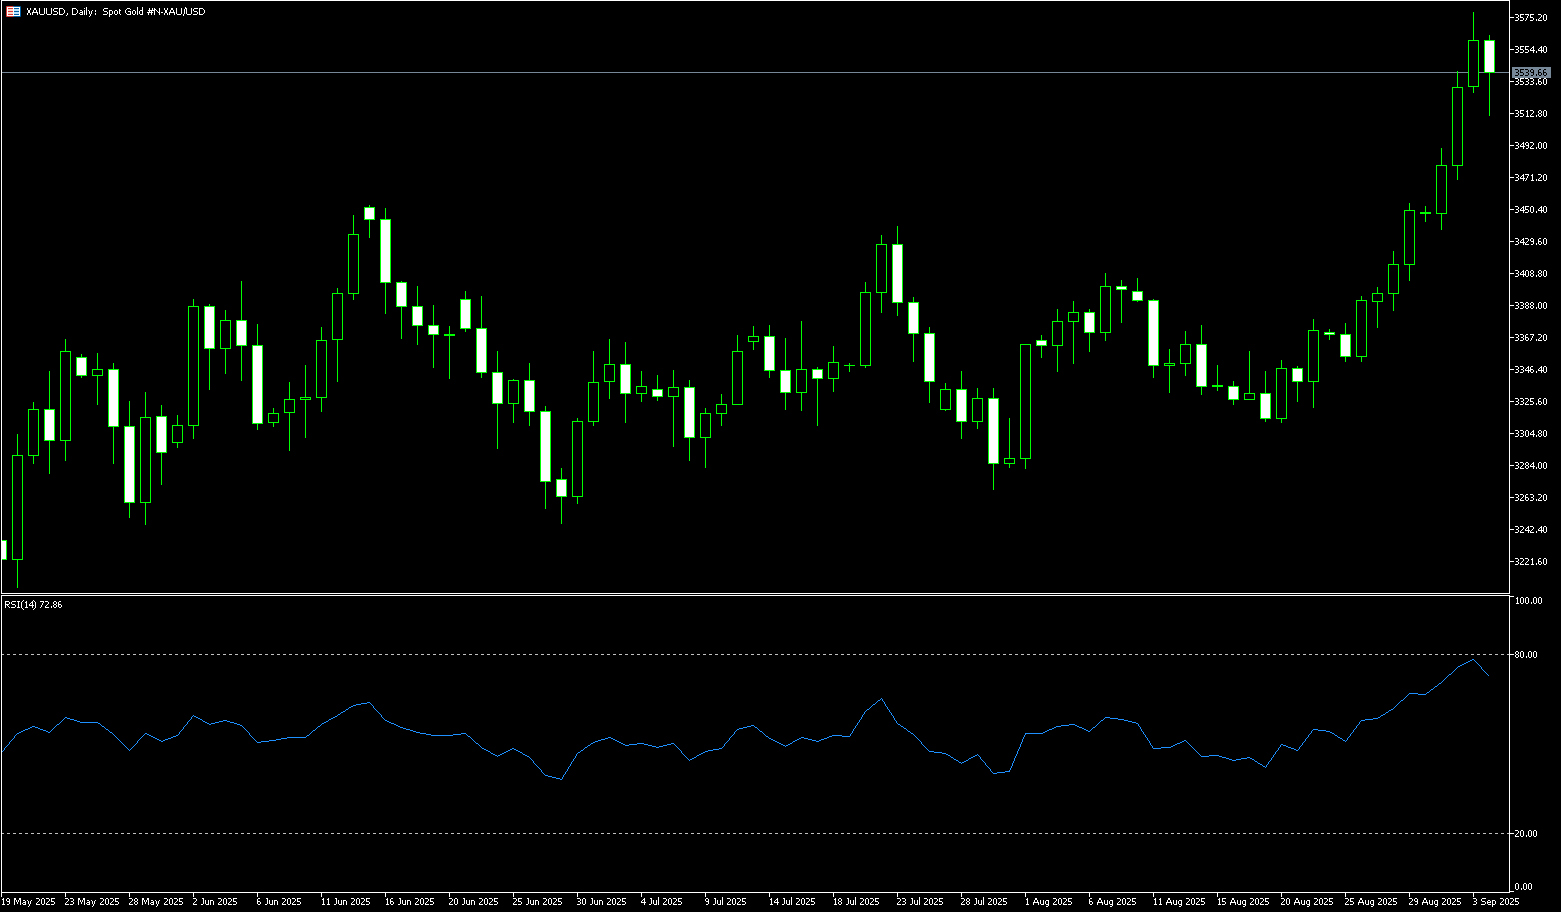
The latest US economic data release is a double-edged sword. On the one hand, inflation indicators show strong resilience, while on the other, signs of weakening labor market conditions are becoming increasingly apparent, directly affecting gold prices. While these dual signals caused market volatility, they ultimately reinforced expectations of a Federal Reserve rate cut next week, providing continued support for gold prices. While inflation is sluggish, this could have weighed on gold prices, as high inflation often aligns with expectations of Fed tightening. However, this has not been the case. Furthermore, fluctuations in the US dollar exchange rate are generally negatively correlated with gold prices, and the dollar's decline following the release of these economic data further supported gold prices. In summary, the gold market has demonstrated strong resilience amidst the interplay of current economic data and policy expectations. While rising inflation and short-term volatility pose challenges, and gold prices face some short-term correction, expectations of a rate cut driven by weak employment, a weakening US dollar, and optimistic reactions from bond and stock markets have provided solid support for gold prices.
Despite a pause in the dollar's decline and rising risk appetite, gold continues to find renewed safe-haven demand. Coupled with weak labor market conditions masking persistent inflation, the dovish narrative remains intact, supporting the non-interest-bearing metal. The daily chart shows renewed strength in gold, despite the 14-day relative strength index (RSI) indicating extreme overbought conditions, currently nearing 77.10. If sellers regain control, immediate support lies at the $3,600 round-figure mark and the $3,601 9-day simple moving average. A break below these levels could lead to a test of last week's low of $3,578.50. A sustained break below the latter would open up new downside potential, targeting the 14-day simple moving average at $3,538. However, if buyers maintain their strength, the record high of $3,675 could be challenged, with the next resistance level at $3,700. Further upside, the $3,750 area could challenge the bearish outlook.
Consider going long on gold at 3,638 today, with a stop-loss at 3,634 and targets at 3,660 and 3,665.
AUD/USD
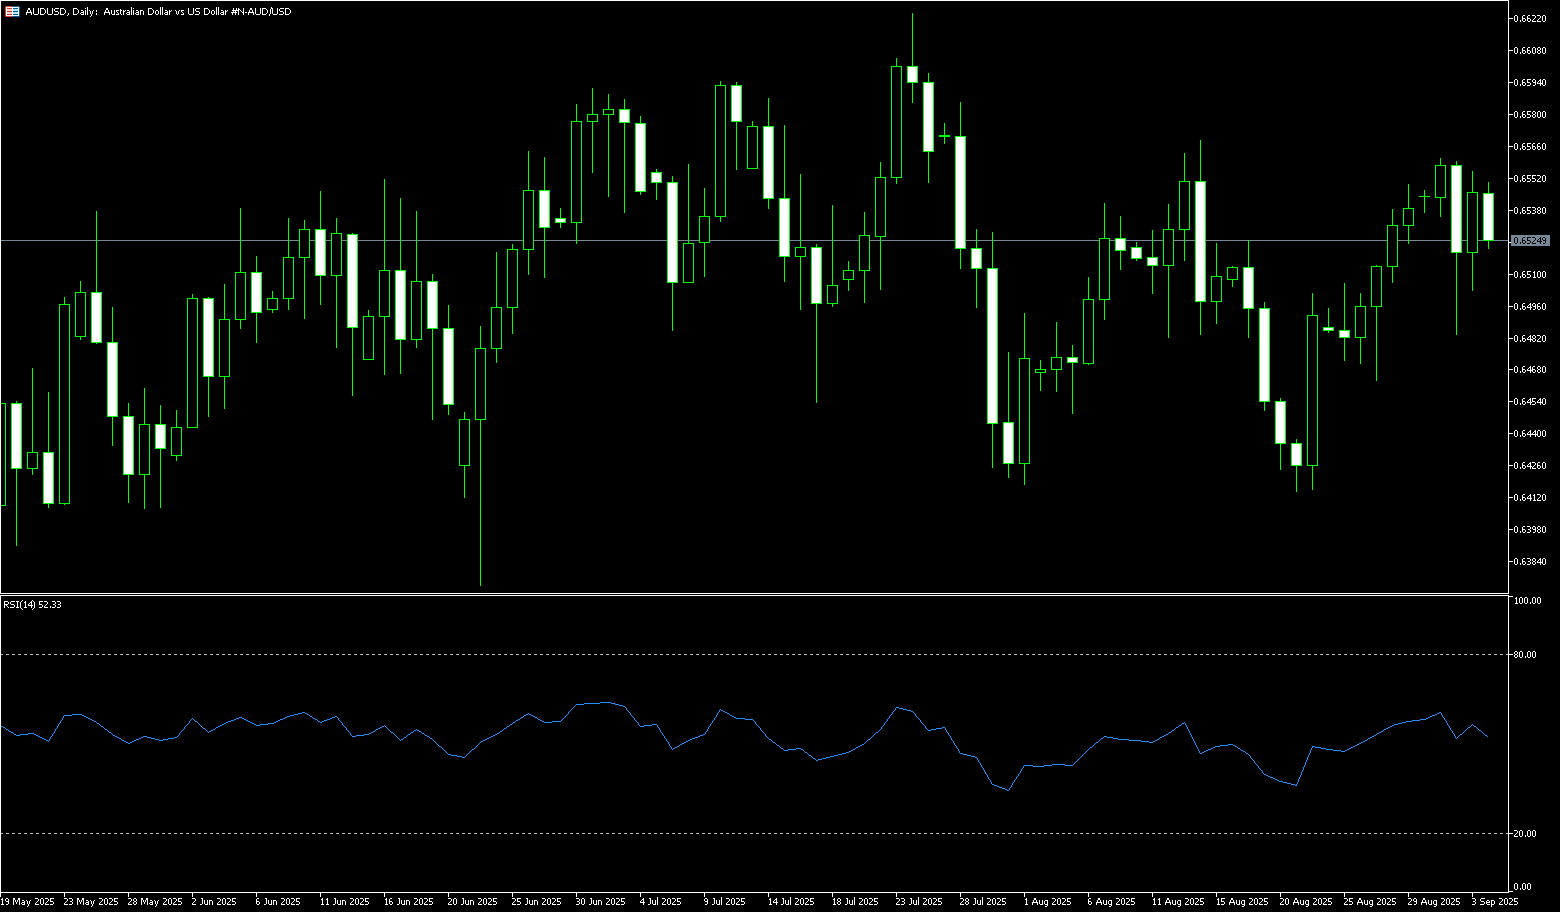
The Australian dollar rose against the US dollar last Friday, reaching 0.6670, its highest level since November 2024. AUD/USD continued to appreciate as weak US jobs data outweighed higher inflation expectations, reinforcing market expectations for a 25 basis point interest rate cut by the Federal Reserve. The probability of a half-percentage point cut by the US central bank is also increasing. The Australian dollar has found support as recent strong Australian economic data has reduced the prospect of further rate cuts, with the market currently pricing in a near 86% probability of a policy hold in September. Australian consumer inflation expectations rose to 4.7% in September, up from a five-month low of 3.9% in August. This increase reflects stronger domestic demand, heightening concerns about resurgent inflationary pressures. Reserve Bank of Australia Governor Michelle Bullock noted that the private sector is beginning to show "a little more growth," which she viewed as positive for the economy.
After hitting 0.6670, its highest level since November 2024, last week, the Australian Dollar (AUD/USD) retreated slightly to around 0.6650. Technical analysis on the daily chart shows that the pair has been moving upward since the beginning of last week, strengthening its bullish bias. Furthermore, the pair is trading above the psychological support level of 0.6600, indicating strong short-term momentum. The 14-day Relative Strength Index (RSI) has risen to around 66.25, suggesting increased momentum in the AUD/USD pair. On the upside, the pair's first targets are the 11-month high of 0.6687 reached in November 2024 and the psychological level of 0.6700. A break below this level would target the 0.6750 level reached on October 14, 2018. Initial support lies at 0.6600 (a psychological support level), followed by the 14-day simple moving average, around 0.6561. A break below this channel would weaken the bullish bias and prompt the pair to test the 25-day simple moving average at 0.6529.
Consider a long AUD at 0.6638 today, with a stop-loss at 0.6625 and a target of 0.6685 or 0.6700.
GBP/USD
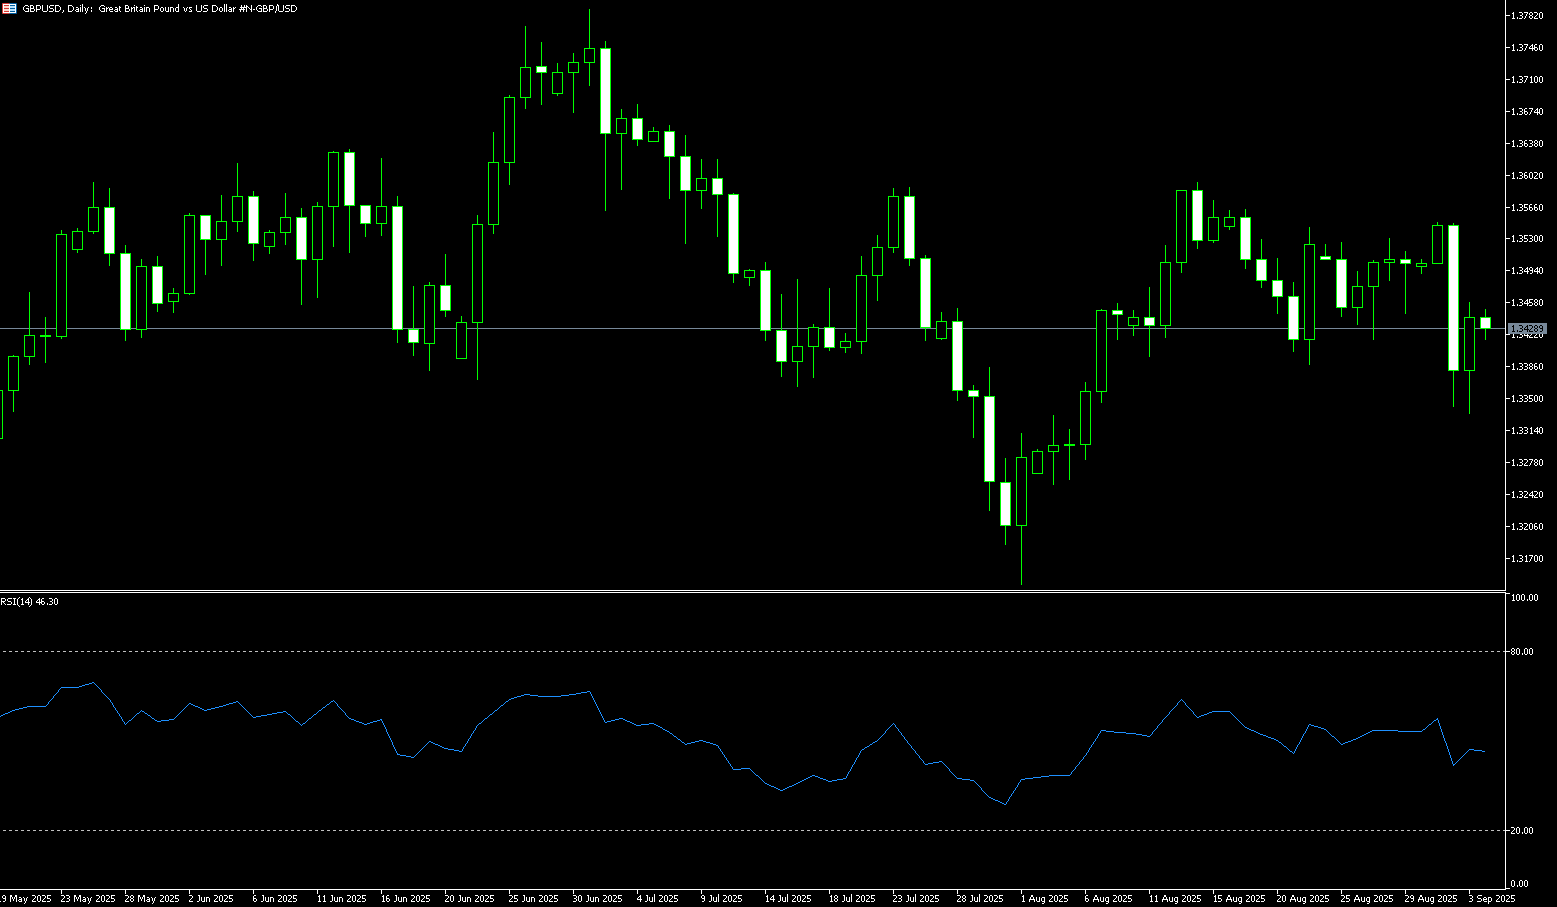
The British pound rebounded slightly last week after the UK Office for National Statistics released weak GDP growth and factory data for July. The UK economy remained stagnant in July, in line with expectations, following a 0.4% expansion in June. Meanwhile, the services index (July) rose 0.4% month-over-month, unchanged from 0.4% in June. Other data from the UK showed that industrial and manufacturing production fell by 0.9% and 1.3%, respectively, in July. Both figures fell short of market expectations. The disappointing UK economic data failed to impact the British pound. Growing concerns about the UK economy may force traders to increase bets on further interest rate cuts from the Bank of England during the remainder of the year. For fresh clues about the interest rate outlook, investors will be closely watching next Thursday's monetary policy announcement, where the central bank is expected to keep its lending rate unchanged at 4%. In its August monetary policy announcement, the Bank of England cut interest rates by 25 basis points and guided for "gradual and cautious" monetary expansion. The next key trigger for the British pound will be employment data for the three months ending in July, expected to be released on Tuesday.
The daily chart shows that the British pound sterling fluctuated between 1.3482 and 1.3590 against the US dollar last week. The 14-day Relative Strength Index (RSI) technical indicator has retreated from its highs to a neutral level of 56, indicating a short-term struggle between buyers and sellers at the current price level. GBP/USD's short-term trend remains sideways, trading close to its 5-day exponential moving average, which is around 1.3546. Currently, the pair is trading within an ascending triangle pattern, indicating hesitation among investors. Horizontal resistance in this chart pattern is around 1.3580. If GBP/USD breaks above the ascending triangle resistance line at 1.3580 and the September 9 high at 1.3590, it could target immediate resistance at 1.3662, the July 7 high. A break above this key resistance area would support the pair towards its highest point since October 2021, at 1.3788. On the downside, key support lies at the psychological level of 1.3500 and the 85-day simple moving average at 1.3498. Next up is the 34-day simple moving average at 1.3453. A break below these levels would weaken short- and medium-term price momentum and exert downward pressure on the pair, causing it to hover around the 1.3400 level.
Consider a long position on the GBP at 1.3545 today, with a stop loss at 1.3530 and a target at 1.3600. 1.3620
USD/JPY
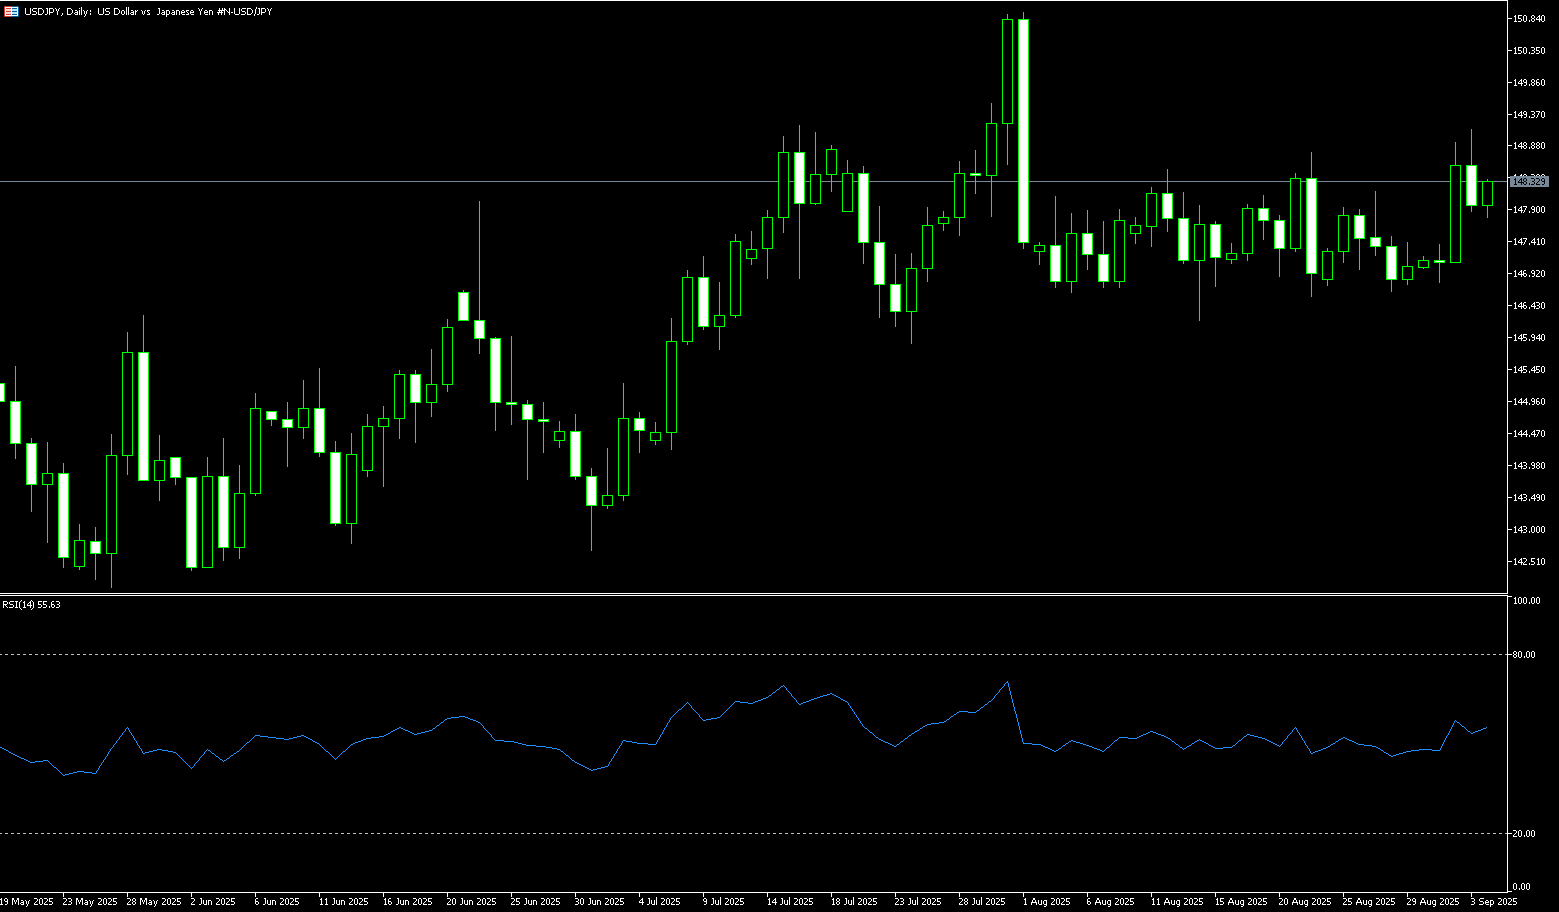
The yen continued to trade in a narrow range below 148.00 against a generally weakening US dollar. Investors now anticipate that domestic political uncertainty may make the Bank of Japan more cautious in raising interest rates. Furthermore, the resignation of Japanese Prime Minister Shigeru Ishiba has added a layer of uncertainty, which could temporarily hinder the Bank of Japan's policy normalization and continue to act as a headwind for the yen. Concerns that Ishiba's successor might pressure the central bank to maintain low interest rates have failed to attract any significant buying for the yen. Furthermore, widespread risk appetite is seen as another factor further weakening the safe-haven yen. Meanwhile, macroeconomic data from Japan further reaffirmed market expectations that the Bank of Japan will stick to its policy normalization path, limiting aggressive bets by yen bears. Meanwhile, the US dollar fell to its lowest level since July 24th due to market bets on more aggressive policy easing by the Federal Reserve. This will further limit gains in the USD/JPY pair.
From a technical perspective, USD/JPY's resilience below the 148.00 mark and subsequent rebound favors the pair's bulls, although neutral technical indicators on the daily chart warrant some caution. Therefore, any further gains are more likely to face strong resistance in the 148.15-148.20 area or near the overnight high. However, a sustained strong breakout should pave the way for a challenge to the 200-day simple moving average, currently located in the 148.76 area. This is closely followed by the 149.00 mark and the monthly high, around 14 A decisive breakout above the 9.15 area would be seen as a new trigger point for bulls, potentially reaching the psychologically important 150 level. On the other hand, a break below the 147.00 round-figure mark would expose support at last week's key low of 146.31. A decisive break below, followed by a breakout above 146.00, could accelerate USD/JPY's decline to the 110-day simple moving average of 145.73, potentially approaching the psychologically important 145.00 level.
Consider shorting the USD at 147.86 today. Stop-loss: 148.05, target: 146.80-146.60.
EUR/USD
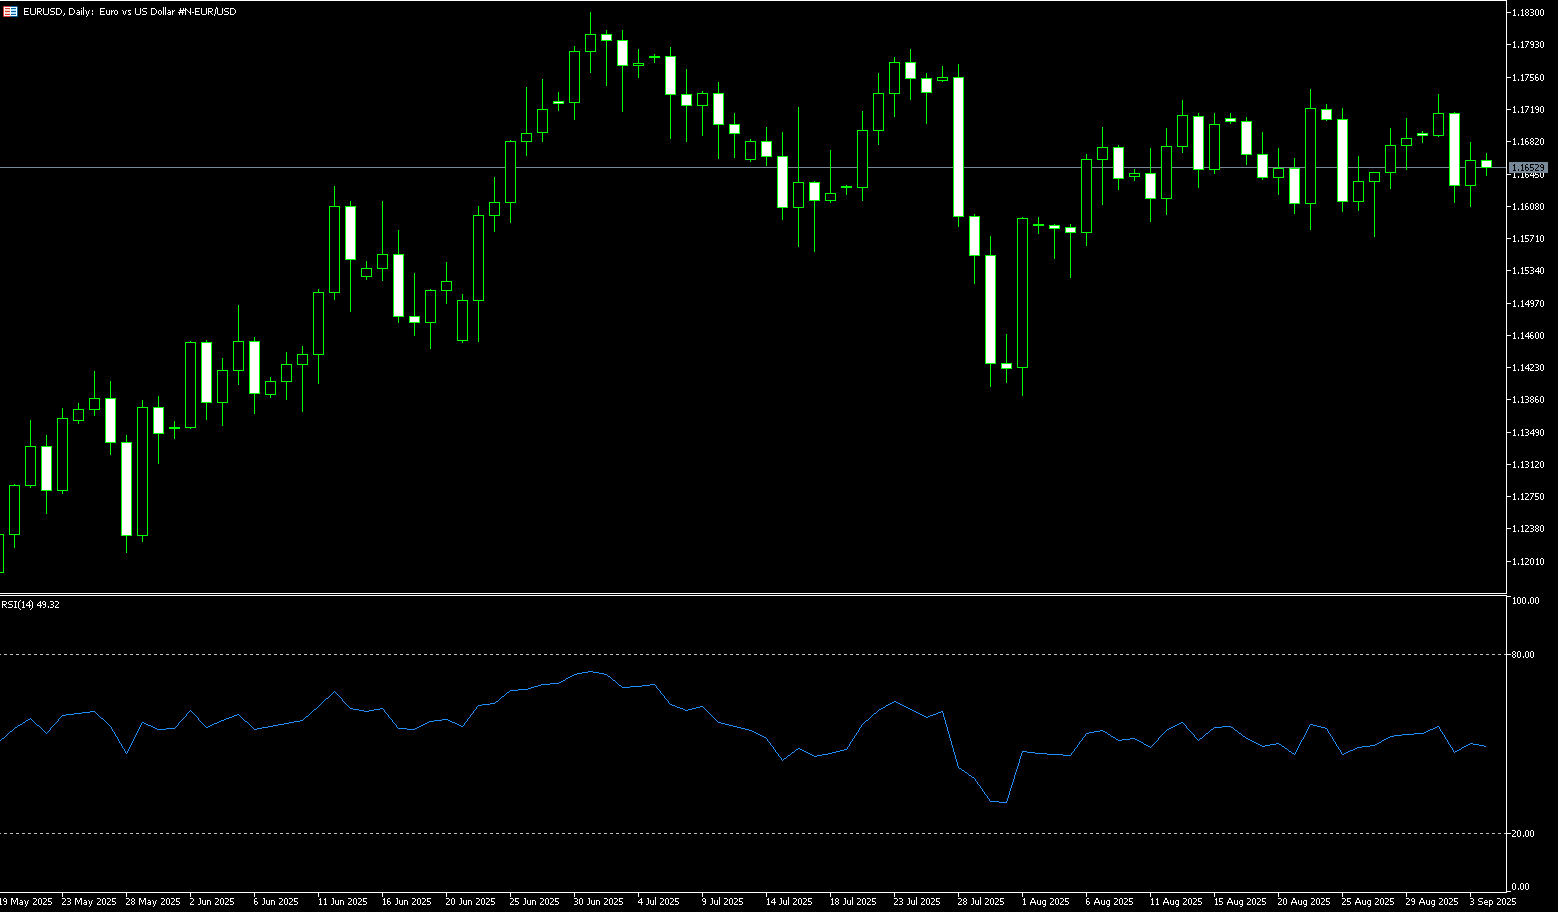
The European Central Bank decided to keep interest rates unchanged at its September policy meeting last Thursday, as economic uncertainty persists following US President Donald Trump's aggressive tariff policies. The ECB maintained its so-called deposit facility rate at 2.0% and struck an optimistic tone on economic growth and inflation, reducing expectations for further cuts in borrowing costs. EUR/USD strengthened, rising above 1.1700, but potential downside may be limited given rising bets on a US Federal Reserve rate cut next week. Traders increased their bets that the ECB has stopped cutting rates, which could support the euro in the short term. Across the pond, a surge in US initial jobless claims and a slight rise in inflation have investors focused on Fed rate cuts next week and beyond. The market has fully priced in a September rate cut and now expects three cuts this year, compared to just two a few weeks ago. Fed Chairman Jerome Powell and other policymakers have signaled an accommodative monetary policy despite the risks of tariff-related inflation. The dovish tone from Fed officials is likely to put pressure on the US dollar and create tailwinds for major currency pairs.
From a technical perspective, the EUR/USD daily chart shows that the pair remains within familiar levels, finding buying interest after briefly breaking above the flat 25-day simple moving average, currently around 1.1670. Meanwhile, the 14-day relative strength index (RSI) is flashing a bullish signal (currently at 55.50) and has surpassed the key resistance level of 1.1700, suggesting the pair could rally further in the short term. On the other hand, EUR/USD resumed its upward trend last Thursday, forming a bullish "piercing-the-head" pattern, suggesting further gains. If EUR/USD breaks above 1.1780 (last week's trading point), the next key resistance level will be the psychological level of 1.1800 and the year-to-date high of 1.1830. Currently, the 1.1700 level provides short-term support. If the pair falls below 1.1700, the first support level will be the 25-day simple moving average of 1.1670. The price could fall further towards the 80-day simple moving average (SMA) at 1.1612 and the 1.1600 level.
Today, consider buying the euro at 1.1723, with a stop loss at 1.1710 and a target at 1.1780 or 1.1795.
Disclaimer: The information contained herein (1) is proprietary to BCR and/or its content providers; (2) may not be copied or distributed; (3) is not warranted to be accurate, complete or timely; and, (4) does not constitute advice or a recommendation by BCR or its content providers in respect of the investment in financial instruments. Neither BCR or its content providers are responsible for any damages or losses arising from any use of this information. Past performance is no guarantee of future results.
Lebih Liputan


Pendedahan Risiko:Instrumen derivatif diniagakan di luar bursa dengan margin, yang bermakna ia membawa tahap risiko yang tinggi dan terdapat kemungkinan anda boleh kehilangan seluruh pelaburan anda. Produk-produk ini tidak sesuai untuk semua pelabur. Pastikan anda memahami sepenuhnya risiko dan pertimbangkan dengan teliti keadaan kewangan dan pengalaman dagangan anda sebelum berdagang. Cari nasihat kewangan bebas jika perlu sebelum membuka akaun dengan BCR.

 English
 简体中文
简体中文
 繁體中文
繁體中文
 Bahasa
Melayu
Bahasa
Melayu
 Tiếng
Việt
Tiếng
Việt
 ไทย
ไทย
 日本語
日本語
 한국어
한국어
 ភាសាខ្មែរ
 español