


0
US Dollar Index
The US Dollar Index struggled to extend its rebound in Tuesday’s trading, hovering in the 98.80 area after recovering slightly from a three-year low of 98.01. The rebound occurred as markets reopened after the Easter holiday and re-evaluated the broader macro environment. However, renewed concerns about the Fed’s autonomy due to President Trump’s continued attacks on Fed Chairman Powell limited the upward attempt. The US Dollar Index fell deep into the red zone in the early part of the week, sliding towards the 97.91 area, a three-year low. This sharp decline was due to the market’s concerns about the integrity of the Federal Reserve institution, as US President Trump once again publicly criticized Fed Chairman Powell and confirmed that he was exploring ways to remove him from his position. Trump accused Powell of manipulating interest rates for political purposes and called him “too late” to respond to the economic situation.
The technical background of the US Dollar Index remains severely bearish. The pair traded around 98.50, close to the bottom of the early week range (97.91–99.21), showing a strong negative bias. The daily chart's technical indicator 14 Relative Strength Index (RSI) has fallen to 25.28, entering deep oversold territory, while the Moving Average Convergence/Divergence (MACD) continues to send sell signals. The bearish sentiment is confirmed by the short-term key moving averages: the 9-day SMA at 99.48, the 20-day at 101.72, and the 50-day at 103.88 - all trending downwards. This further reinforces the resistance above the current level. The first key resistance level is at 98.65, followed by 99.00 {round numbers} and the 9-day SMA at 99.48. Although some short-term oscillators such as the Ultimate Oscillator (37.76) and the Amazing Oscillator (−3.54) appear neutral, the dominant structure remains clearly negative. Unless the political situation becomes clearer or risk sentiment changes, the US dollar index seems ready to fall further to 98.00 {round mark} and 97.91 {Monday low}, and then 97.72 {March 10, 2022 low} level.
Today, you can consider shorting the US dollar index around 99.10, stop loss: 99.30, target: 98.60, 98.50

WTI spot crude oil
On Thursday (March 27), international oil prices rose slightly as market participants were evaluating the impact of tightening global crude oil supply and the latest US tariffs on the global economy and energy demand. On Tuesday, the weakening of the US dollar and the uncertainty of the impact of trade tensions on the economy stimulated safe-haven demand. Trump's attack on Powell may threaten the independence of the Federal Reserve, which has dealt a new blow to investors' confidence in the US economy. US crude oil rebounded and traded around $63.00 per barrel. Oil prices fell more than 2% at the beginning of the week due to signs of progress in negotiations between the United States and Iran, while investors are still worried that the obstacles to the economy caused by tariffs may suppress fuel demand. Due to the Easter holiday, market liquidity is also low, and the decline in oil prices at the beginning of the week may be exaggerated, which may exacerbate price fluctuations. But the underlying trend suggests that prices are still likely to fall further. Iran's foreign minister said that during the talks, the United States and Iran agreed to start working on a possible nuclear deal framework, and a U.S. official called the talks "very good progress."
With crude oil prices stagnating below key technical levels and new supply risks from Iran looming, the short-term outlook tends to be bearish. However, the underlying trend suggests that prices still have the potential to fall further. If the resistance level of $63.06 cannot be recovered, the support level of $59.33 may be tested in the short term, especially if the upcoming U.S. Purchasing Managers' Index (PMI) data exacerbates concerns about an economic slowdown. WTI crude oil futures fell, struggling to maintain last week's upward momentum after failing to break through the resistance level near $64.18. With prices now below the 20-day simple moving average of the key turning point of $64.68, traders are watching whether prices may pull back to the support level of $60.00 {market psychological level}. However, the overall trend indicators still show bearishness. On the downside, at $62.00 {round mark}, the next level is $61.84 {9-day moving average}, and $60.00 {market psychological mark} level.
Consider going long on crude oil around 63.20 today, stop loss: 63.00; target: 64.80; 65.00

Spot gold
Gold prices retreated after hitting a record high of $3,500, but traders’ profit-taking and improved risk appetite kept gold prices down despite lower U.S. Treasury yields. As of writing, gold/dollar hovered around $3,400, down more than 0.63%. The latest news from U.S. Treasury Secretary Scott Bessent that he saw easing relations with China improve market sentiment, which posed a headwind for gold prices. Since the release of this news, gold prices have slipped $50 from around $3,420 to $3,370. Still, uncertainty over U.S. trade policy and President Trump’s attacks on the Federal Reserve could boost demand for gold and drive prices higher. So far this year, gold prices have risen nearly 29% on geopolitical and Trump’s mood swings. Last week, Fed Chairman Jerome Powell said the Fed will continue to be data-dependent and even mentioned the possibility of stagflation, acknowledging that “we may find ourselves in a tension between our dual mandate objectives.”
From a technical perspective, gold bulls have a strong advantage in the overall near-term technical picture. Bulls hit an upside price objective of $3,500.00 yesterday, a strong resistance level. The next near-term downside price objective for the bears is to push prices below solid technical support at $3,350.00. The uptrend in gold prices continues, even though there is a possibility of a test of the $3,500 level within the next three months. The 14-day relative strength index (RSI) on the daily chart has turned overbought, suggesting that the precious metal could see a pullback, but a breakout of the latest high suggests that bulls could reach $3,450 in the short term. The first resistance is seen at the contract high of $3,450, followed by $3,480.00, and the target level of $3,500 in the next three months. Conversely, if gold/USD falls below $3,400, the first support level will be the April 17 high of $3,357, followed by $3,300.
Consider going long gold before 3,375 today, stop loss: 3,370; target: 3,420; 3430

AUD/USD
The Australian dollar extended its gains against the U.S. dollar on Tuesday. Investor sentiment was hit by U.S. President Trump's renewed criticism of Federal Reserve Chairman Powell, which led to an appreciation of the Australian dollar/US dollar, rekindling concerns about the independence of the Federal Reserve. Another reason for market tensions is the continued deadlock in global trade negotiations. China has remained firm in the face of Trump's aggressive tariff strategy, further weighing on investor confidence. Nevertheless, tensions remain, and the White House's tariffs on Chinese ships docked in U.S. ports may disrupt global shipping routes. However, Trump said late Thursday that China had made several concessions, saying: "I don't want to raise tariffs on China. If China's tariffs go up, people won't buy." He also expressed optimism that a trade deal could be reached within three to four weeks.
AUD/USD traded close to 0.6420 on Tuesday, with technical indicators on the daily chart showing a bullish outlook. The pair remains above the 10-day simple moving average (06332), while the 14-day relative strength index (RSI) remains around 62.00, both pointing to continued upward momentum. On the upside, the 0.6468 {200-day simple moving average} level is at hand. A decisive break above this area could pave the way for a move towards the 0.6500 round-figure mark, and the five-month high of 0.6515. Initial support is at the 0.6350 mark, with further downside protection at 0.6332 near the 10-day simple moving average. A break below these levels could weaken the short-term bullish bias and expose the AUD/USD pair to deeper losses towards the 0.6300 psychological area.
Consider going long AUD before 0.6350 today, Stop Loss: 0.6340; Target: 0.6400; 0.6410

GBP/USD
GBP/USD is trading in positive territory near 1.3424, its highest since September last year, during early Asian session on Tuesday. Concerns about a slowing U.S. economy and concerns about the independence of the Federal Reserve dragged the dollar lower, creating a tailwind for major currency pairs. U.S. President Donald Trump slammed Fed Chairman Powell for continuing to support a "wait-and-see" mode of monetary policy until there is a clearer picture of how the new tariff policy will affect the economic outlook. Speaking on Truth Social, Trump warned that the U.S. economy will slow unless Powell cuts interest rates immediately. Heightened uncertainty from Trump's tariffs and growing trade tensions between the U.S. and China have weakened the dollar on all fronts. On the other hand, softer UK CPI inflation data for March and global uncertainty pave the way for the Bank of England to cut interest rates at its May policy meeting. This in turn could put pressure on the pound against the dollar.
GBP/USD continues its winning streak since April 8, with technical analysis of the daily chart showing that the pair continued to rise near 1.3424, a high since September last year, maintaining a bullish trend. In addition, GBP/USD continues to trade above the 10-day simple moving average of 1.3188, further strengthening short-term bullish momentum. However, the 14-day relative strength index (RSI) of the technical indicator has dissolved back to 70, indicating an overbought state and suggesting that a potential downside correction may be imminent. GBP/USD encounters initial resistance at 1.3455 {upper rail of the daily chart uptrend channel}, followed by 1.3500 {round mark}. On the downside, recent support is at 1.3188 of the 10-day simple moving average, followed by 1.3100 {round mark} level.
Today, we recommend going long GBP before 1.3315, stop loss: 1.3310, target: 1.3370, 1.3380

USD/JPY
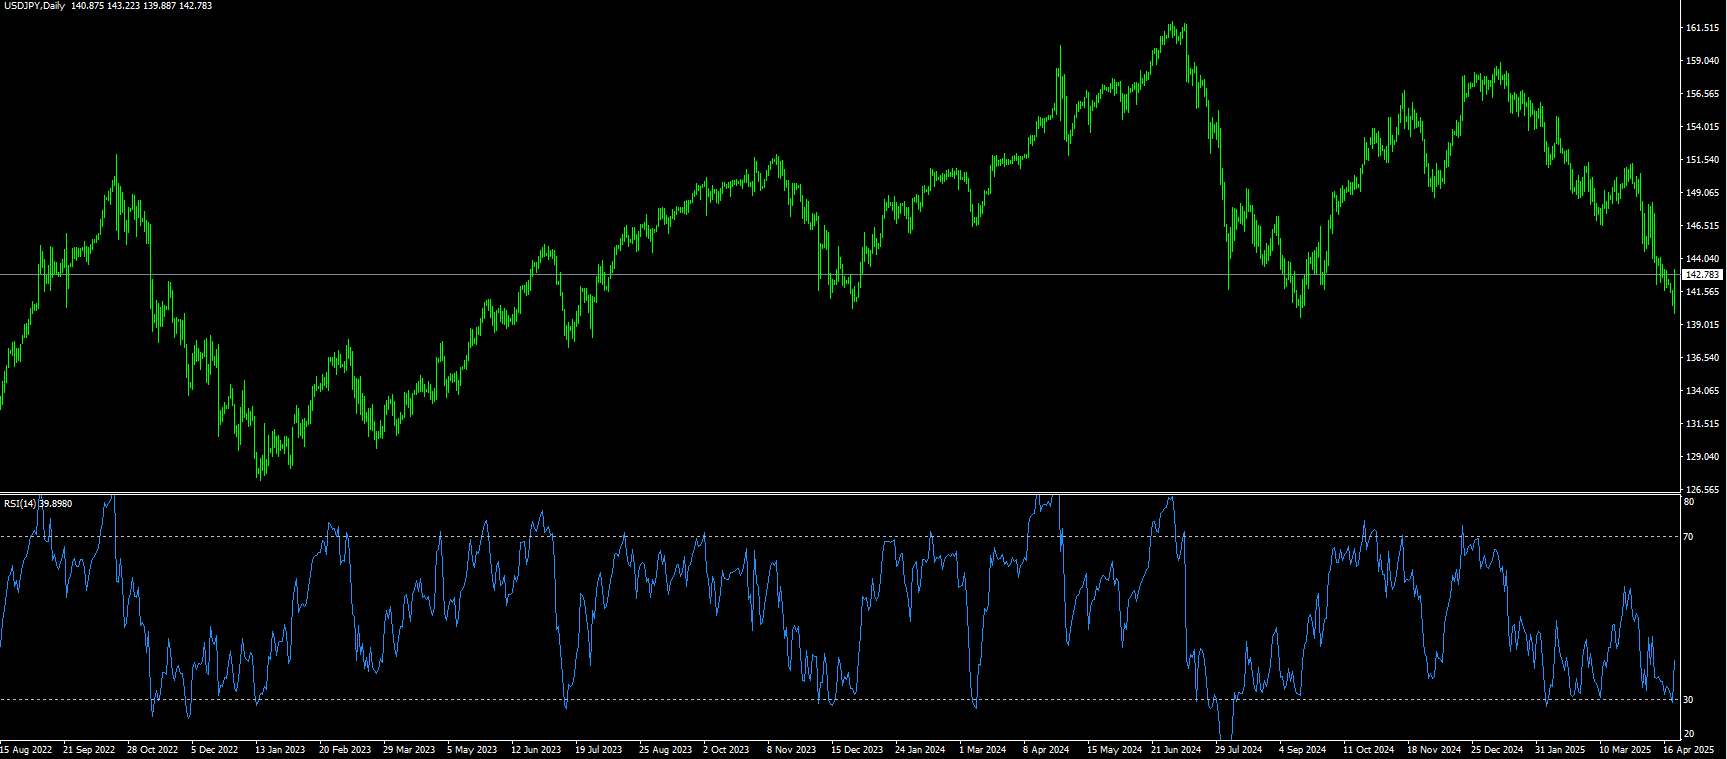
The USD/JPY pair struggled to recover on Tuesday, trading around 142.00 in the North American session, after rebounding from early lows around 140.65. The pair's modest rebound came as markets stabilized, but gains remained limited due to ongoing concerns about the Fed's autonomy. President Trump's continued attacks on Fed Chairman Powell - who he called a "major loser" - have shaken market confidence in the credibility of the dollar. White House officials acknowledged that the administration is exploring legal ways to remove Powell, further exacerbating market unease. Meanwhile, the yen benefited from safe-haven demand and market expectations that the Bank of Japan will continue to raise interest rates, despite continued uncertainty related to global tariffs. The continued uncertainty surrounding US-China trade policy further consolidated the yen's recent gains. The yen attracted safe-haven funds for the third consecutive day on Tuesday due to concerns that US President Trump's tariff policies and the escalating US-China trade war could trigger a global recession.
From a technical perspective, the 14-day relative strength index (RSI) on the daily chart is at a slightly oversold level of 26.67, making traders reluctant to make new bearish bets around USD/JPY. However, any subsequent gains may face strong resistance around the 141.65-141.60 levels. That said, a sustained strong breakout could trigger a short-term covering rally and push the spot price above the 142.00 round number mark towards the next relevant barrier in the 142.35-142.40 area. On the other hand, the 140.00 psychological barrier area and Tuesday's low of 139.92 now seem to protect the immediate downside, below which USD/JPY may accelerate its decline towards the 140.00 psychological mark. The downward trajectory may extend further to challenge the 2024 annual swing low of 139.58. A break below this level will see the 138.77 {July 19, 2023 low} level.
Today, we recommend shorting the dollar before 141.80, stop loss: 142.00; target: 141.20, 141.00
EUR/USD
The pair slipped slightly after the European close during Tuesday's trading session. Despite the intraday decline, the currency pair maintained its broader upward trajectory. In early Asian trading on Tuesday, EUR/USD extended its gains around 1.1520, pressured by a weaker dollar. The dollar index fell to its lowest point since March 2022, near 97.0, as traders' confidence in the US economy continued to decline. U.S. President Trump stepped up his criticism of Federal Reserve Chairman Powell via social media on Monday, calling him a "major loser" and warning that the U.S. economy could slow down if the Fed does not immediately cut interest rates. Concerns about a slowdown in the world's largest economy, and more concerns that Trump may fire Powell, put some selling pressure on the dollar and provided a tailwind for EUR/USD. For anyone bearish on the dollar, it's a buffet: from high uncertainty about the self-harm caused by tariffs to a loss of confidence ahead of Powell's news. Moreover, the optimism surrounding the trade talks may provide some support to the EUR/USD pair in the short term.
EUR/USD extended its rally for the third session during the Asian session on Tuesday, trading around 1.1530. Technical analysis on the daily chart indicates increasing buying pressure and the pair is moving upwards within an ascending channel pattern. Moreover, the EUR/USD pair remains above the 10-day simple moving average (1.1330), suggesting strengthening price momentum in the short term. However, the 14-day relative strength index (RSI), a key momentum indicator, suggests that the pair has retreated from the overbought zone and a downside correction is imminent. On the upside, the EUR/USD pair could retest 1.1573, the highest point since November 2021, recorded on April 21. A break above this level could strengthen the bullish bias and allow the pair to explore the psychological 1.1600 market level, and further towards the 1.1665 {October 25, 2021 high} area. EUR/USD may test the near-term support level of 1.1400{round mark}, followed by 1.1317{10-day moving average} level.
Today, it is recommended to go long on the euro before 1.1400, stop loss: 1.1390 target: 1.1460, 1.1470.

Disclaimer: The information contained herein (1) is proprietary to BCR and/or its content providers; (2) may not be copied or distributed; (3) is not warranted to be accurate, complete or timely; and, (4) does not constitute advice or a recommendation by BCR or its content providers in respect of the investment in financial instruments. Neither BCR or its content providers are responsible for any damages or losses arising from any use of this information. Past performance is no guarantee of future results.
Lebih Liputan


Pendedahan Risiko:Instrumen derivatif diniagakan di luar bursa dengan margin, yang bermakna ia membawa tahap risiko yang tinggi dan terdapat kemungkinan anda boleh kehilangan seluruh pelaburan anda. Produk-produk ini tidak sesuai untuk semua pelabur. Pastikan anda memahami sepenuhnya risiko dan pertimbangkan dengan teliti keadaan kewangan dan pengalaman dagangan anda sebelum berdagang. Cari nasihat kewangan bebas jika perlu sebelum membuka akaun dengan BCR.

 English
 简体中文
简体中文
 繁體中文
繁體中文
 Bahasa
Melayu
Bahasa
Melayu
 Tiếng
Việt
Tiếng
Việt
 ไทย
ไทย
 日本語
日本語
 한국어
한국어
 ភាសាខ្មែរ
 español