


0
US Dollar Index
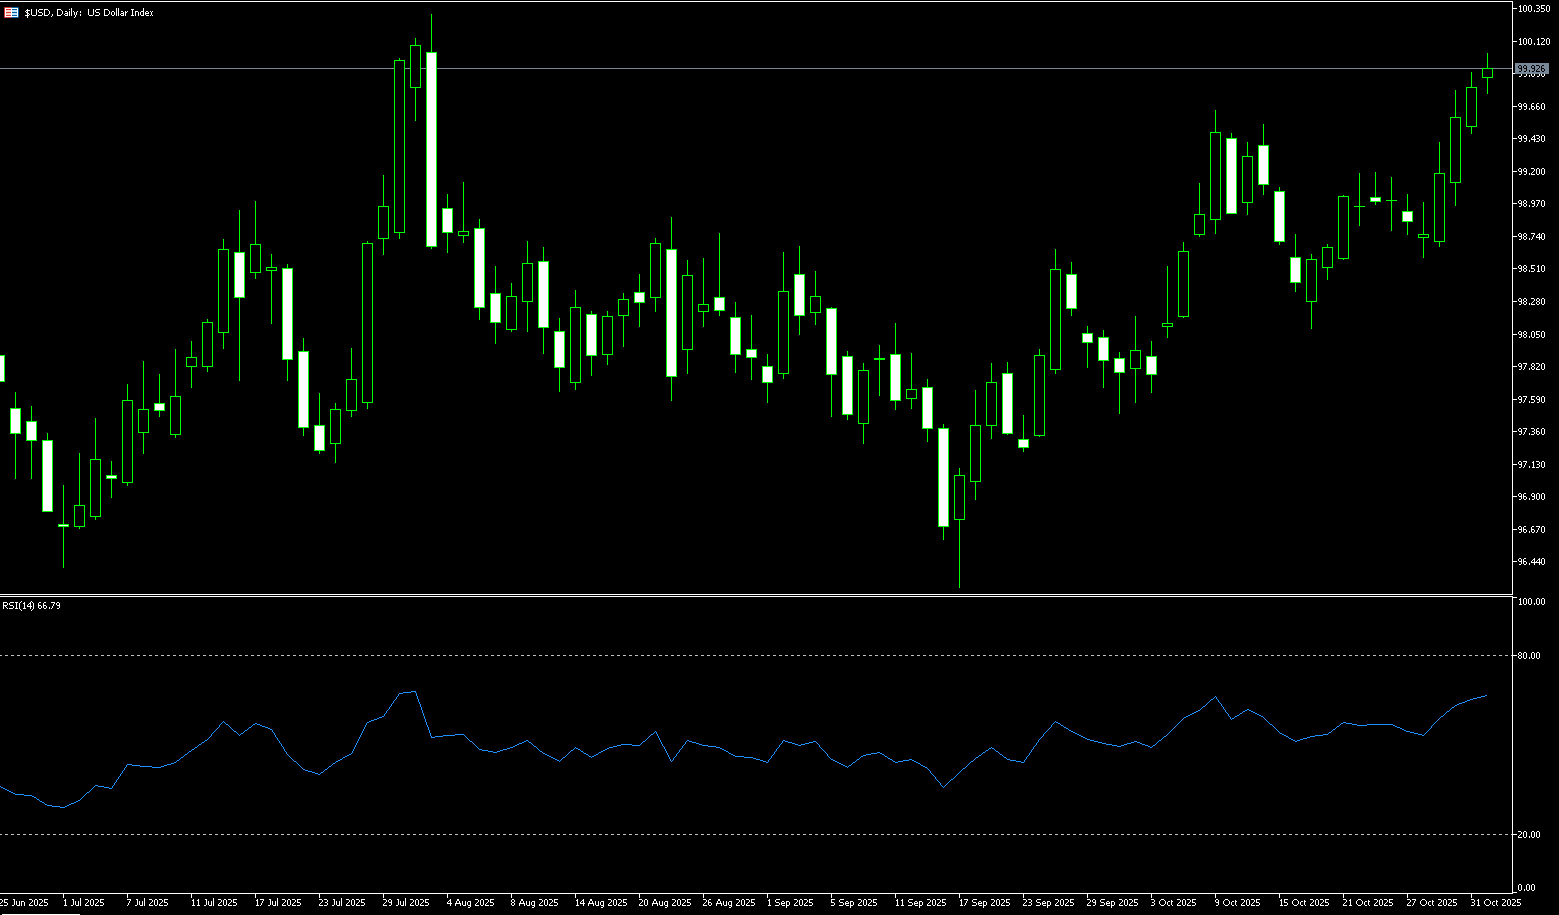
The US dollar index continued its upward trend from the previous three trading days on Monday, reaching a near four-month high of 99.84 in the previous session. Powell's hawkish stance on a December rate cut provided solid support for the dollar. Currently, the dollar index continues its upward trend, marking its best monthly performance since July. Market expectations for a December rate cut by the Federal Reserve have cooled significantly. The dollar faces technical resistance, but given that market positioning is nearing its limit, further shorting of the dollar is difficult. On the other hand, US Treasury Secretary Bessant stated last Sunday that due to high interest rates, some sectors of the US economy (especially housing) may have already entered a recession, and he reiterated his call for the Federal Reserve to accelerate the pace of rate cuts. However, the Fed's independence is the cornerstone of its credibility. If the market believes that the Fed will withstand political pressure and adhere to its data-driven decisions (especially if subsequent economic data remains strong), then expectations for rate cuts will be weakened, thus providing support for the dollar. Currently, the Fed's cautious attitude is the key force preventing a sharp decline in the dollar.
Hawkish comments from the Federal Reserve, strong Treasury yields, and interest rate differentials with other major economies continue to support a stronger dollar. A sustained break above the psychological level of 100.00 could attract further buying momentum. The dollar index is currently trading around 99.75, continuing its rebound after breaking above the key downtrend line at 99.35 on the daily chart. This breakout confirms a short-term bullish tone, while the 14-day Relative Strength Index (RSI) is above 65, indicating a slightly bullish but not overheated position. Upside resistance remains at the psychological level of 100.00 and the area around 100.26 (the August 1st high). A break above these levels would further test the 200-day simple moving average at 100.42. On the downside, the first support level is the descending trendline at 99.35, followed by 99.00 (the psychological level) and the 98.71 area (the 61.8% Fibonacci retracement level of the 100.26 to 96.22 range).
Consider shorting the US Dollar Index at 99.99 today, with a stop loss at 100.10 and targets at 99.50 and 99.40.
WTI Crude Oil
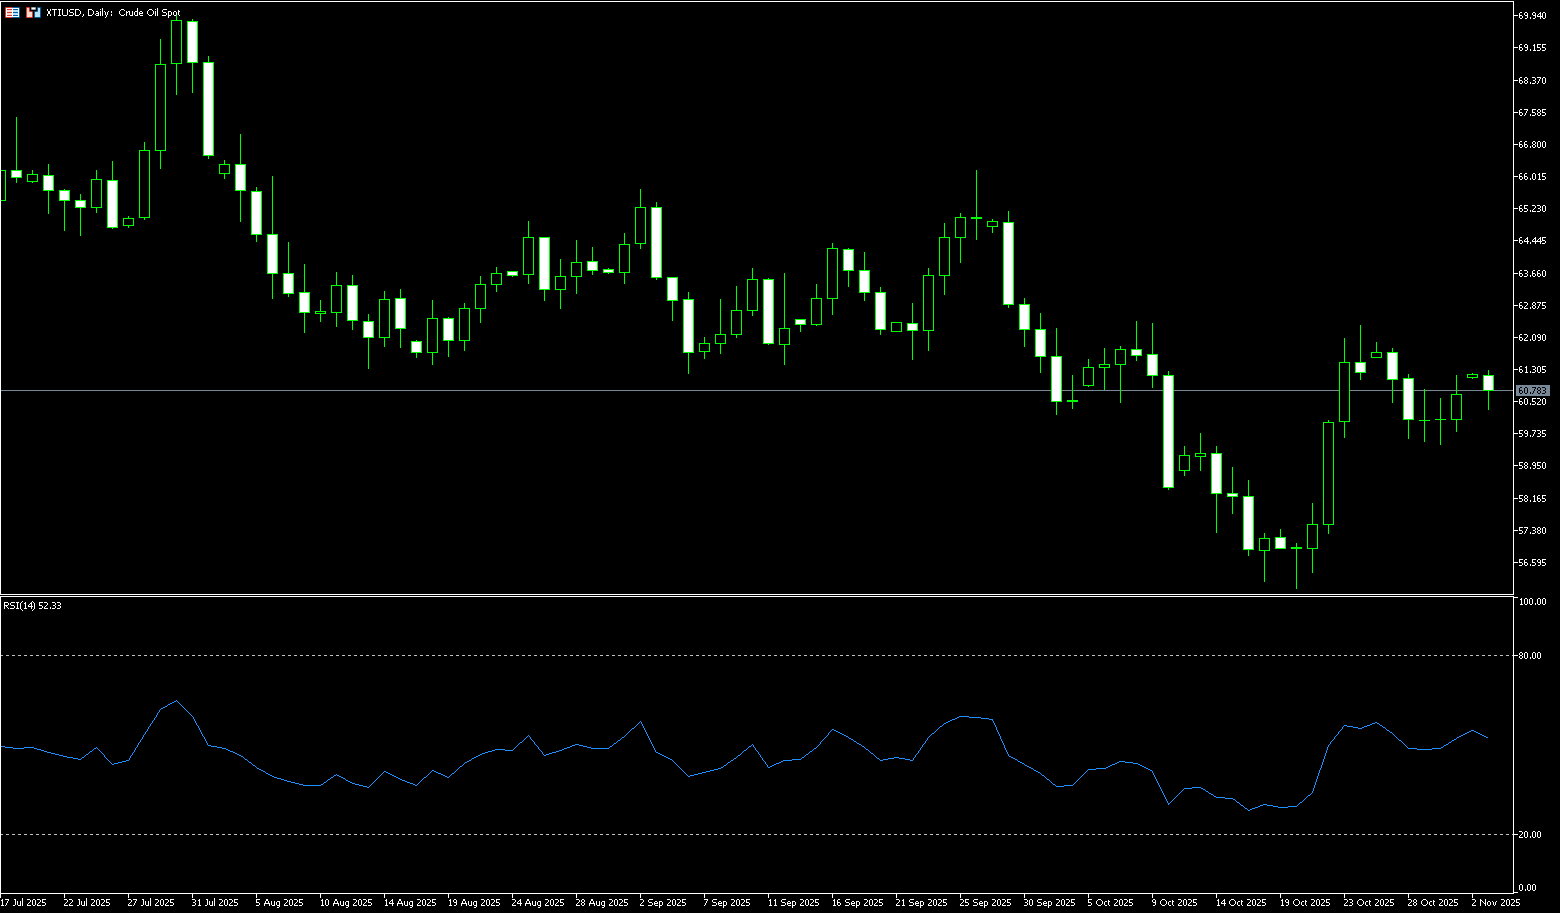
WTI crude oil traded slightly below $61.00 per barrel on Monday, supported by increased uncertainty surrounding the situation in Venezuela. Although all OPEC+ delegations agreed to increase production by 137,000 barrels per day in December, the increase will be suspended in the first quarter of next year, falling short of market expectations. Such geopolitical rumors have a significant impact on the market, adding uncertainty to Monday's oil price movements. Meanwhile, a stronger dollar makes dollar-denominated oil more expensive for buyers of other currencies. From a monthly perspective, due to continued OPEC+ production increases and record-high US crude oil production last week, the market is particularly focused on the potential impact of the Venezuelan situation on the oil market. This has exacerbated geopolitical risks. Even if the loss in Venezuelan heavy crude oil supply is not large, the impact will still be significant if the market perceives a complete disruption in exports. Besides geopolitical risks, several fundamental factors are jointly influencing the oil market. The US dollar is near a three-month high against major currencies, making dollar-denominated oil more expensive for holders of other currencies, thus suppressing demand.
Despite weaker crude oil prices this year and global supply growth consistently outpacing demand growth, setting the stage for oversupply in the coming months, US crude oil prices rebounded rapidly from a low of $55.97 in late last month, driven by events, and have since firmly held onto key support levels of the 10-day ($60.32) and 20-day ($59.64) simple moving averages, demonstrating the resilience of oil prices. The 10-day and 20-day moving averages formed a bullish "golden cross" pattern before the weekend. If crude oil can maintain its current price level of $61 and provide support, the price is expected to break through the $62.00 psychological level and the $62.01 area (65-day simple moving average), and trade in the upper range. If the upward momentum continues, the next target will be the $63.78 level (100-day simple moving average).
Consider going long on crude oil today at $60.68. Stop loss: $60.50, Target: $62.50, $62.80
Spot Gold
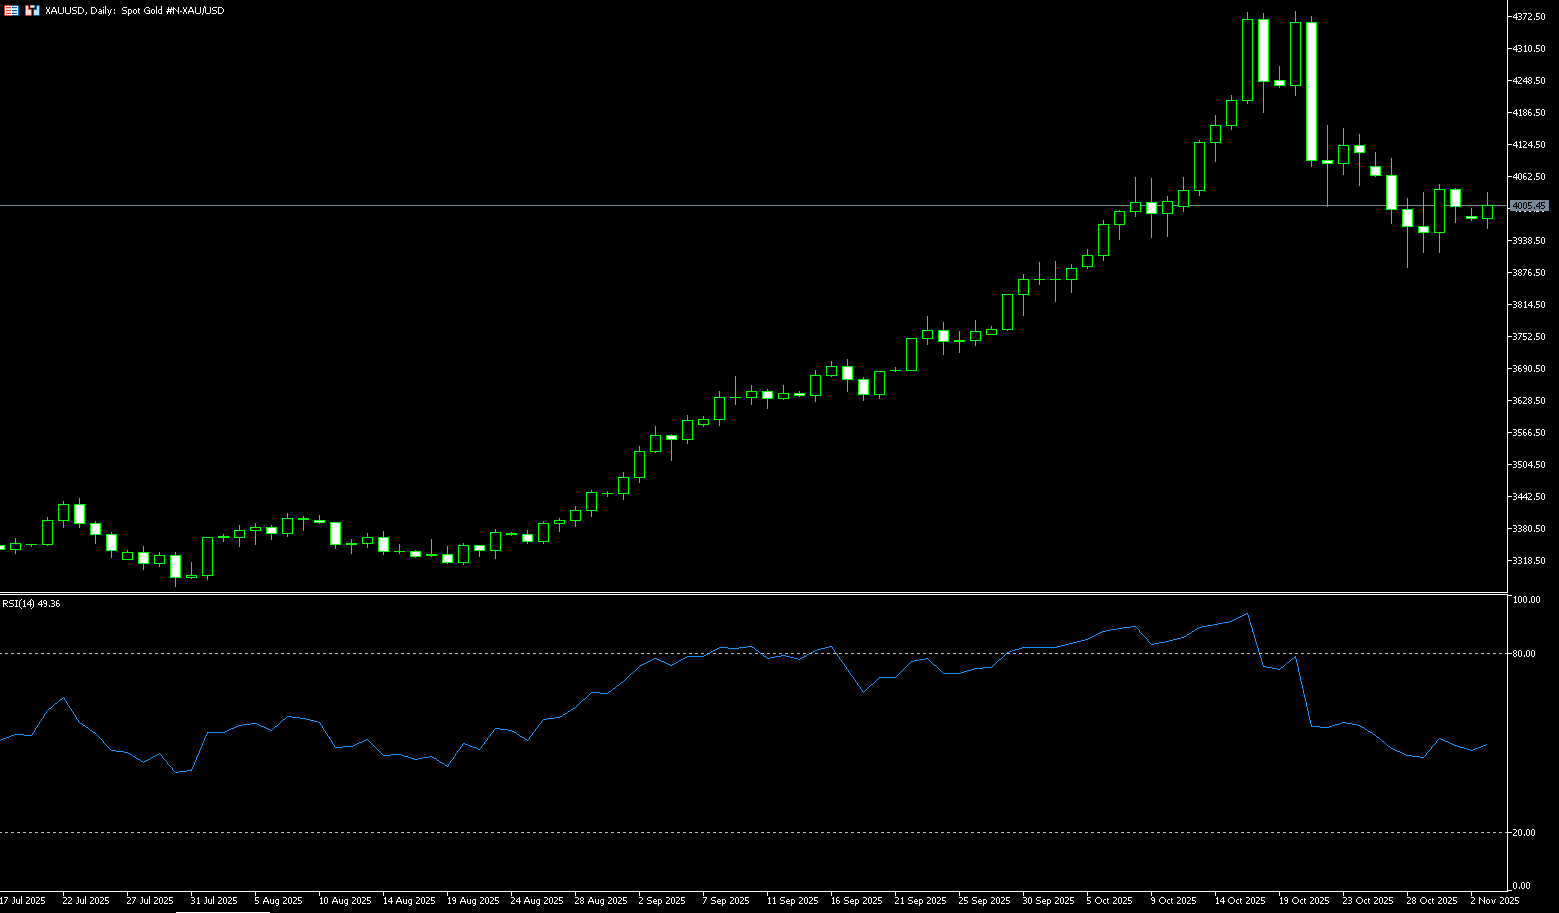
On Monday morning, spot gold traded around $4,000 per ounce, having earlier fallen to $3,962.50. Hawkish comments from Federal Reserve officials last week pressured the market, while easing trade tensions weighed on gold prices. Gold prices continued their correction last week, hitting a low of $3,886 on Tuesday, a two-week low. However, gold prices rebounded sharply last Thursday, and although they retreated slightly on Friday, they still rose 3.7% in October, marking their third consecutive monthly gain. Hawkish comments from several Federal Reserve officials on Friday reduced the probability of a December rate cut, and the dollar index hit a near three-month high, putting pressure on gold prices. However, market sentiment remained cautious, as the US government was nearing its longest shutdown in history and international geopolitical tensions continued to provide support for gold prices. Meanwhile, the yield on the 10-year US Treasury note rose 1.87% last week to 4.079%, the largest weekly increase since April; the two-year yield also saw a significant weekly increase. The yield curve inversion narrowed to 48.7 basis points, indicating a recovery in market confidence in a soft landing for the economy. Gold's attractiveness as a typical non-interest-bearing asset has significantly decreased in this environment.
Analyzing the daily chart, gold prices have steadily climbed from $3,947 at the beginning of October, repeatedly testing support levels before continuing their upward trend, indicating a bullish dominance. However, after reaching a historical high of $4,381.60, the price encountered resistance and fell back, subsequently consolidating and falling to a low of $3,886. Gold prices then rebounded again and are currently trading sideways around $4,000. This pattern of repeatedly testing resistance levels but failing to effectively break through the psychological level of $4,000 reveals a weakening of bullish momentum. If gold prices cannot break through the $4,028 (Monday's high) - $4,046 (nearly two-week high) level in the short term, there is a possibility of a downward retracement to test the $3,917 (40-day simple moving average) and the $3,900 support area. As market expectations for a December rate cut continue to cool, gold prices may fall towards the $3,800 psychological level in the short term, or even lower to the $3,752-$3,700 support area of the 60-day simple moving average. On the other hand, once gold breaks through the 25-day simple moving average of $4,047 and the near two-week high of $4,046, the next resistance level will be the $4,100 mark.
Consider going long on gold today at $3,995, with a stop loss at $3,990 and targets at $4,030 and $4,040.
AUD/USD
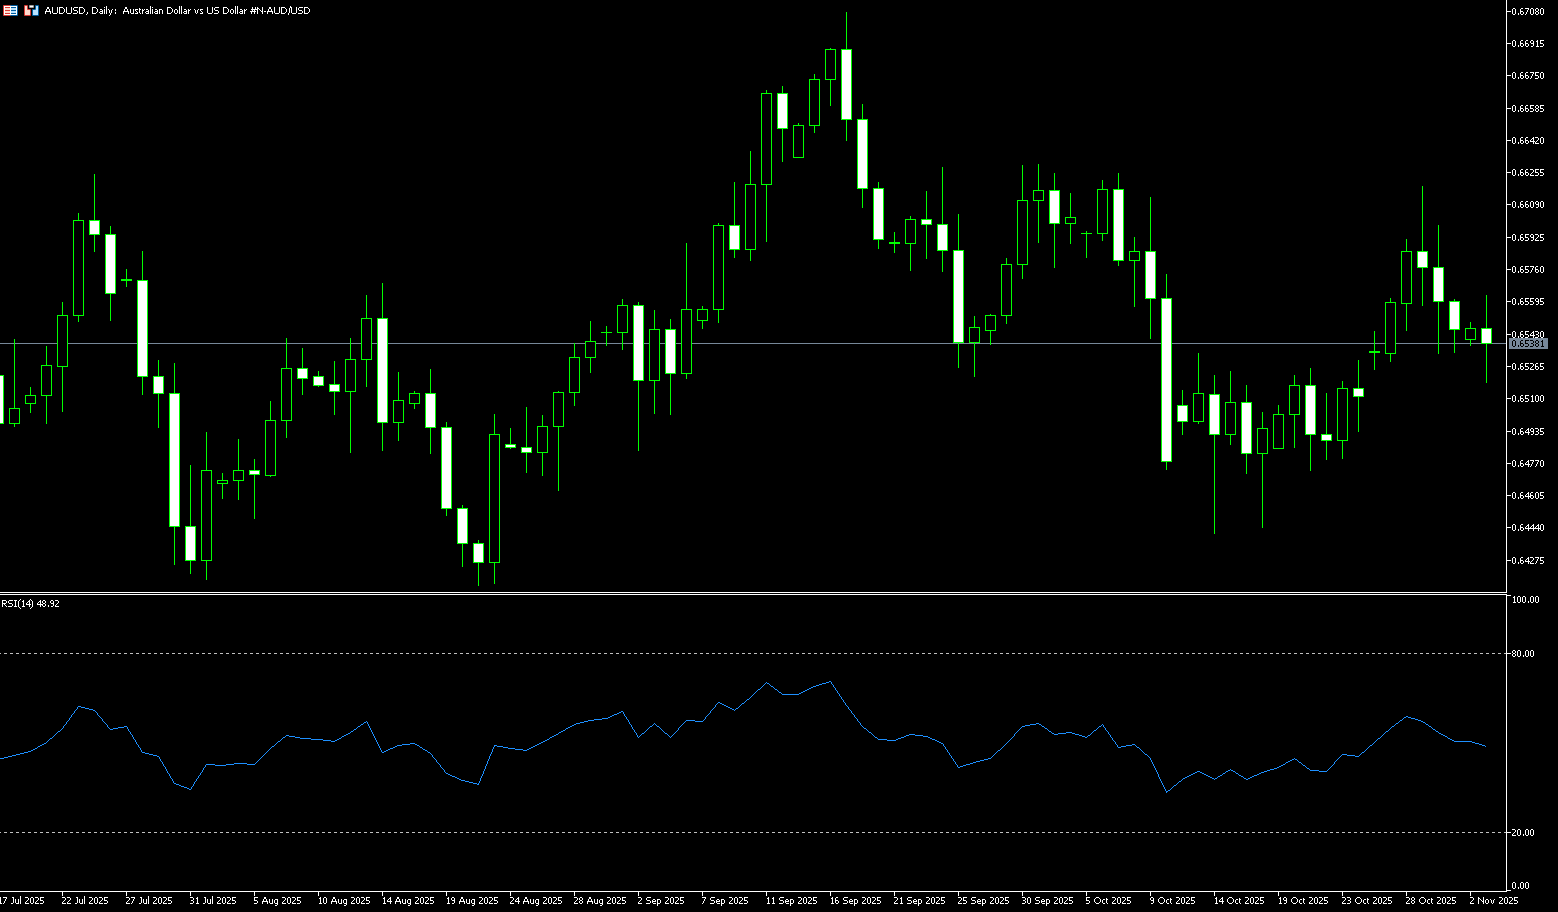
The Australian dollar rose to around $0.6540 on Monday, then dipped slightly. The AUD/USD pair may continue to lose ground as the US dollar strengthens and market expectations for a December rate cut by the Federal Reserve have diminished. Investors are awaiting the Reserve Bank of Australia's upcoming monetary policy decision. The central bank is expected to keep rates unchanged after three rate cuts earlier this year, and stronger-than-expected inflation data has reduced expectations for further monetary easing. The annual headline inflation rate rose to 3.2% in the third quarter from 2.1% in the previous quarter, while the trimmed mean rose to 3% from 2.7%. Meanwhile, Australia's monthly inflation index, compiled by the Melbourne Institute, showed a 0.3% month-on-month increase in October 2025, slightly lower than September's 0.4% increase. Interest rate swap contracts indicated a less than 7% probability of a rate cut, and market expectations for further rate cuts in December and February have also weakened.
The Australian dollar/US dollar pair traded around 0.6540 on Monday. Technical analysis on the daily chart suggests the pair is consolidating within the 0.6500-0.6600 range. However, the 14-day Relative Strength Index (RSI) has slightly declined to near the 50 positive zone, suggesting further upside potential. Currently, the pair is slightly above the 14-day simple moving average at 0.6526, indicating strong short-term price momentum. Initial resistance is at 0.6597 (October 30 high), the psychological level of 0.6600, followed by the October 1 high of 0.6630. A further breakout would signal a bullish trend and support the pair exploring the area near the 13-month high of 0.6707 reached on September 17th. On the downside, key support lies at the psychological level of 0.6500, which is still supported by the key 200-day simple moving average at 0.6442 and the October low of 0.6440 (October 14th).
Consider going long on the Australian dollar today at 0.6522, with a stop-loss at 0.6510 and a target of 0.6570. 0.6580
GBP/USD
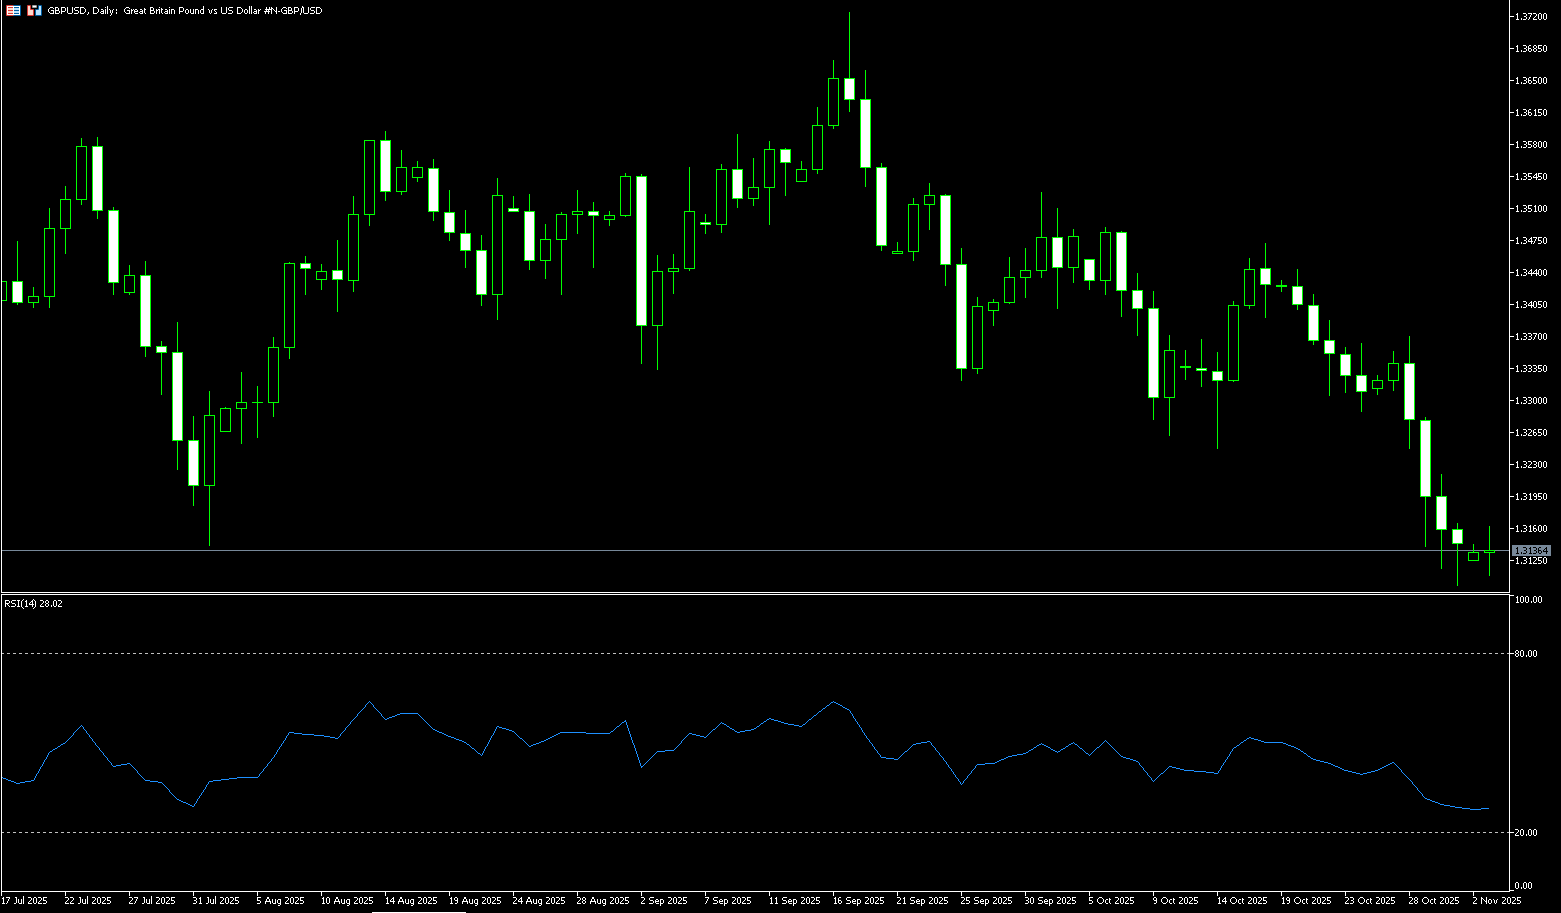
GBP/USD remained subdued at the start of the new week, trading near a low of around 1.3117, close to the lowest level reached on April 14. Meanwhile, the fundamental backdrop appears to favor bearish traders, supporting a continuation of the clear downtrend seen over the past month and a half. The dollar's resilience near three-month highs following hawkish comments from Federal Reserve Chairman Powell last week is seen as a key factor continuing to pressure GBP/USD. Indeed, this has helped offset concerns about economic risks stemming from the prolonged US government shutdown and continues to support the dollar. On the other hand, the pound continues to be relatively weak ahead of Chancellor Rachel Reeves' autumn budget announcement on November 26, due to growing concerns about the UK's fiscal situation. Furthermore, market bets on further interest rate cuts by the Bank of England validate the negative outlook for GBP/USD. However, the market awaits the Bank of England's decision on Thursday before positioning itself for the next directional move. A policy update would be a wise move.
From a technical perspective, the GBP/USD pair's close below the 200-day simple moving average at 1.3251 last week is considered a key trigger for bears. Furthermore, the 14-day RSI on the daily chart is deeply mired in oversold territory (29.00), confirming the negative short-term outlook. Therefore, a subsequent pullback to the 1.3100 psychological level seems a clear possibility. A convincing breakout of this area would signal a new downside to 1.3063 (the April 14 low) and pave the way for a deeper move towards the psychological level of 1.3000. On the other hand, any attempt to rise above the 200-day simple moving average at 1.3251 is more likely to attract new selling pressure and be capped near the 1.3300 level. A sustained break above this area could trigger a short-term rebound and push the GBP/USD pair towards the 1.3350-1.3360 area.
Consider going long on GBP at 1.3126 today. Stop Loss: 1.3112, Target: 1.3190, 1.3180
USD/JPY
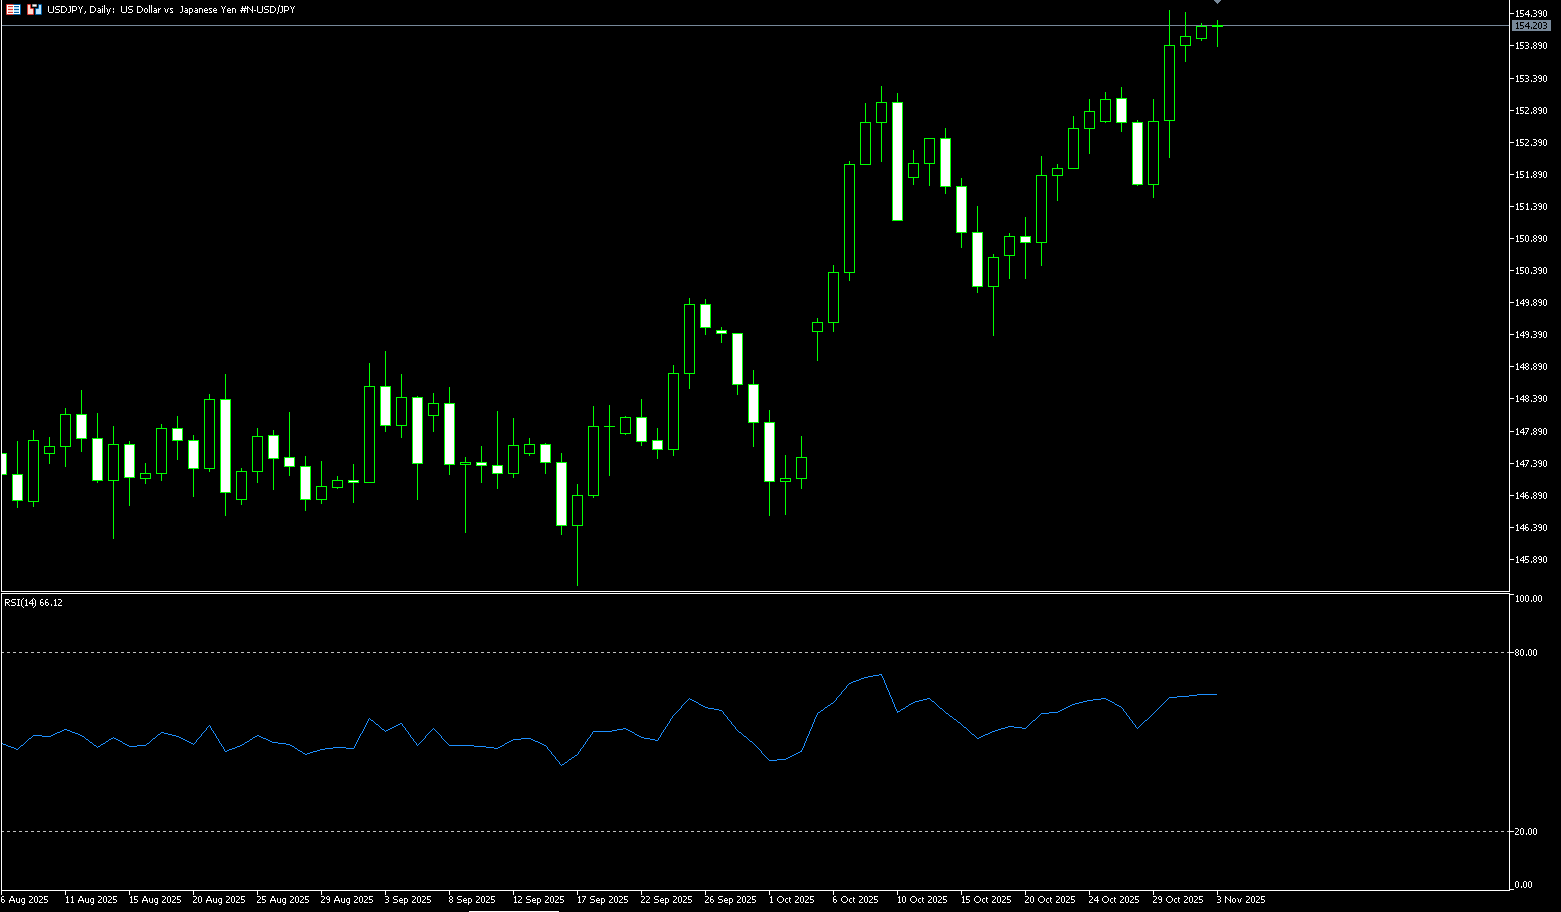
The yen held steady near its lowest level in nine months, hovering around 154 yen per dollar in Monday's holiday trading, as the Bank of Japan remained cautious about raising interest rates amid a more hawkish stance from the Federal Reserve. Last week, the Bank of Japan kept interest rates unchanged, with Governor Kazuo Ueda warning that global trade policies could dampen growth and corporate profits. While Ueda did not rule out a December rate hike, his cautious stance disappointed the market. Meanwhile, newly appointed Finance Minister Rikizumi Katayama clarified that she no longer supports her March view that the yen's fair value was around 120-130 yen per dollar, noting that she is now in charge of monetary policy. Investors are now anticipating key data releases this week, including wage and household spending figures.
From a technical perspective Last week's break above the psychological resistance level of 153.00, and the subsequent strength above 154.00, are considered key triggers for the USD/JPY bulls. Furthermore, the 14-day Relative Strength Index (RSI) on the daily chart is at a high of 66.00, still far from overbought territory. This, in turn, supports the possibility of a move towards the resistance level of 154.80 (February 12 high), which in turn targets the psychological level of 155.00 and the 155.88 (February 3 high). On the other hand, any corrective pullback below 154.00 could see a move towards 153.04 (the 5-day simple moving average) and the psychological level of 153.00. A decisive break above this level could expose the 9-day simple moving average low, around the 152.30 area.
Today, consider shorting the USD at 154.40. Stop Loss: 154.60, Target: 153.50 153.30
EUR/USD
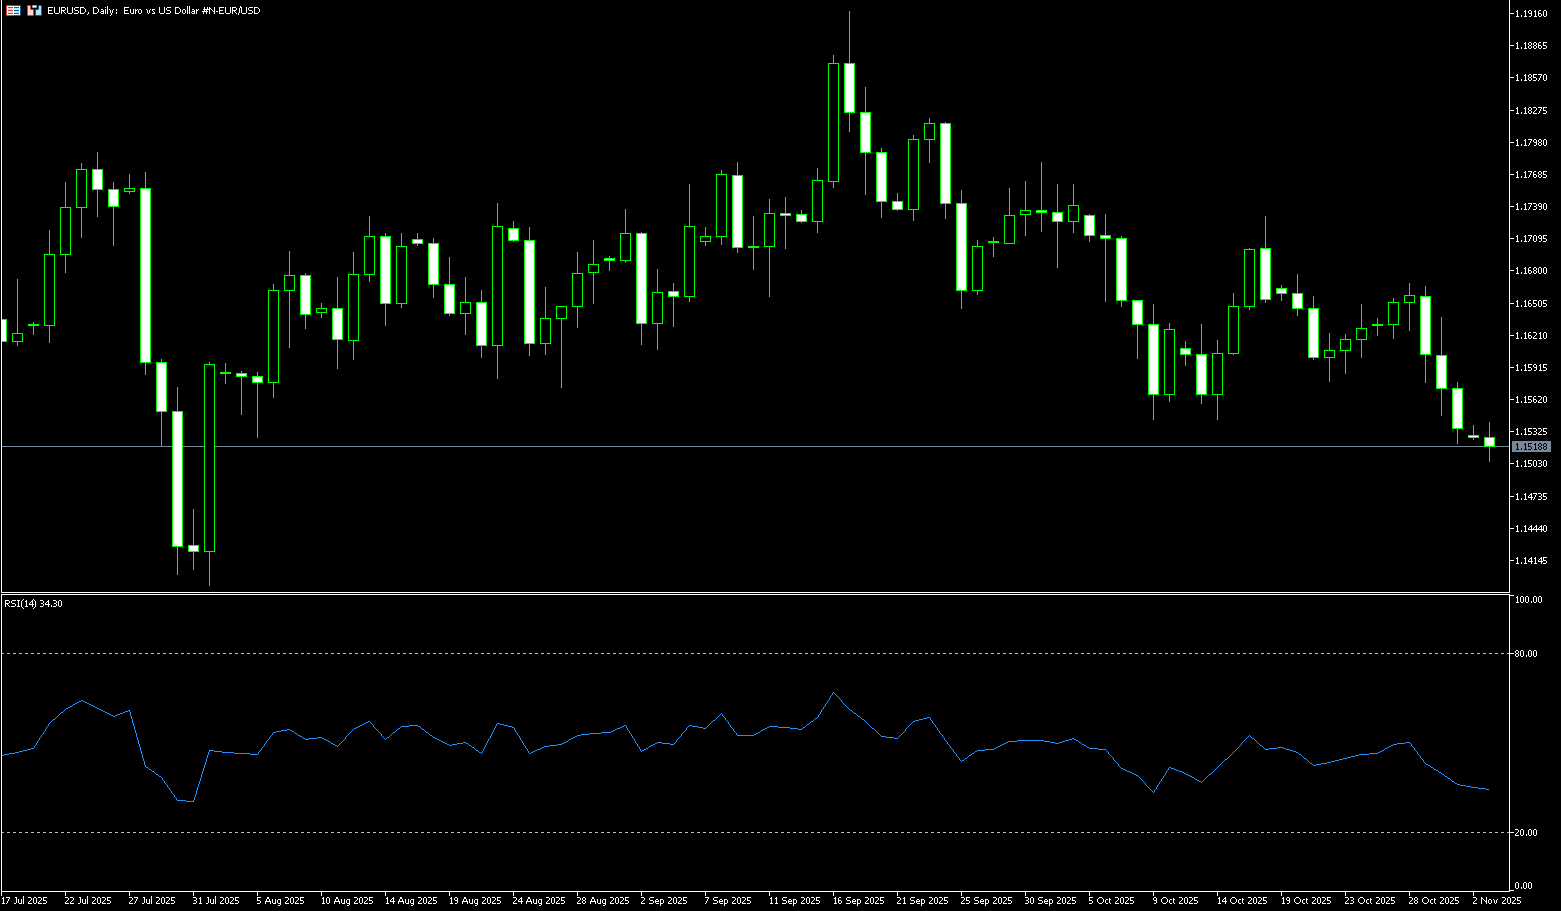
The euro/dollar pair edged lower, marking its fourth consecutive day of declines. It traded around 1.1510 in Asian trading on Monday, its lowest level since the end of July. The dollar was supported by the Federal Reserve's decision to cut its benchmark overnight lending rate for the second time this year to a range of 3.75%-4.0%, and market expectations for a December rate cut weakened, keeping the pair subdued. European Central Bank policymaker de Gallo stated that the central bank's monetary stance is in a good position, but adjustments could be made if risks escalate. His comments came after the ECB decided to keep interest rates unchanged for the third consecutive time. President Lagarde noted that policy was "in a good position" and suggested limited need for further easing after eight quarterly rate cuts of 0.25% prior to June. Meanwhile, the dollar strengthened as traders reduced their bets on further Fed rate cuts.
The daily chart shows... The EUR/USD pair is currently consolidating above 1.1500 (its lowest level since the end of July). In the short term, the technical tone for the euro is currently bearish, but it found stable support in the area where it tested the 1.1504 (160-day simple moving average) and 1.1500 (psychological level) lows in October. A clear break below 1.1475 (the low of June 17th) may be needed to signal further downside risk for the euro in the short term, with a potential target of 1.1450 (the low of June 23rd). And the 1.1400 (psychological level) area. A break above this level would target 1.1320 (200-day simple moving average). Comparatively, 1.16600 (a psychological level) is a key resistance for any rebound, followed by 1.1613 (20-day simple moving average). From there, the next target is 1.1668 (October 28 high).
Today, consider going long on the Euro at 1.1510, with a stop-loss at 1.1500 and targets at 1.1565 and 1.1570.
Disclaimer: The information contained herein (1) is proprietary to BCR and/or its content providers; (2) may not be copied or distributed; (3) is not warranted to be accurate, complete or timely; and, (4) does not constitute advice or a recommendation by BCR or its content providers in respect of the investment in financial instruments. Neither BCR or its content providers are responsible for any damages or losses arising from any use of this information. Past performance is no guarantee of future results.
更多报道


风险披露:衍生品在场外交易,采用保证金交易,意味着具有高风险水平,有可能会损失所有投资。这些产品并不适合所有投资者。在进行交易之前,请确保您充分了解风险,并仔细考虑您的财务状况和交易经验。如有必要,请在与BCR开设账户之前咨询独立的财务顾问。
BCR Co Pty Ltd(公司编号1975046)是一家根据英属维尔京群岛法律注册成立的公司,注册地址为英属维尔京群岛托尔托拉岛罗德镇Wickham’s Cay 1的Trident Chambers,并受英属维尔京群岛金融服务委员会监管,牌照号为SIBA/L/19/1122。
Open Bridge Limited(公司编号16701394)是一家根据2006年《公司法》注册成立并在英格兰和威尔士注册的公司,注册地址为 Kemp House, 160 City Road, London, City Road, London, England, EC1V 2NX.本公司仅作为支付处理方运作,不提供任何交易或投资服务。

 English
 简体中文
简体中文
 繁體中文
繁體中文
 Bahasa
Melayu
Bahasa
Melayu
 Tiếng
Việt
Tiếng
Việt
 ไทย
ไทย
 日本語
日本語
 한국어
한국어
 ភាសាខ្មែរ
 español