


0
US Dollar Index
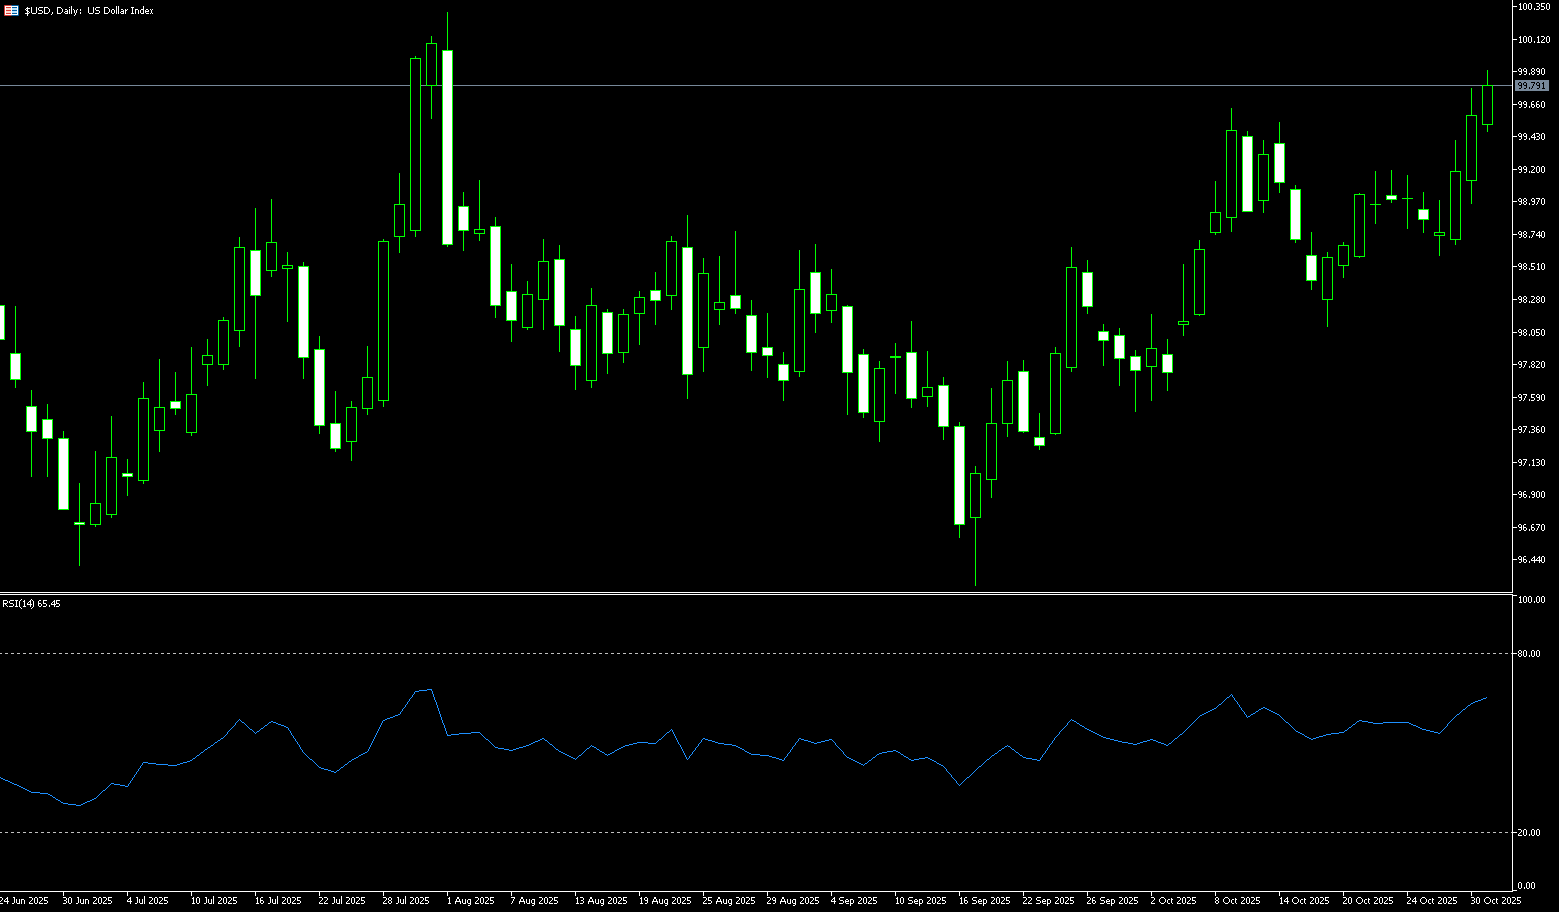
Last week, the US dollar index and US Treasury bonds launched a surprise attack, causing non-dollar currencies to fall rapidly against the dollar. This was likely due to the Federal Reserve's warning of the end of QT (Quick Transmission), leading to a rapid sell-off of US Treasuries. Safe-haven funds sought the dollar as an alternative, causing the dollar index to surge and putting pressure on non-dollar currencies. Mid-week, Federal Reserve Chairman Powell adopted a more cautious stance on future interest rate cuts. Although the Fed cut rates by 25 basis points as expected, adjusting the target range for the federal funds rate to 3.75%-4.00%, Powell's post-meeting comments dampened dovish expectations. The dollar thus received a boost. From a longer-term structural perspective, whether the dollar's strong cycle has peaked depends on whether three chains can simultaneously shift: First, whether the real interest rate differential can continue to decline and be "confirmed" by the market; second, whether the term premium of the US nominal-real yield curve can significantly decline with marginal improvements in liquidity; and third, whether the policies and growth trajectories of major counterpart currencies—the European Central Bank, the Bank of England, and the Bank of Japan—can provide stable valuation anchors. Currently, the first chain of factors has not yet been met (increased uncertainty regarding interest rate cuts), the second chain is halfway through a phase of "gradual but improving liquidity," and the third chain is still in the midst of a data-policy interplay. Therefore, the US dollar index appears to be in a range-bound phase, characterized by "difficulty in rising and limited decline."
The daily chart shows that after forming a low near the psychological levels of 98.03 (the low on October 17th) and 98.00, the US dollar index quickly rose to 99.72 (the high on October 30th), before retracing and consolidating around 99.50, exhibiting a "V-shaped rebound + high-level consolidation" structure. The MACD indicator is above the zero line, indicating that upward momentum is weakening but the trend remains intact. Meanwhile, the 14-day Relative Strength Index (RSI) is above 60, in the neutral-to-strong zone, indicating no overheating. In terms of price levels, upward resistance remains at 99.72 (October 30 high) and the 99.86 (185-day simple moving average) area. A break above these levels would lead to a further test of 100.00 (a psychological level) and a potential challenge of the 200-day simple moving average at 100.46. On the downside, 98.94 represents the neckline support of the previous high, followed by 98.71 (the 61.8% Fibonacci retracement level of the 100.26-96.22 range), and then 98.37 (the 34-day simple moving average). A break below this level would lead to a further pullback to lower support levels at 98.03 (the October 17 low) and the 98.00 (psychological level) area.
Today, consider shorting the US Dollar Index at 99.85, with a stop-loss at 99.95 and targets at 99.35 and 99.30.
WTI Crude Oil
WTI crude oil fell to near $59.70 per barrel last week, marking its third consecutive monthly decline, pressured by rising global production ahead of the OPEC+ meeting. Cartels are inclined to increase production by 137,000 barrels per day in December as part of a strategy to regain market share. This further exacerbates an already oversupplied market, with Saudi Arabian crude exports reaching a six-month high of 6.41 million barrels per day in August and poised to increase further, while the U.S. Energy Information Administration reported that U.S. crude production hit a record 13.6 million barrels per day last week. These developments could help offset the impact of recent U.S. sanctions on major Russian oil producers, which investors are watching to see how these measures will affect exports to major buyers. Meanwhile, President Trump stated that China has agreed to resume purchasing U.S. energy, including a potential large oil and gas deal from Alaska. Elsewhere, a stronger dollar has put pressure on commodities. Currently, selling pressure has intensified significantly ahead of the OPEC+ meeting this weekend due to market concerns that the latter may announce a production increase, potentially putting further downward pressure on oil prices in the short term. As long as concerns about oversupply persist, bearish sentiment is expected to continue dominating the market in the coming trading days.
WTI crude oil has recently been steadily declining along a well-defined downtrend line on the daily chart. From a broader perspective, the bearish bias remains dominant, and as long as oil prices remain below the 50-day simple moving average at $62.08 and $62.38 (the October high), the downtrend is expected to continue in the coming weeks. Furthermore, the 14-day Relative Strength Index (RSI) continues to hover below the 50 neutral level, suggesting that a short-term bearish bias may prevail. The MACD indicator remains below the zero line, reflecting a bearish short-term outlook for oil prices. On the downside, the first major support is in the $59.48 area (last week's low) and the $59.22 area (14-day simple moving average). The next support level is at $58.00; a daily close below this level could trigger a larger decline, with bears potentially targeting $57.31 (October 22 low). On the upside, immediate resistance is near $61.01 (34-day simple moving average). The first key resistance zone for bulls is at $62.08 (50-day simple moving average) and $62.38 (October high). If the closing price breaks through the aforementioned area, oil prices may move towards $63.26 (89-day simple moving average).
Consider going long on crude oil today at $60.50. Stop loss: $60.35, Target: $62.50, $62.80

Spot Gold
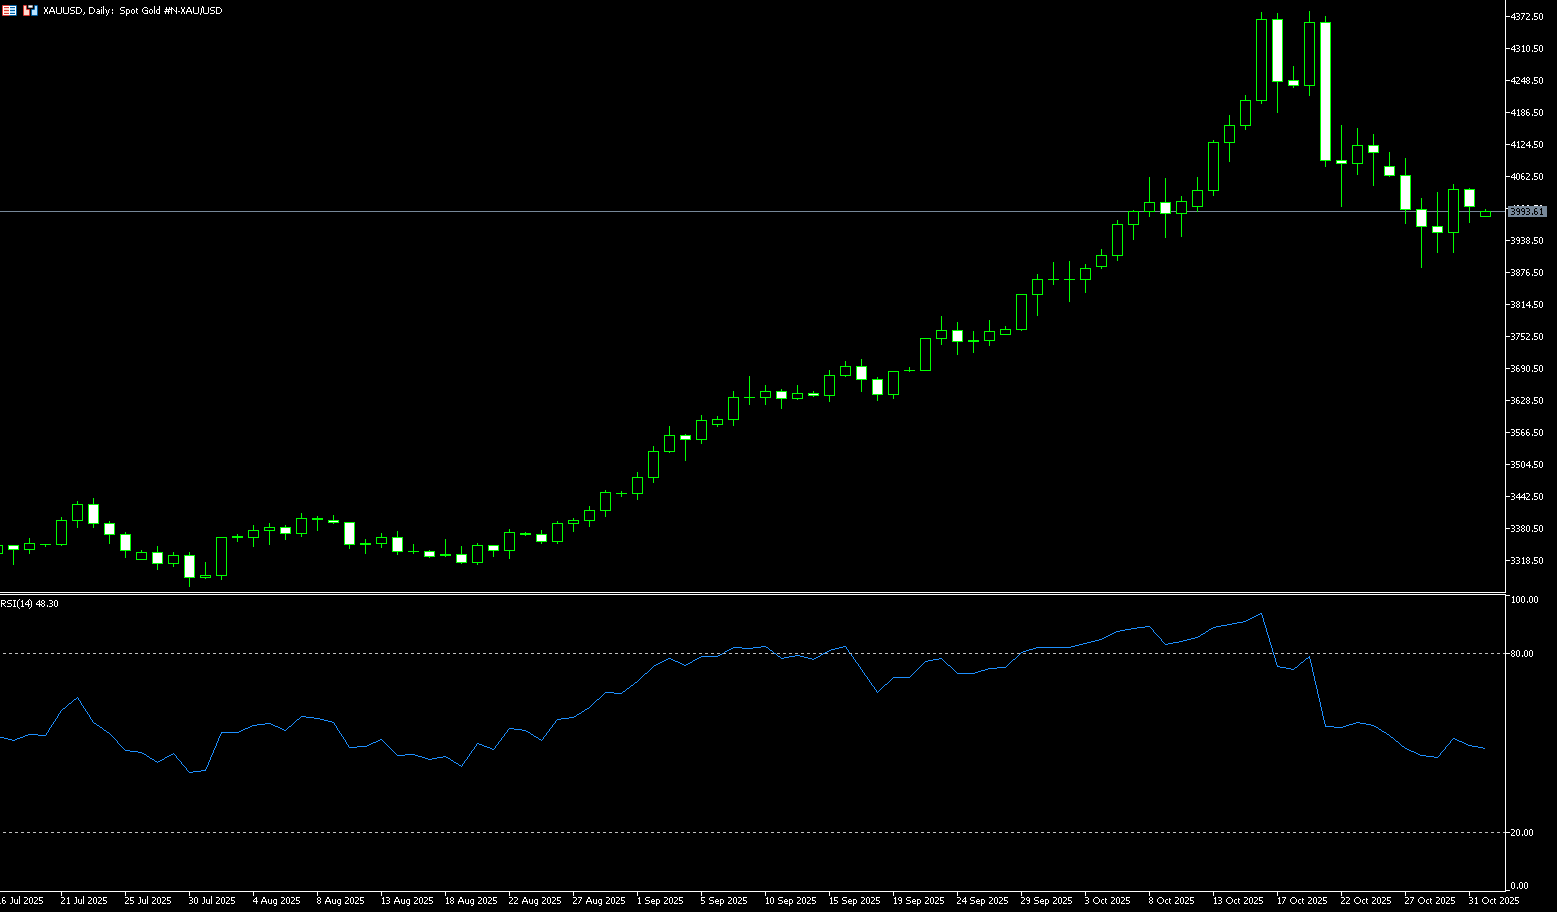
On Thursday, spot gold climbed back above $4,000/ounce. On Wednesday, spot gold experienced a dramatic rollercoaster ride. During the Asian and European sessions, driven by safe-haven demand and expectations of a Fed rate cut, gold prices surged nearly 2%, successfully breaking through the $4,000 mark. However, this rally was short-lived. The Fed cut rates by 25 basis points as expected, but Fed Chairman Powell's hawkish remarks at the press conference dampened bullish sentiment, and gold prices quickly gave back all gains and turned lower, hitting a low of $3,908/ounce. This pullback brings gold's weekly decline to over 3%, partly due to escalating global trade tensions. Signs of easing are emerging, despite gold prices still rising 51% year-to-date and recently hitting a record high. Furthermore, gold's reaction to Powell's withdrawal of expectations for a December rate cut is reasonable; federal funds rate futures have significantly reduced their pricing of a rate cut, which will boost the dollar and depress gold.
The gold market is at a crossroads: Powell's hawkish shift, the strengthening of both the dollar and US Treasuries, and the complete overshadowing of the positive impact of the end of quantitative tightening. If the US-China-South Korea summit fails to bring substantial positive news, and market expectations for a December rate cut continue to cool, gold prices may fall towards the $3,800 mark in the short term. Gold faces support at $3,763 and even lower, potentially at the 55-day simple moving average. The technical chart for gold shows the uptrend remains intact, but buyers must close above $4,000 to continue their hopes of testing the 20-day simple moving average at $4,077. Once gold breaks above the 20-day simple moving average, the next resistance level will be $4,100. Conversely, if the daily close is below the psychological level of $3,900, gold will face lower prices, with sellers watching the October 28 low of $3,886, followed by the 55-day simple moving average level near $3,763.
Consider going long on gold today at $3,996, with a stop loss at $3,990 and targets at $4,050 and $4,040.
AUD/USD
The AUD/USD pair reached a near three-week high of 0.6617 last week... The Australian dollar remained subdued for the third consecutive trading day, trading around 0.6540. The pair saw little movement following the release of China's National Bureau of Statistics Purchasing Managers' Index (PMI) data. It's worth noting that any changes in the Chinese economic situation could also impact the Australian dollar, given the close trade relationship between China and Australia. China's National Bureau of Statistics manufacturing PMI fell sharply to 49.0 in October, from 49.8 in September. This figure was higher than the expected 49.6. Meanwhile, the non-manufacturing PMI unexpectedly rose slightly to 50.1, compared to the previous reading and market consensus of 50.0. President Trump announced a reduction in tariffs on Chinese goods from the current 57% to 47% and confirmed that the rare earth dispute had been resolved, lifting restrictions on rare earth exports to China. However, Trump acknowledged that not all issues were resolved in the talks. On the other hand, Australia's higher-than-expected third-quarter inflation and August CPI data reduced market expectations for a near-term interest rate cut by the Reserve Bank of Australia (RBA). RBA Governor Bullock noted that despite an unexpected rise in unemployment, the labor market remains relatively tight.
The AUD/USD pair traded around 0.6540 before the end of last week. Technical analysis on the daily chart suggests a neutral bias as the pair is fluctuating within a triangle pattern. The pair is above the 20-day simple moving average at 0.6531, indicating strong short-term price momentum. Momentum indicators continue to point to further gains, although momentum has slightly weakened. In fact, on the 14th... The Relative Strength Index (RSI) has dipped slightly to near the 50 positive zone, suggesting further upside potential. Furthermore, the Average Directional Index (ADX), nearing 18, suggests the current trend appears less convincing. The continued sharp rebound in the US dollar index complicates matters, putting pressure on the Australian dollar. Specifically, the 14-day and 134-day simple moving averages are providing temporary support at 0.6522 and 0.6515 respectively. A loss in this area could pave the way for a potential decline, targeting the 0.6500 (psychological level), a low still supported by the key 200-day simple moving average at 0.6442. Support lies at the October low of 0.6440 (October 14th). Then comes the August low of 0.6414 (August 21st), before the June benchmark of 0.6372 (June 23rd). On the upside, initial resistance is at the psychological level of 0.6600, followed by the 0.6640 level. A further break above the latter's upper trendline would create a bullish bias, supporting AUD/USD to explore the area near the 12-month high of 0.6707 reached on September 17th.
Consider going long AUD today at 0.6530, with a stop loss at 0.6520 and targets at 0.6585 and 0.6600.

GBP/USD
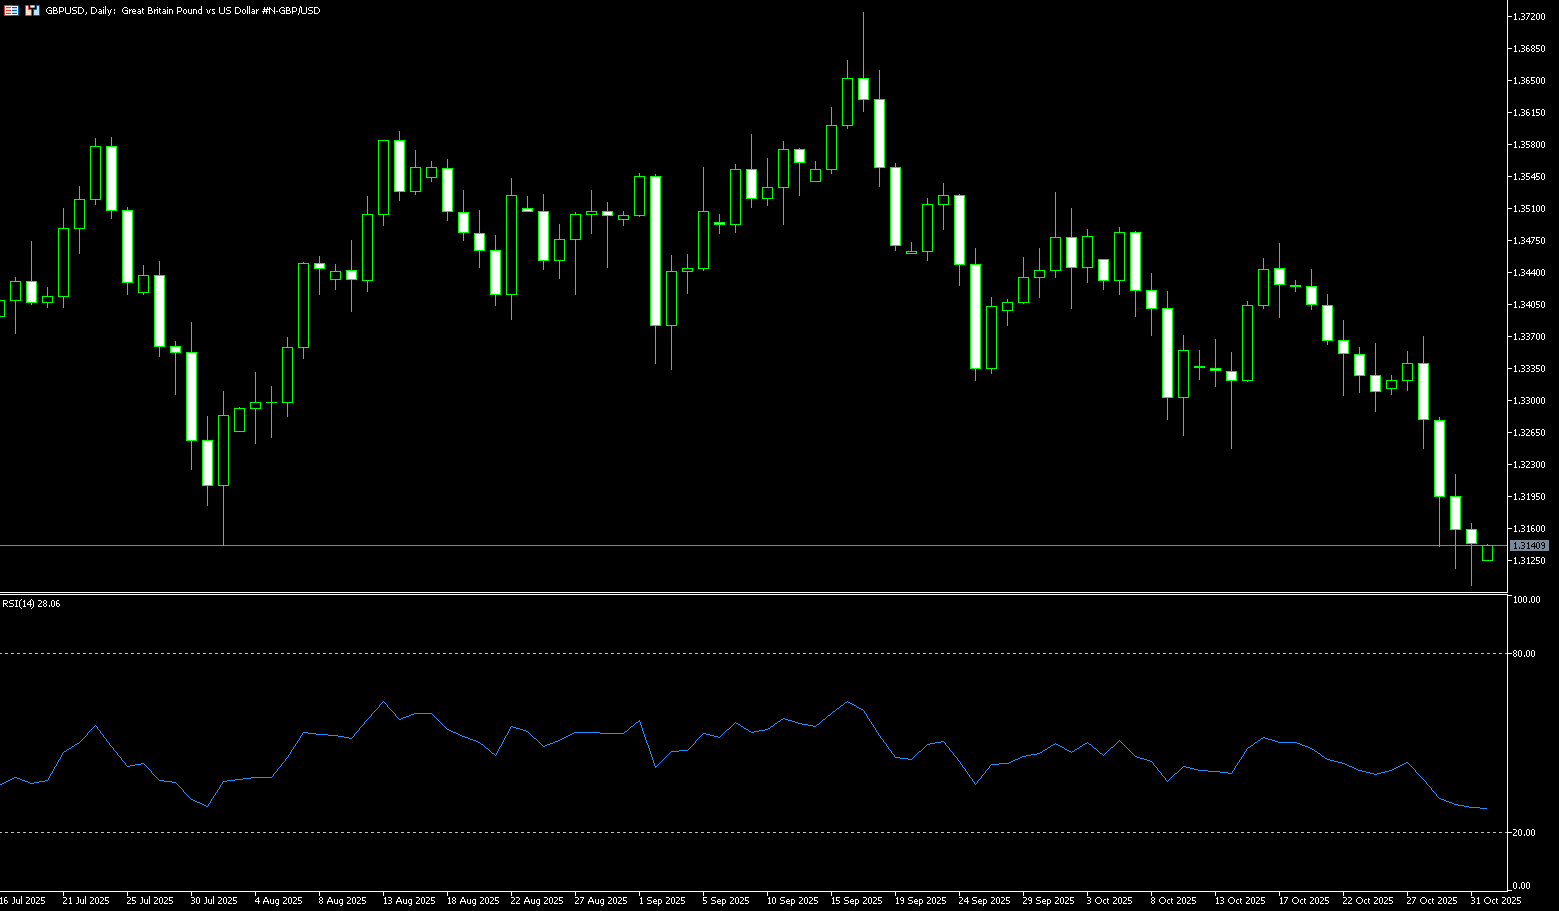
Last week, The pound extended its losses, falling below $1.32 to a near six-month low of 1.3097. The pound was pressured by a stronger dollar following the Federal Reserve's expected 25-basis-point rate cut, although Chairman Powell warned that further rate cuts were unlikely this year. Traders increased their bets on a Bank of England rate cut, anticipating a significant blow to economic growth from the November budget. During Wednesday's parliamentary questioning, Prime Minister Keir Starmer refused to rule out increases in income tax, National Insurance, or VAT. Meanwhile, reports indicated the Office for Budget Revenue and Budget planned to lower its UK productivity growth forecast by about 0.3 percentage points, a revision that could result in a £20 billion public finance deficit. Lower inflation data also reinforced expectations of monetary easing, with the Retail Confederation reporting further declines in food price inflation. Additionally, The pound also remained under pressure against major currencies last week. Its poor performance was attributed to investor concerns that Chancellor Rachel Reeves might face opposition in the upcoming November budget, exacerbated by increased fiscal risk.
From a technical perspective, the close below the 1.3300 level in late last week is considered a key trigger for bearish sentiment in GBP/USD. Furthermore, the oscillator on the daily chart is deeply in negative territory, confirming the negative short-term outlook. Therefore, a subsequent downward retest of the August monthly low, around 1.3140, and the 1.3100 (psychological level) area appears to be a clear possibility. If this area breaks out... A convincing breakout would signal a new downside breakdown and pave the way for deeper losses to 1.3063 (April 14 low) and the 1.3000 (psychological level). On the other hand, any attempt to rally above the 200-day simple moving average near 1.3248 is more likely to attract new selling pressure and be capped near 1.3300. A sustained break above this area could trigger a short-term corrective rally, pushing GBP/USD to last week's high of 1.3370, and then towards the next relevant resistance level at the psychological level of 1.3400.
Consider going long GBP today at 1.3140, stop loss: 1.3130, target: 1.3190. 1.3200
USD/JPY
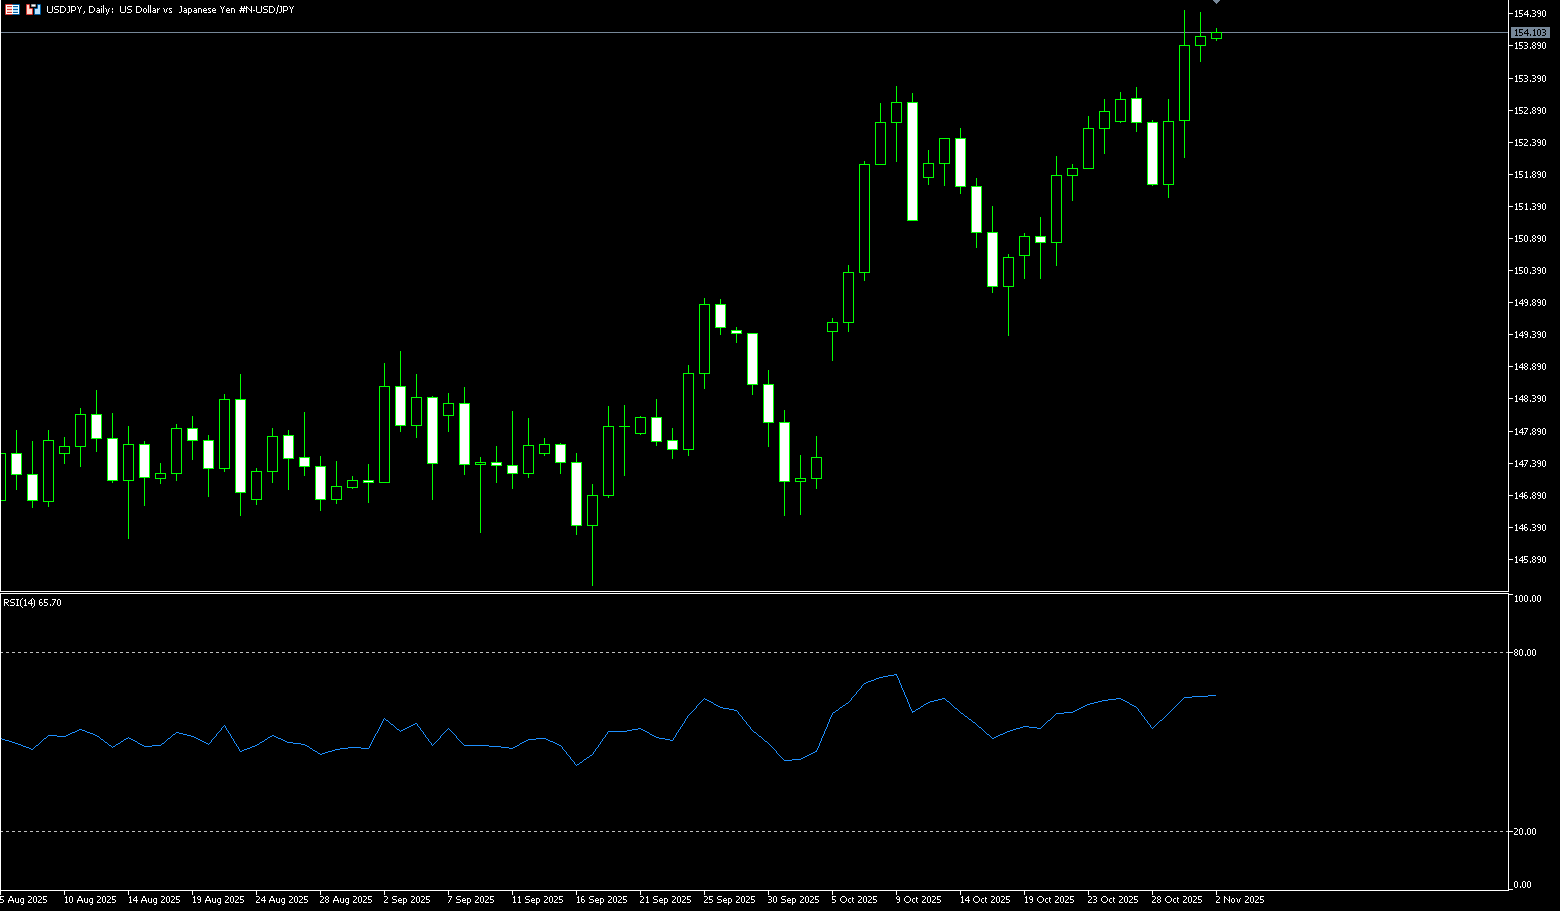
The yen hovered around 154 yen per dollar on Friday, near a nine-month low, and is on track for a sharp 4% drop this month, pressured by the election of Prime Minister Sanae Takaichi, who supports expansionary fiscal measures and loose monetary policy. The Bank of Japan also kept interest rates unchanged this month, with Governor Kazuo Ueda warning that global trade policies could drag down growth and hurt corporate profits. Meanwhile, new Finance Minister Satsuki Katayama clarified that she no longer supports her March comments, suggesting the yen's fair value is around 120 to 130 yen per dollar, stating her current role is to oversee monetary policy. Recent data also showed that Tokyo's core inflation rate rose more than expected in October, complicating the domestic policy outlook. Externally, Federal Reserve Chairman Jerome Powell said last week that December... Further rate cuts at the meeting were not a certainty. Traders reacted quickly, reducing bets on more easing this year, which in turn pushed the dollar to its highest level since early August on Thursday, and the USD/JPY pair also rose to an eight-month high.
From a technical perspective, the break above the 153.25-153.30 area (the swing high of last month) and the subsequent break above 154.00 to a nine-month high of 154.45 are considered key triggers for the USD/JPY bulls. Furthermore, oscillators on the daily chart remain comfortably in positive territory and are still far from overbought territory. This, in turn, supports the rationale for buying on dips. However, spot prices appear poised to climb further, breaking through the mid-154.00 area towards the 154.80 area (February 12 high), and ultimately reaching the psychological level of 155.00. And 155.88 {the high of February 3rd}. On the other hand, a break below 153.24 {the 5-day simple moving average} would target the psychological level of 153.00. A decisive break below this level could expose the overnight low around 152.15. Further selling below 152.07 {the 20-day simple moving average} would negate any short-term positive bias and pave the way for a deeper drop to 151.18 {the 25-day simple moving average}.
Consider shorting the US dollar today at 154.30. Stop loss: 154.55. Target: 153.20, 153.00
EUR/USD
The euro traded near a three-month low of 1.1521 against the dollar last week, reflecting market caution. The major currency pair struggled to rally as the dollar remained strong, supported by multiple positive factors—weakening expectations of a dovish stance from the Federal Reserve and continued improvement in trade tensions. The dollar index, after hitting its highest level since early August (99.74) on Thursday, is consolidating its strong gains from the previous two trading days, a key factor limiting the euro's upside against the dollar. Federal Reserve Chairman Powell stated at the press conference following last week's rate cut that further monetary easing in December is "far from a done deal," and market expectations of a dovish stance from the Fed have gradually cooled. Against this backdrop, any meaningful dollar depreciation now seems unlikely. These factors will help prevent the dollar from falling further. On the other hand, the European Central Bank kept its key deposit rate unchanged at 2% for the third consecutive time last Thursday, stating that inflation remains close to its 2% medium-term target. Furthermore, disagreements among policymakers regarding future rate cuts may dampen aggressive bullish bets on the euro, thus limiting the euro's upside potential against the dollar.
The daily chart shows that despite strong selling pressure over the past week, EUR/USD is currently trading within a narrow range of 1.1500 to 1.1700. The pair has now broken below the 1.1599 (5-day simple moving average) and 1.1600 (psychological level), confirming a short-term bearish bias. The 14-day Relative Strength Index (RSI) is at a low of 37.37, still above oversold levels but showing renewed downward pressure, while the Average Directional Index (ADX) is near 15, indicating continued weakness in the current trend. The moving average convergence/divergence indicator reflects strong negative momentum. Bears are now focusing on the key support area near the 1.1500 (psychological level). Below this, 1.1441 (175-day simple moving average) is a reasonable target, followed by the 1.1400 level. Comparatively, there is minor resistance at 1.1660 (10-day simple moving average), followed by last week's high of 1.1668 (October 28th). Above that is the October upper limit of 1.1778 (October 1st), and a break above that area would reveal the milestone of the 1.1800 psychological level.
Today, consider going long on the Euro at 1.1525, with a stop loss at 1.1510 and targets at 1.1585 and 1.1595.

Disclaimer: The information contained herein (1) is proprietary to BCR and/or its content providers; (2) may not be copied or distributed; (3) is not warranted to be accurate, complete or timely; and, (4) does not constitute advice or a recommendation by BCR or its content providers in respect of the investment in financial instruments. Neither BCR or its content providers are responsible for any damages or losses arising from any use of this information. Past performance is no guarantee of future results.
更多报道


风险披露:衍生品在场外交易,采用保证金交易,意味着具有高风险水平,有可能会损失所有投资。这些产品并不适合所有投资者。在进行交易之前,请确保您充分了解风险,并仔细考虑您的财务状况和交易经验。如有必要,请在与BCR开设账户之前咨询独立的财务顾问。
BCR Co Pty Ltd(公司编号1975046)是一家根据英属维尔京群岛法律注册成立的公司,注册地址为英属维尔京群岛托尔托拉岛罗德镇Wickham’s Cay 1的Trident Chambers,并受英属维尔京群岛金融服务委员会监管,牌照号为SIBA/L/19/1122。
Open Bridge Limited(公司编号16701394)是一家根据2006年《公司法》注册成立并在英格兰和威尔士注册的公司,注册地址为 Kemp House, 160 City Road, London, City Road, London, England, EC1V 2NX.本公司仅作为支付处理方运作,不提供任何交易或投资服务。

 English
 简体中文
简体中文
 繁體中文
繁體中文
 Bahasa
Melayu
Bahasa
Melayu
 Tiếng
Việt
Tiếng
Việt
 ไทย
ไทย
 日本語
日本語
 한국어
한국어
 ភាសាខ្មែរ
 español