


0
US Dollar Index
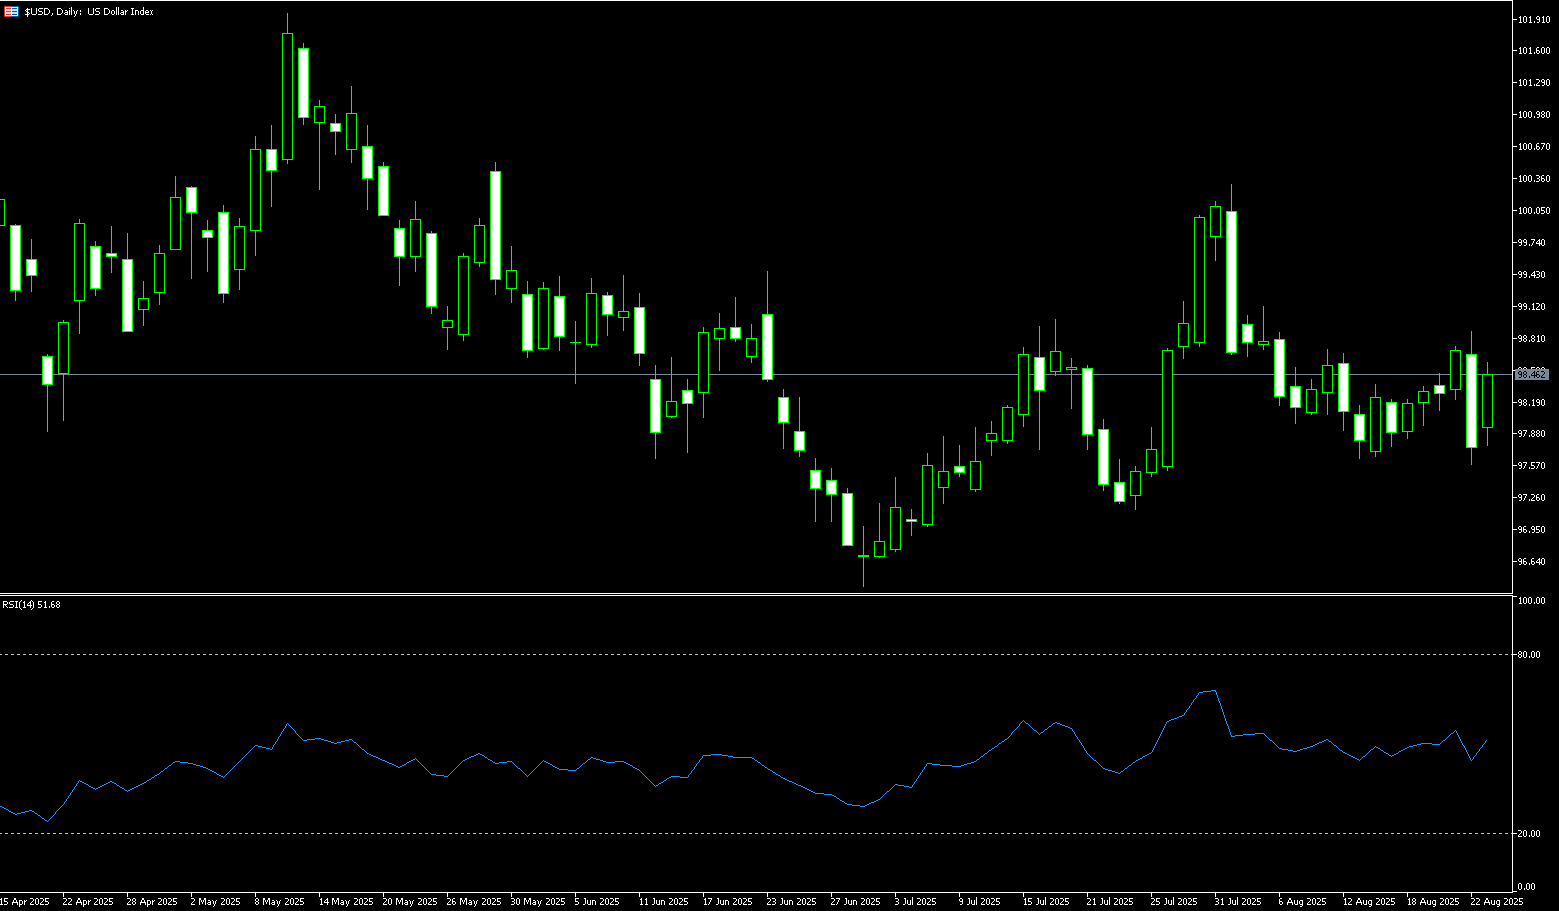
The US dollar index climbed to 98.40 on Monday, recouping some of the previous session's losses, as investors continued to assess the Federal Reserve's policy outlook. Last Friday, the index fell nearly 1% after Chairman Powell hinted at a possible interest rate cut in his Jackson Hole speech. Powell emphasized that despite the low unemployment rate, risks to the labor market are increasing and monetary policy remains "restrictive," suggesting that adjustments may be necessary. He also cited changes in tax, trade, and immigration policies as key factors in reshaping the economic landscape. Markets are now pricing in an 87% probability of a 25 basis point rate cut in September, up from around 75% at one point last week. Focus will turn to Friday's release of the July personal consumption expenditures price index, the Fed's preferred inflation measure, for further policy signals.
The daily chart shows that the 14-day Relative Strength Index (RSI), a technical indicator of the US dollar index, has rebounded above near 50 before continuing to move sideways. Currently, the US dollar index is fluctuating between 98.00 (round mark) and 98.75 (89-day simple moving average), reflecting a neutral stance in the short term. On the upside, 98.75 (75-day simple moving average) is the first key resistance level, followed by 99.00 (round mark), with a breakout targeting 99.34 (110-day simple moving average). On the other hand, given last Friday's close, which formed a bearish "penetration" pattern, if the US dollar index breaks below 97.70 (early week low), the next targets would be 97.19 (July 23 low) and the 97.00 (round mark) area.
Consider shorting the US Dollar Index at 98.55 today, with a stop-loss at 98.68 and targets at 98.05 and 98.00.
WTI Spot Crude Oil
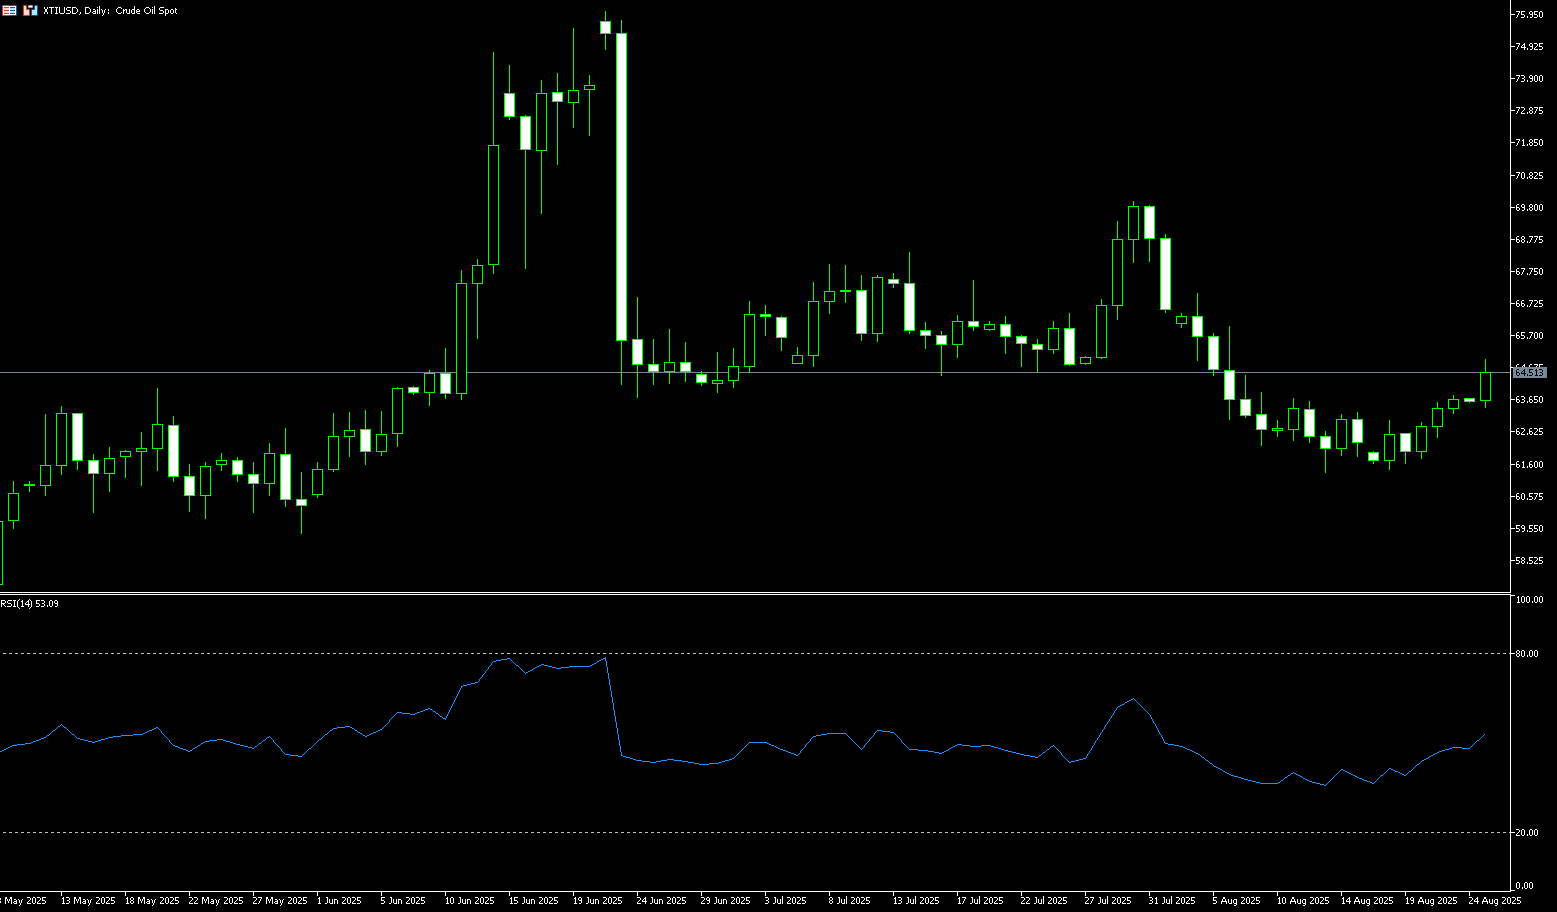
US crude oil began the week trading around $64.50 per barrel. Uncertainty over a possible peace agreement between Russia and Ukraine supported prices, with the US Vice President stating that new sanctions against Russia are "not out of the question." Amidst uncertainty over a possible peace agreement between Russia and Ukraine, oil prices stabilized last Friday, posting their first weekly gain in three weeks. A larger-than-expected drop in US crude oil inventories last week, indicating strong demand, also provided support. The US Energy Information Administration (EIA) reported on Wednesday that inventories fell by 6 million barrels in the week ending August 15. Analysts had expected a drop of 1.8 million barrels. German data released last Friday showed that Europe's largest economy contracted by 0.3% in the second quarter, raising concerns about oil demand.
The unexpected draw in US crude oil inventories indicates strong demand, and a weaker dollar tied to expectations of rate cuts could further boost crude oil prices. This increased demand strengthens the short-term bullish momentum. Crude oil prices maintain their bullish trend. The 20-day simple moving average (SMA) near $64.26 is key resistance on the daily chart. A break above this level could open up potential for a recovery towards $65.76 (the 50.0% Fibonacci retracement of the $54.78 to $76.74 range). A break below this level could lead to a test of the 200-day SMA at $67.20. Weaker demand data or a de-escalation of the Russia-Ukraine conflict could pull prices back to the first support level of $62.79. A break below this level could lead to a test of $61.35 (the August 13 low), followed by a potential challenge of $60.00 (the psychological market level).
Consider going long on crude oil at 64.40 today. Stop-loss: 64.20. Target: 65.00, 65.30.
Spot Gold
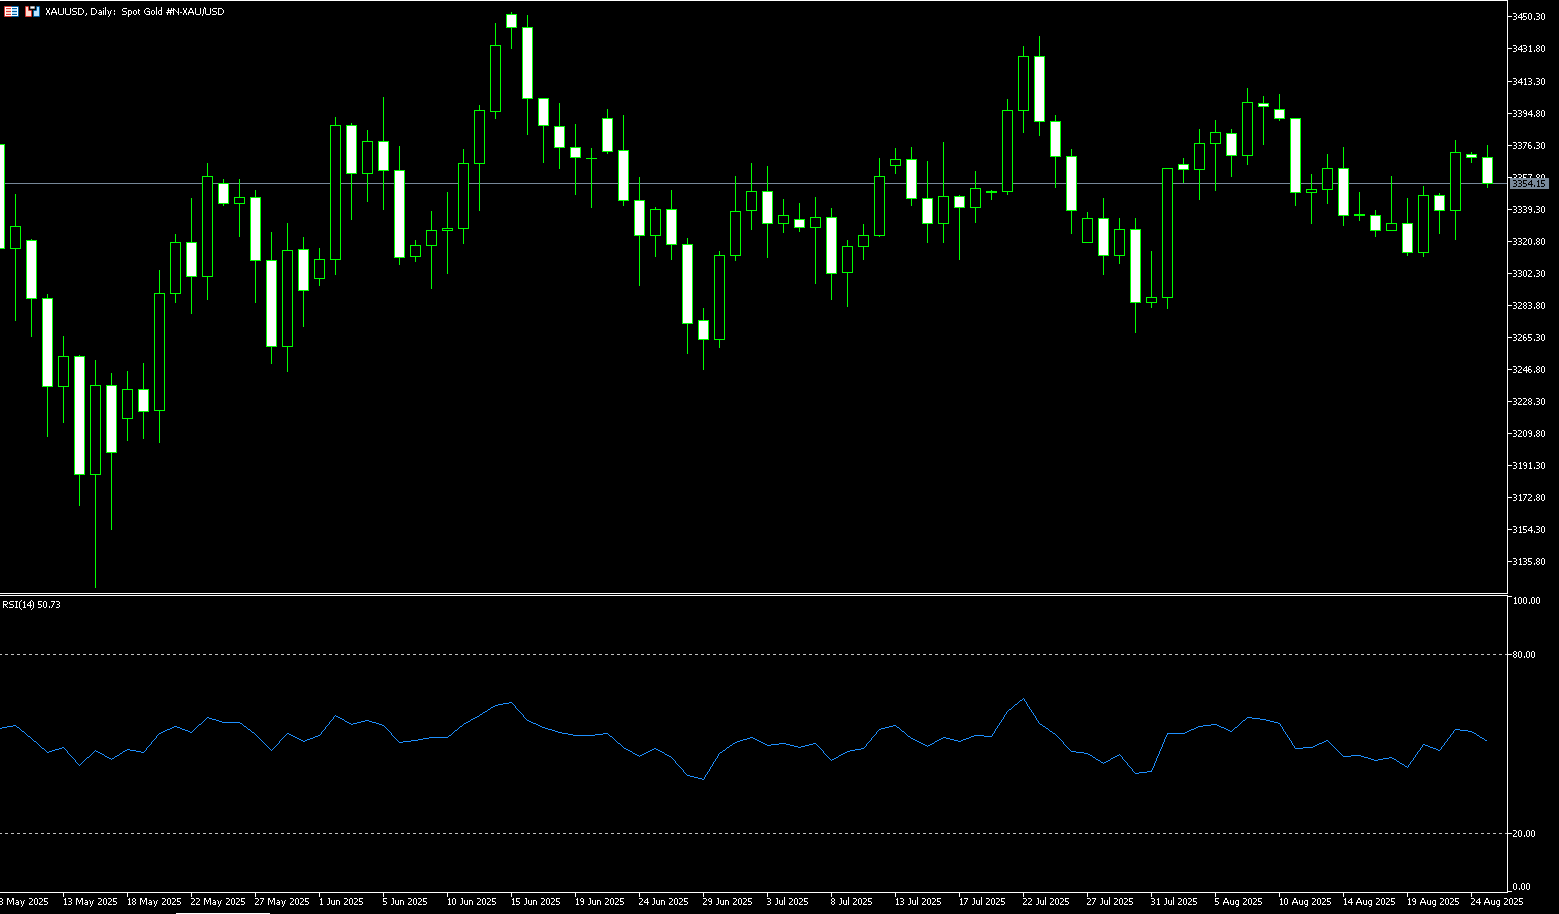
On August 25th, Beijing time, spot gold was trading around $3,365/oz. Last Friday, gold prices surged 1%, reaching a two-week high of $3,378.69/oz. Federal Reserve Chairman Powell's speech at the annual Jackson Hole central bank symposium was a timely relief, quenching market concerns about inflation and igniting investors' eager anticipation for a September rate cut. This not only drove a strong rebound in gold prices but also caused a sharp drop in the US dollar, ushering in a new wave of bullishness in the gold market. Despite sluggish physical demand in Asia, Wall Street analysts and retail investors alike remain confident in the outlook for gold. Powell's dovish statement is clearly a positive signal, and the recent weakness in gold prices presents an excellent buying opportunity. Gold is expected to continue its upward trajectory.
From a technical perspective, spot gold is currently forming a symmetrical triangle pattern, indicating a significant decrease in market volatility. The upper limit of the pattern is $3,415, and the lower limit is $3,306. Gold prices are currently fluctuating above the 20-day moving average at $3,348, indicating a neutral short-term trend, with market participants yet to reach a clear direction. The 14-day relative strength index (RSI) is fluctuating slightly above the 50.00 level, suggesting hesitant market sentiment and a lack of clear momentum. If gold prices weaken below the 20-day simple moving average at $3,348, they could continue to weaken in the short term, potentially reaching lows of $3,321.50 (last Friday) and $3,310.50 (the 100-day simple moving average). Conversely, a break above the $3,400.00 level (round-number mark) and $3,409.50 (the August 8 high) could push gold prices towards resistance at the July 23 high of $3,439.00. Momentum could extend further towards the previous all-time high of $3,500.
Consider going long on gold at $3,362 today, with a stop-loss at $3,358 and targets at $3,385 and $3,390.
AUD/USD
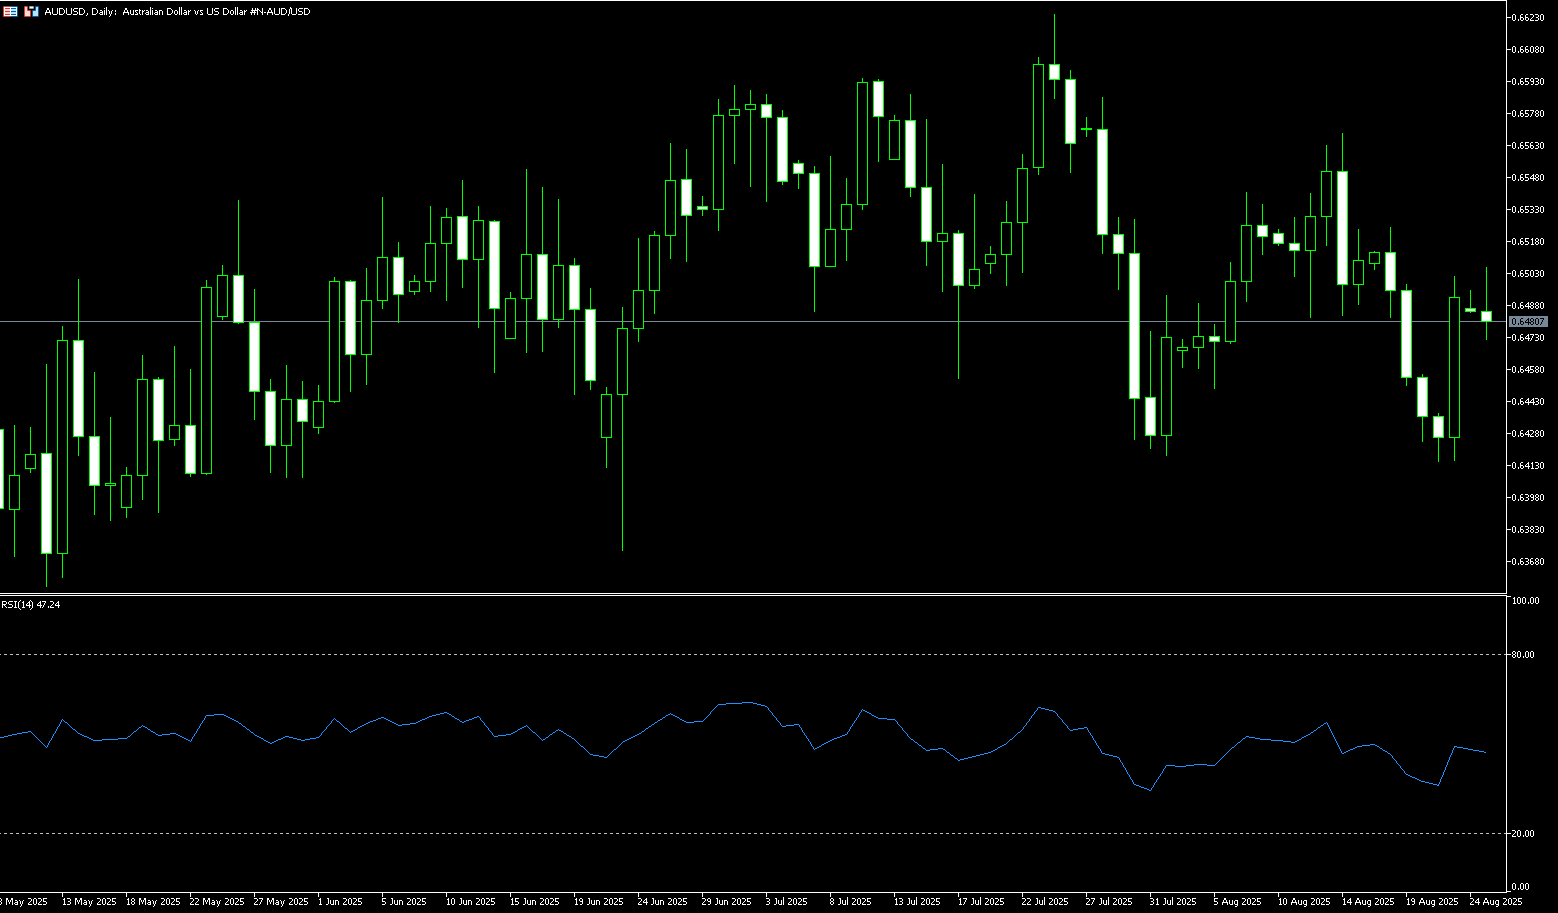
The Australian dollar weakened to around $0.6480 on Monday, retreating from a 1.1% gain in the previous session. The US dollar was seen as attempting to recover from dovish comments from Federal Reserve Chairman Powell. At the Fed's annual Jackson Hole symposium on Friday, Powell indicated a possible rate cut at the September 17 meeting, citing rising risks to employment. Following his speech, the market now prices a near 85% probability of a September rate cut, with a 48 basis point reduction expected for the full year. Key upcoming data releases, including the PCE inflation index on Wednesday and August employment data on Friday, will influence the Fed's next move. Domestically, the Reserve Bank of Australia (RBA) cut its cash rate by 25 basis points to 3.60% last week and is expected to remain cautious, with markets pricing in a further 50 basis point cut in November. Traders now await the release of the August meeting minutes on Tuesday, which will shed further light on the central bank's policy stance.
AUD/USD traded above 0.6480 on Monday. Technical analysis on the daily chart suggests the pair is attempting to break out of a descending channel pattern, suggesting a possible shift in bias from bearish to bullish. Initial resistance lies at the 50-day simple moving average at 0.6514, and the 0.6524 area (the high of August 24). A successful break above this key resistance zone could establish a bullish bias and support the pair towards the monthly high of 0.6568 reached on August 14, followed by the nine-month high of 0.6625 recorded on July 24. On the downside, AUD/USD could find immediate support at the 100-day simple moving average at 0.6463. A break below this level would weaken short-term price momentum and exert downward pressure on the pair, targeting the two-month low of 0.6414 recorded on August 21.
Consider a long position on the Australian dollar at 0.6470 today, with a stop-loss at 0.6460 and targets at 0.6530 and 0.6540.
GBP/USD
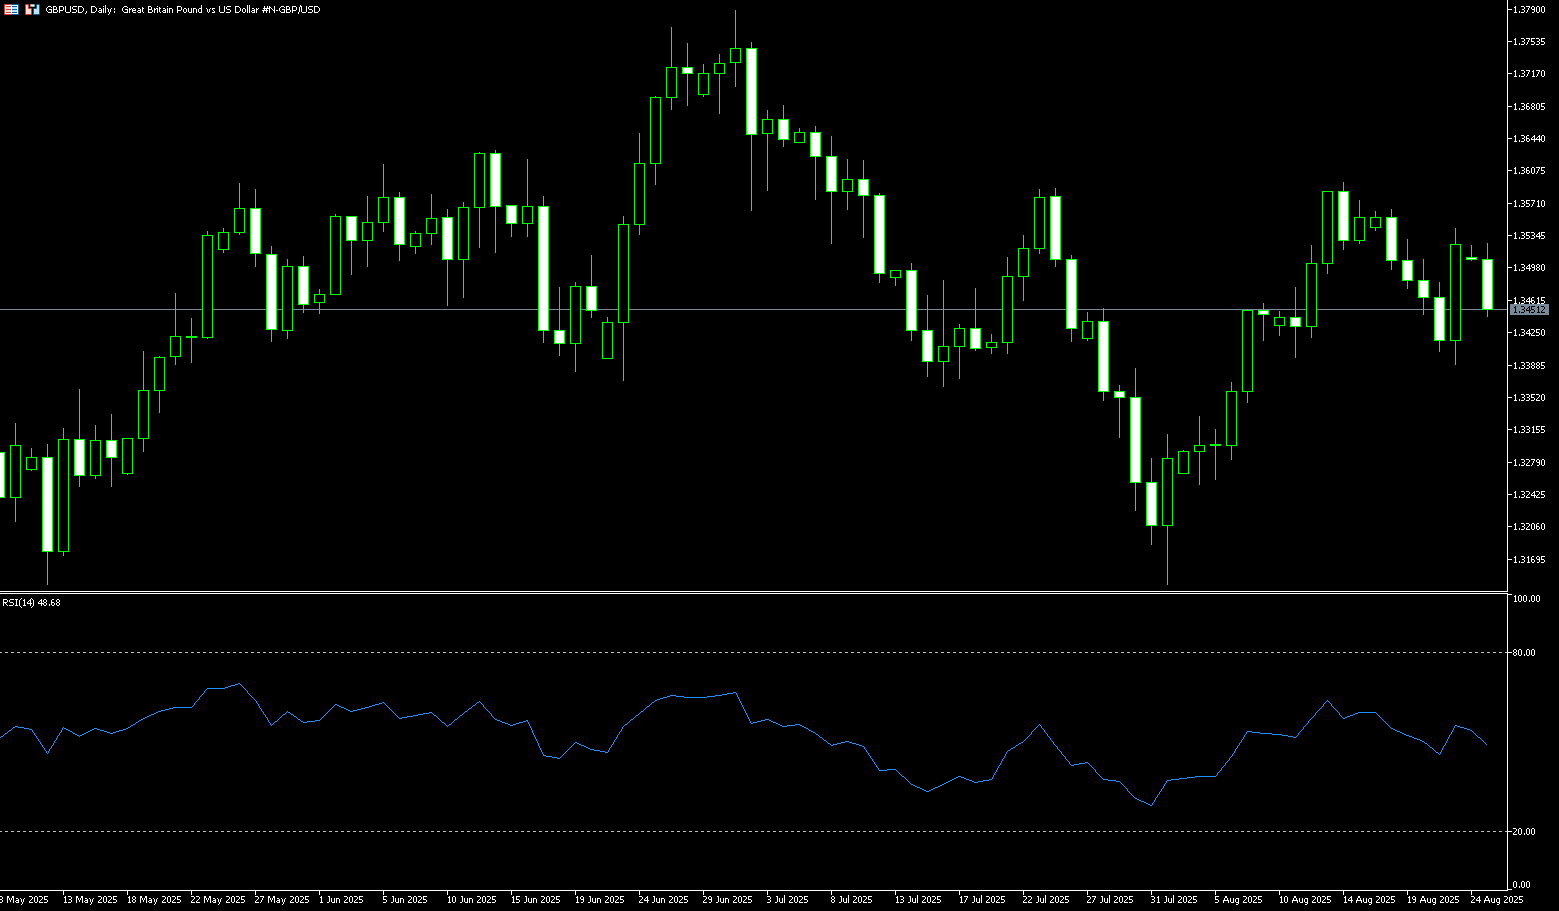
GBP/USD traded below 1.3500 on Monday. Major currency pairs edged lower due to renewed demand for the US dollar. However, dovish comments from Federal Reserve Chairman Powell may limit GBP/USD's downside. Speaking at the Jackson Hole Symposium on Friday, Powell indicated the central bank could cut interest rates at its next policy meeting in September. Powell further noted that the US economy faces a "challenging landscape," with inflation risks now tilted to the upside and employment risks tilted to the downside. Rising expectations for a Fed rate cut could put pressure on the US dollar and help limit losses in major currency pairs. In the absence of significant UK economic data releases this week, the US dollar's dynamics are likely to drive major currency pairs in the short term.
The daily chart shows that after four consecutive days of decline last week, the GBP/USD pair surged above 1.3500 to a high of 1.3544 before the weekend, opening the door to further gains. The shortening of the MACD green bars suggests a weakening of bearish momentum. Meanwhile, the 14-day Relative Strength Index (RSI) has rebounded to 55.00, indicating that the GBP/USD exchange rate is neutral to positive, with bullish momentum beginning to increase. If the pair can rebound above 1.3500, it could test resistance at last week's high of 1.3544. A break above 1.3544 would target the August 14 high of 1.3594, followed by 1.3600. Conversely, a break below 1.3480 support could accelerate the decline towards the 100-day simple moving average of 1.3423 and the 1.3400 level.
Consider going long on the British pound at 1.3445 today, with a stop-loss at 1.3432 and a target of 1.3500 or 1.3510.
USD/JPY
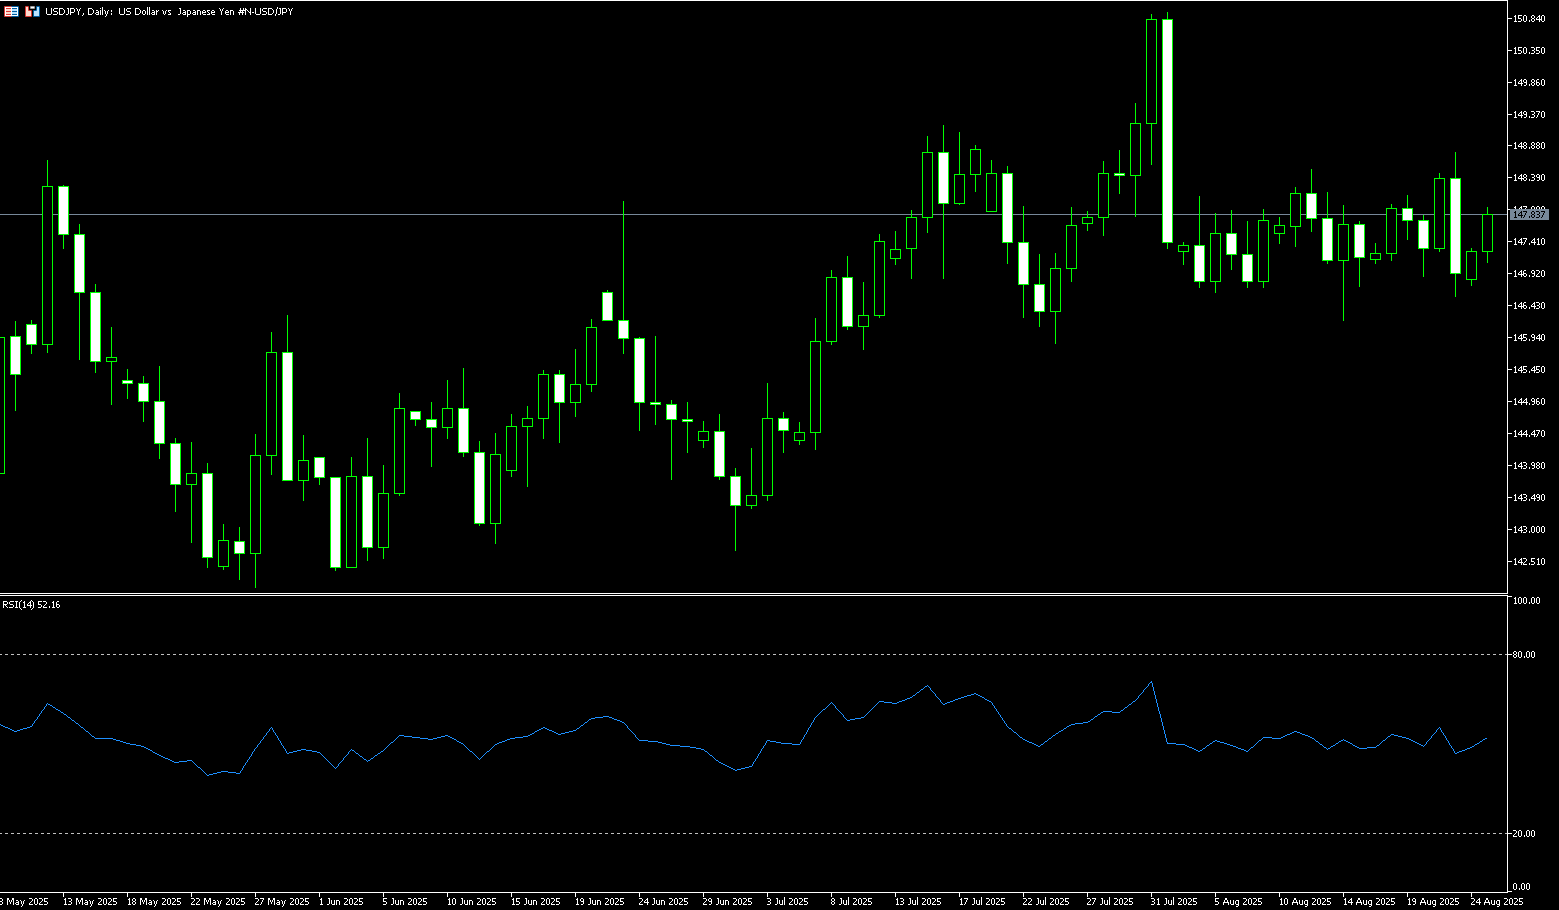
The yen weakened to around 147.70 against the dollar on Monday, giving up gains from the previous session despite hawkish comments from Bank of Japan Governor Kazuo Ueda. Ueda stated at the Federal Reserve's Jackson Hole conference on Saturday that he expects Japanese wages to rise further as the labor market tightens, suggesting conditions are ripe for another rate hike. The Bank of Japan has paused its rate hike cycle due to concerns about the impact of US tariffs on Japan's export-driven economy. At its July meeting, the central bank kept interest rates unchanged but raised its inflation forecast and offered a more optimistic economic outlook, maintaining expectations for another rate hike later this year. Meanwhile, the yen gained 1% last Friday after Fed Chairman Powell indicated a willingness to cut interest rates.
The daily chart shows a volatile but generally bullish USD/JPY trend, characterized by a series of gradually higher lows (albeit a somewhat irregular pattern). A break above the 148.00 round-figure mark could signal a continued rally, with 148.78 (last week's high) in focus. A break above this level could target the psychological 150.00 mark. A break below that level would target 150.92 (August 1 high). However, given the bearish signals on the weekly chart, bulls should exercise caution if USD/JPY retreats to the 147.00 round-figure mark and 146.87 (last week's low). This is because 148.78 (last week's high) could form a potential short-term top pattern. Therefore, short-term targets below would be the 146.00 (round number) and 145.97 (115-day simple moving average) levels.
Consider shorting the US dollar at 148.00 today. Stop-loss: 148.20, target: 146.90-146.80.
EUR/USD
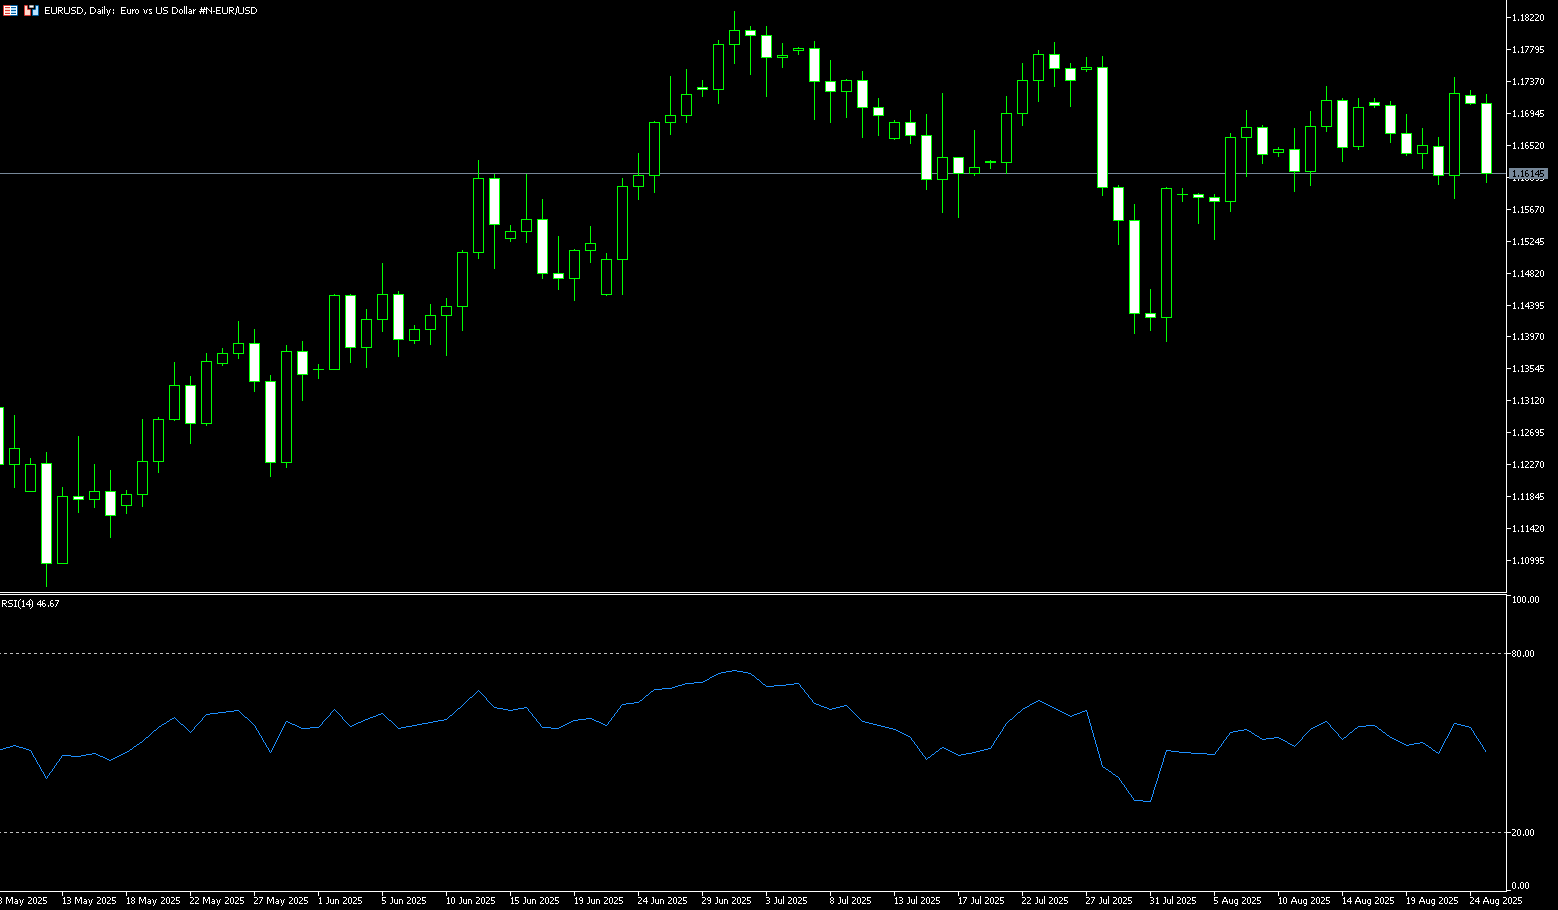
The euro weakened against the US dollar on Monday, with EUR/USD retreating below the psychological level of 1.1700. The greenback regained modest strength following dovish comments from Federal Reserve Chairman Powell at the Jackson Hole symposium. EUR/USD depreciated after posting a roughly 1% gain on Friday. However, the pair's downside may be limited as the US dollar is likely to continue weakening due to the increasing likelihood of a Fed rate cut in September, stemming from comments made by Fed Chairman Powell at the Jackson Hole symposium on Friday. ECB Governing Council member Joachim Nagel stated at Jackson Hole that the central bank would need a significant change in the economic outlook before lowering borrowing costs again. The daily chart shows that the EUR/USD uptrend appears to have resumed in late last week.
After reaching last week's high of 1.1742, the market is anticipating a move towards 1.1800. The 14-day Relative Strength Index (RSI) has re-entered above 49.00, indicating a bullish trend. The index is rising and poised to surpass its recent high. The pair's first resistance level is last week's high of 1.1742, followed by the psychologically important 1.1800 level. A break above this level would target the year's high of 1.1830. On the other hand, a daily close below 1.1600 would open the door to a test of the 75-day simple moving average at 1.1550. A break below this level would target the 89-day simple moving average at 1.1506 and the 1.1500 round-figure mark.
Today, you can consider going long on EUR at 1.1608, stop loss: 1.1600, target: 1.1660; 1.1670
Disclaimer: The information contained herein (1) is proprietary to BCR and/or its content providers; (2) may not be copied or distributed; (3) is not warranted to be accurate, complete or timely; and, (4) does not constitute advice or a recommendation by BCR or its content providers in respect of the investment in financial instruments. Neither BCR or its content providers are responsible for any damages or losses arising from any use of this information. Past performance is no guarantee of future results.


リスク開示:デリバティブはオーバーザカウンターで取引され、証拠金が必要です。そのため、高いリスクを伴い、投資のすべてを失う可能性があります。これらの商品はすべての投資家に適しているわけではありません。取引する前にリスクを十分に理解し、財務状況と取引経験を注意深く考慮してください。必要に応じて独立した金融アドバイスを受けてください。

 English
 简体中文
简体中文
 繁體中文
繁體中文
 Bahasa
Melayu
Bahasa
Melayu
 Tiếng
Việt
Tiếng
Việt
 ไทย
ไทย
 日本語
日本語
 한국어
한국어
 ភាសាខ្មែរ
 español